
Market Overview
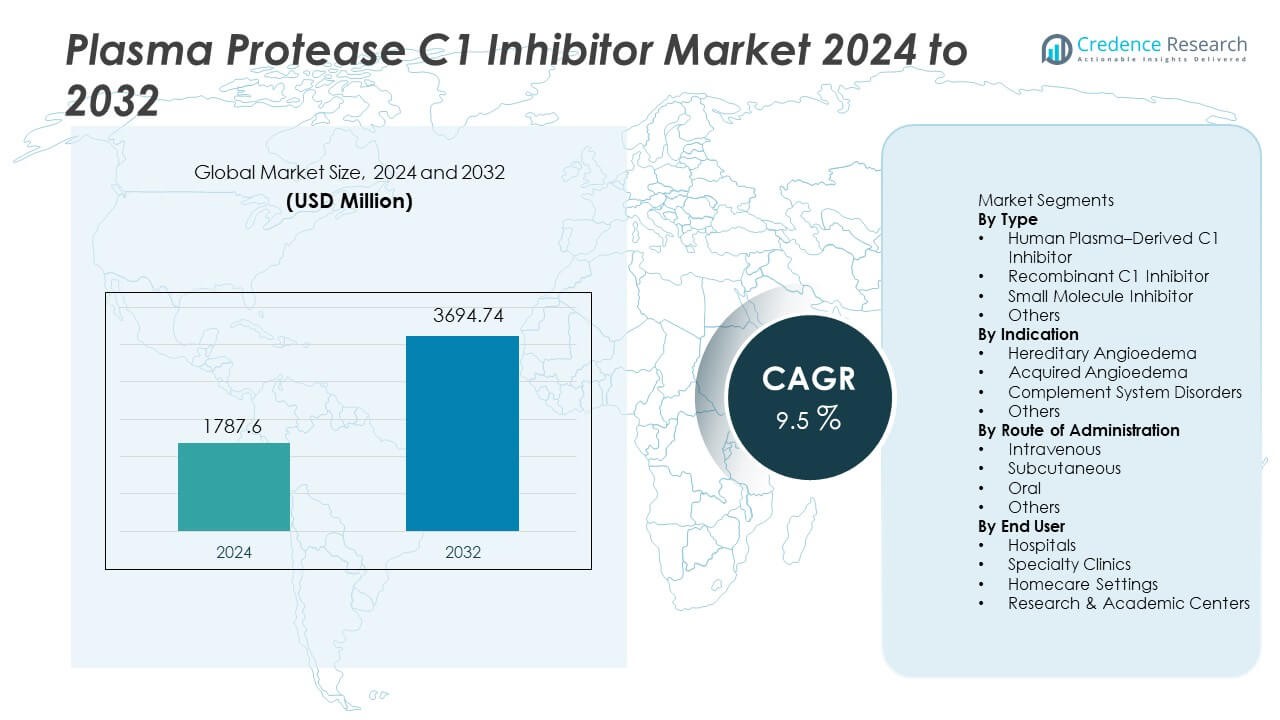
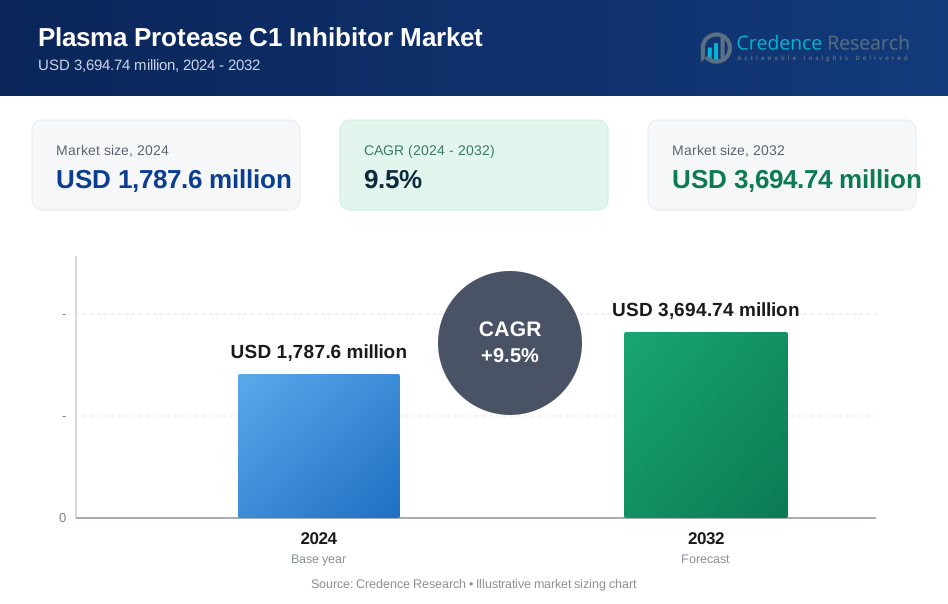
The Plasma Protease C1 Inhibitor market was valued at USD 1,787.6 million in 2024 and is projected to reach USD 3,694.74 million by 2032, registering a CAGR of 9.5% during the forecast period.
| REPORT ATTRIBUTE | DETAILS |
|---|---|
| Historical Period | 2020-2023 |
| Base Year | 2024 |
| Forecast Period | 2025-2032 |
| Plasma Protease C1 Inhibitor Market Size 2024 | USD 1,787.6 Million |
| Plasma Protease C1 Inhibitor Market, CAGR | 9.5% |
| Plasma Protease C1 Inhibitor Market Size 2032 | USD 3,694.74 Million |
Top players in the Plasma Protease C1 Inhibitor market include Takeda Pharmaceutical, CSL Behring, Grifols, Pharming Group, Sanquin, BioCryst Pharmaceuticals, Octapharma, LFB Group, Kedrion Biopharma, and Biotest AG. These companies strengthen their position through plasma-derived capacity expansion, development of recombinant formulations, and investment in preventive and home-based therapy for hereditary angioedema. North America remains the leading region with a 47% share, driven by strong diagnosis rates, favorable reimbursement, and advanced rare disease infrastructure. Europe follows with a 32% share, supported by established clinical guidelines and widespread use of preventive therapy, while Asia Pacific holds a 15% share with growing specialty care and rare disease coverage.
Market Insights
- The Plasma Protease C1 Inhibitor market reached USD 1,787.6 million in 2024 and will reach USD 3,694.74 million by 2032 at a CAGR of 9.5% during the forecast period.
- Increasing diagnosis of hereditary angioedema drives market expansion, with human plasma–derived C1 inhibitors holding a 57% share due to established clinical efficacy and strong physician preference across major healthcare systems.
- Market trends focus on recombinant development, long-acting formulations, and home-based administration supported by subcutaneous delivery and preventive treatment strategies that reduce emergency care needs.
- Competitive activity centers on expanded plasma capacity, clinical research for broader immunological indications, and collaboration with specialty pharmacies, while limited patient population and high treatment cost remain major restraints in developing markets.
- North America leads regional demand with a 47% share, followed by Europe at 32% and Asia Pacific at 15%, supported by strong diagnosis rates, rare disease programs, and improved access to preventive therapy in emerging healthcare systems.
Market Segmentation Analysis:
By Type
Human plasma–derived C1 inhibitor leads this segment with a 57% share, driven by established clinical efficacy in hereditary and acquired angioedema and consistent regulatory approvals across major markets. Hospitals and specialty infusion centers continue to favor plasma-based therapies due to long-standing clinical use and strong physician preference. Recombinant products grow through increasing awareness of viral safety and improved supply reliability, while small molecule inhibitors remain in development stages targeting complement system modulation. Rising global diagnosis rates and expanding treatment guidelines sustain strong demand for plasma-origin C1 inhibitors in many healthcare systems.
- For instance, Takeda Pharmaceutical collected patient data and reported safety information to regulatory agencies during its programs for its plasma-derived C1 esterase inhibitor, Cinryze, while Pharming Group documented its supply of its recombinant C1 inhibitor, Ruconest, supported by manufacturing capacity.
By Indication
Hereditary angioedema accounts for a 68% share, supported by higher diagnosis rates, genetic testing adoption, and improved disease awareness among allergists and immunologists. Patients require on-demand and preventive treatment to control life-threatening angioedema attacks. Acquired angioedema follows due to increased screening for complement deficiency in older patients and autoimmune conditions. Complement system disorders create new therapeutic opportunities as clinical research expands indications. Rising identification of hereditary cases in developing regions strengthens market growth for C1 inhibitors across hospital and specialty care environments.
- For instance, BioCryst Pharmaceuticals reported significant patient experience data for its prophylactic agent Orladeyo, including documented reduction in HAE attack frequency across treated populations verified under FDA-approved post-marketing surveillance.
By Route of Administration
Intravenous administration holds a 63% share, supported by established hospital protocols and consistent dosing during acute hereditary angioedema attacks. IV delivery remains the standard of care in emergency and inpatient settings due to rapid onset and clinical familiarity. Subcutaneous formulations gain adoption in long-term prophylaxis and home-based therapy that reduces hospital dependency and improves patient convenience. Oral candidates remain under development with significant commercial potential for chronic management. Growing emphasis on homecare settings and preventive treatment expands interest in subcutaneous administration across many markets.
Key Growth Drivers
Rising Diagnosis of Hereditary Angioedema
Increasing global diagnosis of hereditary angioedema supports strong clinical demand for C1 inhibitors. Growing access to genetic testing enables earlier identification of complement deficiency and helps physicians implement preventive treatment strategies. Improved awareness among allergists, immunologists, and emergency care teams strengthens adoption in developed healthcare systems. National patient registries and rare disease programs improve surveillance and treatment eligibility. These factors support steady growth of plasma-derived and recombinant products in both acute attack management and long-term prophylaxis.
- For instance, Pharming Group enrolled patients with genetically confirmed hereditary angioedema (HAE) in its Ruconest clinical and real-world programs, leveraging this data as part of its regulatory submissions.
Expansion of Prophylactic Treatment and Homecare Use
Preventive therapy adoption rises as clinical guidelines encourage long-term prophylaxis to reduce attack frequency and hospital visits in hereditary angioedema patients. Subcutaneous delivery supports home-based administration that lowers emergency care utilization. Patient preference for self-injection and improved treatment convenience increases demand for next-generation C1 inhibitors. Payer support for prevention instead of emergency treatment improves reimbursement acceptance. Growth of home infusion services and chronic care programs encourages wider adoption of subcutaneous formulations.
- For instance, companies in general have documented administrations of C1 esterase inhibitors through both intravenous and subcutaneous routes in clinical studies and post-marketing surveillance programs.
Growing Clinical Use in Acquired and Complement Disorders
Rising incidence of acquired angioedema and complement-mediated conditions expands clinical use beyond hereditary cases. Aging populations and autoimmune disorders increase complement involvement that benefits from targeted inhibition. Off-label evaluation continues in inflammatory and immunological pathways linked with complement activation. Clinical studies explore broader indications that strengthen long-term adoption across specialty and research settings. As clinical evidence increases, C1 inhibitors gain therapeutic relevance in complex immune disorders outside hereditary disease management.
Key Trends and Opportunities
Development of Recombinant and Long-Acting Formulations
Recombinant C1 inhibitors gain interest due to improved viral safety and reduced supply dependence on plasma donation. Long-acting formulations target extended disease control and fewer dosing events to improve quality of life. Research focuses on reducing immunogenicity while improving pharmacokinetics. These developments support wider adoption in both prevention and emergency care, particularly in developed markets with strong biotechnology infrastructure.
- For instance, Sanofi is evaluating its next-generation C1s inhibitor, riliprubart, in multiple ongoing clinical trials for conditions like chronic inflammatory demyelinating polyneuropathy (CIDP).
Growth in Homecare and Self-Administration Models
Patients increasingly prefer home-based therapy supported by subcutaneous delivery and simplified dosing devices. Self-administration reduces emergency visits and improves attack control. Homecare adoption aligns with payer objectives for lower healthcare utilization and improved quality of life. Manufacturers develop ready-to-use formulations and easy injection systems that support long-term treatment adherence.
- For instance, CSL Behring recorded widespread home-based self-administrations of its subcutaneous C1 esterase inhibitor Haegarda in documented real-world usage, while Takeda Pharmaceutical reported many patients trained for home dosing through specialty nursing programs verified in North America and Europe.
Key Challenges
Limited Patient Population and High Treatment Cost
Hereditary angioedema remains a rare disease, limiting market volume and making pricing sensitive to reimbursement. High treatment cost presents barriers in developing regions with limited insurance coverage. Payers assess long-term cost effectiveness before approving preventive therapy. Limited awareness and diagnostic challenges also restrict patient identification.
Dependency on Plasma Collection and Regulatory Complexity
Plasma-derived products depend on donor availability and strict viral screening requirements. Manufacturing processes require complex purification, regulatory compliance, and long approval timelines. These factors increase overall cost and make supply sensitive to donor fluctuations. Recombinant solutions aim to reduce plasma dependency but require significant development investment and regulatory validation.
Regional Analysis
North America
North America holds a 47% share, supported by high diagnosis rates of hereditary angioedema, strong physician awareness, and broad reimbursement for preventive therapy. The United States leads usage due to advanced specialty infusion services and widespread availability of plasma-derived and recombinant C1 inhibitors. Subcutaneous formulations gain rapid adoption in homecare programs that reduce emergency treatment demand. Ongoing clinical trials and expansion of specialty pharmacy services encourage long-term therapy adoption. Well-established rare disease networks and patient advocacy groups support treatment access across major healthcare systems in the region.
Europe
Europe accounts for a 32% share, driven by established clinical guidelines for hereditary angioedema and widespread adoption of preventive therapy. Countries including Germany, France, Italy, and the United Kingdom maintain strong access to plasma-derived and recombinant C1 inhibitors through reimbursement support. Increased disease awareness and genetic screening improve earlier diagnosis and specialist referral. Regulatory focus on rare disease treatment supports sustained demand across hospitals and specialty clinics. Patient registries and coordinated care programs strengthen access and long-term treatment adherence across major European markets.
Asia Pacific
Asia Pacific holds a 15% share, supported by growing diagnosis of hereditary angioedema and improving access to specialty care in Japan, South Korea, and Australia. China and India gradually expand rare disease coverage and genetic testing, although access varies by region. Emerging plasma supply and expanding clinical capabilities improve treatment availability. Awareness campaigns and physician training support demand growth for C1 inhibitors. Increasing investment in biotechnology and healthcare infrastructure strengthens long-term adoption across selected markets that expand rare disease treatment capacity.
Latin America
Latin America represents a 4% share, driven by gradual improvement in rare disease diagnosis and treatment availability in Brazil, Mexico, and Argentina. Hospitals rely on imported C1 inhibitors due to limited plasma fractionation capacity and higher cost barriers. Specialty access remains concentrated in major urban centers with advanced immunology services. Governments expand rare disease reimbursement frameworks, improving patient access in selected markets. Long-term adoption depends on investment in diagnostic and clinical capacity.
Middle East and Africa
Middle East and Africa hold a 2% share, supported by improved treatment availability in Gulf countries with advanced specialty care infrastructure. Import dependency remains high across most markets due to limited plasma collection and localized production. Diagnostic awareness remains low in many African countries, restricting patient identification. Gradual development of rare disease programs and collaborations with international suppliers support selective adoption across major hospitals and specialty centers.
Market Segmentations:
By Type
- Human Plasma–Derived C1 Inhibitor
- Recombinant C1 Inhibitor
- Small Molecule Inhibitor
- Others
By Indication
- Hereditary Angioedema
- Acquired Angioedema
- Complement System Disorders
- Others
By Route of Administration
- Intravenous
- Subcutaneous
- Oral
- Others
By End User
- Hospitals
- Specialty Clinics
- Homecare Settings
- Research & Academic Centers
By Geography
- North America
- U.S.
- Canada
- Mexico
- Europe
- Germany
- France
- U.K.
- Italy
- Spain
- Rest of Europe
- Asia Pacific
- China
- Japan
- India
- South Korea
- South-east Asia
- Rest of Asia Pacific
- Latin America
- Brazil
- Argentina
- Rest of Latin America
- Middle East & Africa
- GCC Countries
- South Africa
- Rest of the Middle East and Africa
Competitive Landscape
Competitive landscape in the Plasma Protease C1 Inhibitor market features leading companies such as Takeda Pharmaceutical, CSL Behring, Grifols, Pharming Group, Sanquin, BioCryst Pharmaceuticals, Octapharma, LFB Group, Kedrion Biopharma, and Biotest AG. Major players focus on expanding plasma-derived production capacity, improving purification processes, and developing recombinant alternatives that strengthen supply security and viral safety. Companies invest in clinical research to broaden therapeutic indications beyond hereditary angioedema, targeting acquired complement disorders and immunological pathways. Subcutaneous and long-acting formulations remain a strategic focus to support preventive therapy and home administration, reducing emergency visits and improving patient outcomes. Many players expand partnerships with specialty pharmacies and rare disease centers to increase treatment access in developed markets. Regulatory emphasis on advanced biologics and rare disease reimbursement continues to shape product approvals and regional expansion strategies.
Key Player Analysis
- Takeda Pharmaceutical
- CSL Behring
- Grifols
- Pharming Group
- Sanquin
- BioCryst Pharmaceuticals
- Octapharma
- LFB Group
- Kedrion Biopharma
- Biotest AG
Recent Developments
- In May 2024, KalVista Pharmaceuticals plans strategic initiatives for fiscal year 2025, focusing on sebetralstat, their oral plasma kallikrein inhibitor for HAE.
- In May 2023, BioCryst Pharmaceuticals announced the marketing approval of its ORLADEYO (berotralstat), an oral treatment for HAE attacks in patients 12 years and above, by the Public Health Institute (ISP) of Chile.
- In February 2023, Takeda's TAKHZYRO received FDA approval for prophylactic treatment of hereditary angioedema (HAE) in pediatric patients aged 2 to <12 years old, filling a critical gap for children aged 2 to <6 who previously lacked approved options.
Report Coverage
The research report offers an in-depth analysis based on Type, Indication, Route of Administration, End User and Geography. It details leading market players, providing an overview of their business, product offerings, investments, revenue streams, and key applications. Additionally, the report includes insights into the competitive environment, SWOT analysis, current market trends, as well as the primary drivers and constraints. Furthermore, it discusses various factors that have driven market expansion in recent years. The report also explores market dynamics, regulatory scenarios, and technological advancements that are shaping the industry. It assesses the impact of external factors and global economic changes on market growth. Lastly, it provides strategic recommendations for new entrants and established companies to navigate the complexities of the market.
Future Outlook
- Future demand will rise as hereditary angioedema diagnosis continues to increase.
- Preventive therapy use will expand in long-term hereditary angioedema management.
- Subcutaneous delivery will gain wider adoption in homecare settings.
- Recombinant formulations will grow due to improved safety and supply.
- Long-acting therapies will reduce dosing frequency and improve convenience.
- Clinical research will expand treatment into acquired and complement disorders.
- Rare disease reimbursement will improve access in developed healthcare systems.
- Genetic testing adoption will support earlier identification of eligible patients.
- Emerging markets will gradually expand specialty care and diagnosis capacity.
- Competition among plasma-derived and recombinant products will strengthen innovation.
Request a Free Sample
Fill in your details and we'll send you a free sample report.
- Sample data tables & charts
- Research methodology
Need a Custom Version of This Report?
Tailor the scope, geography, or segments to your exact requirements.
- Custom geography or segment scope
- Direct access to our analyst team
Frequently Asked Questions
What is the current market size for the Plasma Protease C1 Inhibitor market, and what is its projected size in 2032?
At what Compound Annual Growth Rate is the Plasma Protease C1 Inhibitor market projected to grow between 2024 and 2032?
Which Plasma Protease C1 Inhibitor market segment held the largest share in 2024?
What are the primary factors fueling the growth of the Plasma Protease C1 Inhibitor market?
Who are the leading companies in the Plasma Protease C1 Inhibitor market?
Which region commanded the largest share of the Plasma Protease C1 Inhibitor market in 2024?
Table of Content
Chapter 1. Report Introduction
- 1.1 Report Description & Purpose
- 1.1.1 Report Title & Market Definition
- 1.1.2 Unique Selling Propositions (USP) & Key Differentiators
- 1.1.3 Value Proposition for Stakeholders
- 1.2 Research Objectives
- 1.2.1 Market Sizing Objectives (Volume & Revenue)
- 1.2.2 Segmentation Objectives
- 1.2.3 Competitive Intelligence Objectives
- 1.2.4 Forecast & Scenario Objectives
- 1.3 Report Scope
- 1.3.1 Plasma Protease C1 Inhibitor Scope – Types & Subtypes Covered
- 1.3.2 Geographic Scope – Regions & Countries Covered
- 1.3.3 Historical Period, Base Year & Forecast Period (2024; forecast to 2032)
- 1.3.4 Inclusions & Exclusions
- 1.4 HS Code & Classification Framework
- 1.5 Currency, Units & Pricing Basis
- 1.6 Target Stakeholders
- 1.7 Limitations & Assumptions
Chapter 2. Executive Summary
- 2.1 Global Plasma Protease C1 Inhibitor Market Snapshot
- 2.1.1 Market Size – Historical (2024) & Forecast (2024-2032) (2024: USD 1,787.6 million → 2032: USD 3,694.74 million)
- 2.1.2 Volume & Revenue – Global Totals
- 2.1.3 Key Market Highlights – Top Five Facts
- 2.2 Plasma Protease C1 Inhibitor Market Segmentation Snapshot
- 2.2.1 Market Split by Region – 2024 vs. 2032
- 2.3 Competitive Snapshot
- 2.3.1 Top 10 Players by Revenue Share – 2024
- 2.3.2 Top 10 Players by Volume Share – 2024
- 2.3.3 Recent Strategic Developments (18-Month Summary)
- 2.4 Key Investment Highlights & Strategic Conclusions
Chapter 3. Plasma Protease C1 Inhibitor Market Dynamics & Industry Analysis
- 3.1 Market Overview & Context
- 3.1.1 Plasma Protease C1 Inhibitor Market Position in the Broader Automotive Value Chain
- 3.1.2 OEM vs. Replacement Market Dynamics
- 3.1.3 Market Maturity & Development Stage by Region
- 3.2 Plasma Protease C1 Inhibitor Market Drivers
- 3.3 Plasma Protease C1 Inhibitor Market Restraints & Challenges
- 3.4 Plasma Protease C1 Inhibitor Market Opportunities
- 3.5 Porter's Five Forces Analysis
- 3.5.1 Threat of New Entrants
- 3.5.2 Bargaining Power of Suppliers
- 3.5.3 Bargaining Power of Buyers
- 3.5.4 Threat of Substitutes
- 3.5.5 Competitive Rivalry – Intensity Assessment
- 3.6 Plasma Protease C1 Inhibitor Value Chain Analysis
- 3.6.1 Upstream – Raw Material/Input Suppliers
- 3.6.1.1 Raw Material/Input 1
- 3.6.1.2 Raw Material/Input 2
- 3.6.1.3 Raw Material/Input 3
- 3.6.2 Midstream – Production/Manufacturing/Service Delivery
- 3.6.2.1 Production/Process Overview
- 3.6.2.2 Key Facility Locations & Capacity by Manufacturer
- 3.6.3 Downstream – Distribution & End Consumer
- 3.6.3.1 Primary Channel – B2B/OEM
- 3.6.3.2 Secondary Channels – Dealer, Retail, Online, Direct
- 3.6.4 Value Chain Profitability Analysis
- 3.6.1 Upstream – Raw Material/Input Suppliers
- 3.7 PESTEL Analysis
- 3.7.1 Political Factors
- 3.7.2 Economic Factors
- 3.7.3 Social Factors
- 3.7.4 Technological Factors
- 3.7.5 Environmental Factors
- 3.7.6 Legal Factors
- 3.8 Plasma Protease C1 Inhibitor Supply Chain Analysis
- 3.8.1 Raw Material/Input Supply Risk Assessment
- 3.8.2 Manufacturing Concentration Risk (Geographic Exposure)
- 3.8.3 Trade Disruption Impact Analysis
- 3.9 Regulatory & Policy Landscape
Note: The regulatory and policy landscape section covers regulations based on their applicability to the market, Plasma Protease C1 Inhibitor category, geography, and scope of the study. Only regulatory frameworks with a material impact on operations, compliance, trade, sustainability, or market access are analyzed in detail.
Chapter 4. Key Investment Pockets & Opportunity Analysis
- 4.1 Plasma Protease C1 Inhibitor Market Attractiveness Analysis
- 4.1.1 By Region – Investment Attractiveness Matrix (Volume × CAGR)
- 4.2 Absolute Revenue Growth Opportunity
- 4.2.1 By Region – Absolute USD Growth Through 2032
- 4.3 Incremental Volume Opportunity
- 4.3.1 By Region – Incremental Volume Through 2032
- 4.3.2 Segment – Incremental Volume
- 4.4 Emerging Submarket Opportunity Deep Dive (Subject to Applicability)
- 4.5 Emerging Market Opportunity Scorecards
- 4.5.1 United States
- 4.5.2 Europe
- 4.5.3 Asia
- 4.5.4 Middle East & Africa
Note: Emerging Market Opportunity Scorecards will be included based on relevance and strategic importance. Regions listed are indicative and may vary depending on data availability and market dynamics.
Chapter 5. Plasma Protease C1 Inhibitor Import-Export Analysis & Trade Flows
- 5.1 Global Trade Overview
- 5.1.1 Global Export Value by Country (2024)
- 5.1.2 Global Export Volume by Country (2024)
- 5.1.3 Global Import Value by Country (2024)
- 5.1.4 Global Import Volume by Country (2024)
- 5.1.5 Net Trade Balance by Country (2024)
- 5.2 Export Analysis – Segment
- 5.2.1 Type 1 (HS Code)
- 5.2.2 Type 2 (HS Code)
- 5.2.3 Type 3 (HS Code)
- 5.2.4 Type 4 (HS Code)
- 5.2.5 Type 5 (HS Code)
- 5.3 Import Analysis – Segment
- 5.3.1 Type 1 (HS Code)
- 5.3.2 Type 2 (HS Code)
- 5.3.3 Type 3 (HS Code)
- 5.3.4 Type 4 (HS Code)
- 5.3.5 Type 5 (HS Code)
- 5.4 Average Unit Trade Prices
- 5.4.1 Average Export Price – Segment & Country
- 5.4.2 Average Import Price – Segment & Source Country
- 5.4.3 Price Trends (2024)
- 5.5 Key Trade Route Analysis
- 5.5.1 Trade Route 1
- 5.5.2 Trade Route 2
- 5.5.3 Trade Route 3
- 5.5.4 Trade Route 4
- 5.5.5 Trade Route 5
- 5.6 Trade Policy Impact Assessment
- 5.6.1 US Anti-Dumping & Section 301 Tariffs
- 5.6.2 EU Customs Union Impact
- 5.6.3 Major Free Trade Agreements
- 5.6.4 USMCA Rules of Origin
Note: Trade policy analysis will be included only where relevant to the Plasma Protease C1 Inhibitor market.
Chapter 6. Competitive Landscape & Company Benchmarking
- 6.1 Plasma Protease C1 Inhibitor Market Concentration & Structure
- 6.1.1 Herfindahl-Hirschman Index (HHI) – vs. 2024
- 6.1.2 Tier 1, Tier 2 & Tier 3 Market Structure
- 6.1.3 Global, Regional & Local Player Dynamics
- 6.2 Plasma Protease C1 Inhibitor Market Share Analysis – 2024
- 6.2.1 Global Revenue Share by Company
- 6.2.2 Global Volume Share by Company
- 6.2.3 Regional Revenue Share
- 6.2.4 Market Share Evolution ( vs. 2024)
- 6.2.5 OEM Segment Share by Company
- 6.2.6 Replacement Segment Share by Company
- 6.3 Production/Delivery Capacity & Facility Analysis
- 6.3.1 Global Installed Capacity
- 6.3.2 Capacity Utilization Rates
- 6.3.3 Production/Output Volume
- 6.3.4 Facility Locations & Capacity Map
- 6.3.5 Planned Capacity Additions
- 6.4 Plasma Protease C1 Inhibitor Competitive Benchmarking Matrix
- 6.4.1 Revenue, Volume, CAGR & Profitability Comparison
- 6.4.2 Channel Revenue Mix
- 6.4.3 Geographic Revenue Exposure
- 6.4.4 R&D Intensity
- 6.4.5 Sustainability Maturity
- 6.5 Strategic Developments in Plasma Protease C1 Inhibitor (Last 24 Months)
- 6.5.1 Mergers, Acquisitions & Divestments
- 6.5.2 New Plasma Protease C1 Inhibitor Launches
- 6.5.3 Facility Expansions
- 6.5.4 Strategic Alliances, Joint Ventures & Partnerships
- 6.5.5 Distribution Expansion & Market Entry
- 6.5.6 Sustainability & ESG Initiatives
- 6.6 Competitive Strategy Mapping
- 6.6.1 Leader, Challenger, Follower & Niche Classification
- 6.6.2 Pricing Strategy Comparison
- 6.6.3 Channel Strategy Matrix
Note: Strategic developments are included based on their materiality and the availability of reliable information.
Chapter 7. Global Plasma Protease C1 Inhibitor Market – By Distribution Channel
- 7.1 Segment Overview
- 7.1.1 Volume & Revenue Split by Channel (2024 & 2032)
- 7.1.2 Channel Mix Evolution (2024-2032)
Chapter 8. Regional Market Analysis – Global Overview
- 8.1 Global Regional Overview
- 8.1.1 Regional Volume Share
- 8.1.2 Regional Revenue Share
- 8.1.3 Regional Volume by Region
- 8.1.4 Regional Revenue by Region
- 8.1.5 Regional Forecast Through 2032
- 8.2 Cross-Regional Segment Analysis
- 8.2.1 By Distribution Channel
- 8.2.2 By Brand/Price Tier
Chapter 9. North America Plasma Protease C1 Inhibitor Market
- 9.1 United States
- 9.2 Canada
- 9.3 Mexico
Chapter 10. Europe Plasma Protease C1 Inhibitor Market
- 10.1 Germany
- 10.2 France
- 10.3 Italy
- 10.4 United Kingdom
- 10.5 Spain
- 10.6 Poland
- 10.7 Russia
- 10.8 Netherlands
- 10.9 Belgium
- 10.10 Sweden
- 10.11 Denmark
- 10.12 Norway
- 10.13 Rest of Europe
Chapter 11. Asia Pacific Plasma Protease C1 Inhibitor Market
- 11.1 China
- 11.2 India
- 11.3 Japan
- 11.4 South Korea
- 11.5 Thailand
- 11.6 Indonesia
- 11.7 Vietnam
- 11.8 Malaysia
- 11.9 Australia
- 11.10 Rest of Asia Pacific
Chapter 12. Latin America Plasma Protease C1 Inhibitor Market
- 12.1 Brazil
- 12.2 Argentina
- 12.3 Colombia
- 12.4 Chile
- 12.5 Rest of Latin America
Chapter 13. Middle East Plasma Protease C1 Inhibitor Market
- 13.1 Saudi Arabia
- 13.2 United Arab Emirates
- 13.3 Turkey
- 13.4 Israel
- 13.5 Iran
- 13.6 Rest of the Middle East
Chapter 14. Africa Plasma Protease C1 Inhibitor Market
- 14.1 South Africa
- 14.2 Egypt
- 14.3 Nigeria
- 14.4 Morocco
- 14.5 Rest of Africa
Chapter 15. Plasma Protease C1 Inhibitor Company Profiles
- 15.1 [Company 01]
- 15.1.1 Company Overview
- 15.1.2 Key Management Personnel
- 15.1.3 Products & Services Portfolio
- 15.1.4 Financial Performance
- 15.1.5 Key Market Focus & Geographic Presence
- 15.1.6 Recent Developments & Strategic Initiatives
Note: The company profile list is preliminary and may change based on research findings, market developments, data availability, and client requirements.
Chapter 16. Appendices
- Appendix A – List of Abbreviations & Acronyms
- Appendix B – Industry Classification Code Reference – Full Series
- Appendix C – Production & Capacity Data Tables
- Appendix D – End-Use & Demand Base Tables
- Appendix E – Consumption & Replacement Rate Assumptions
- Appendix F – ASP Reference Tables
- Appendix G – Manufacturing & Facility Database
- Appendix H – Import-Export Data Tables
- Appendix I – Regulatory Summary Tables
- Appendix J – Primary Research Participant List (Anonymized)
- Appendix K – Primary Research Questionnaire Framework
- Appendix L – Data Sources & Bibliography
- Appendix M – Market Size Divergence & Source Comparison
Chapter 17. Research Methodology
- 17.1 Research Framework & Philosophy
- 17.2 Secondary Research – Sources, Hierarchy & Data Extraction
- 17.3 Data Modeling – Bottom-Up & Top-Down Market Sizing
- 17.4 Primary Research – Stakeholder Framework, LOI & Sample Sizes
- 17.5 Forecast Methodology – Regression, Scenario & Sensitivity Analysis
- 17.6 Quality Control – Four-Layer Validation Framework
- 17.7 Limitations & Standard Assumptions
- 17.8 Disclaimer
