
Market Overview
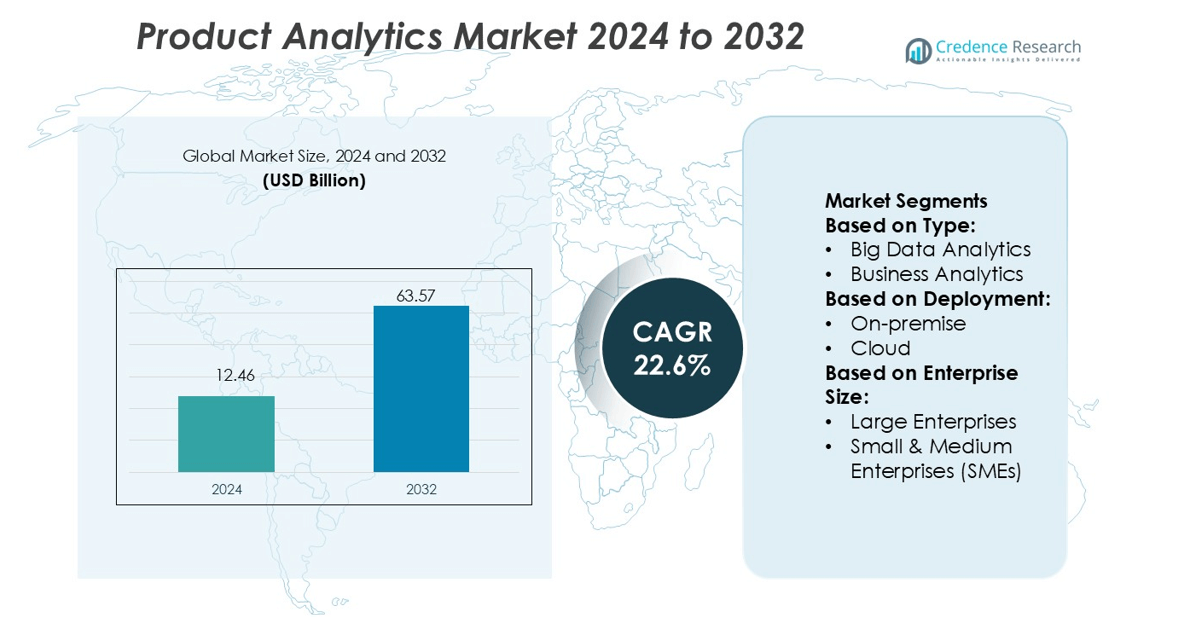
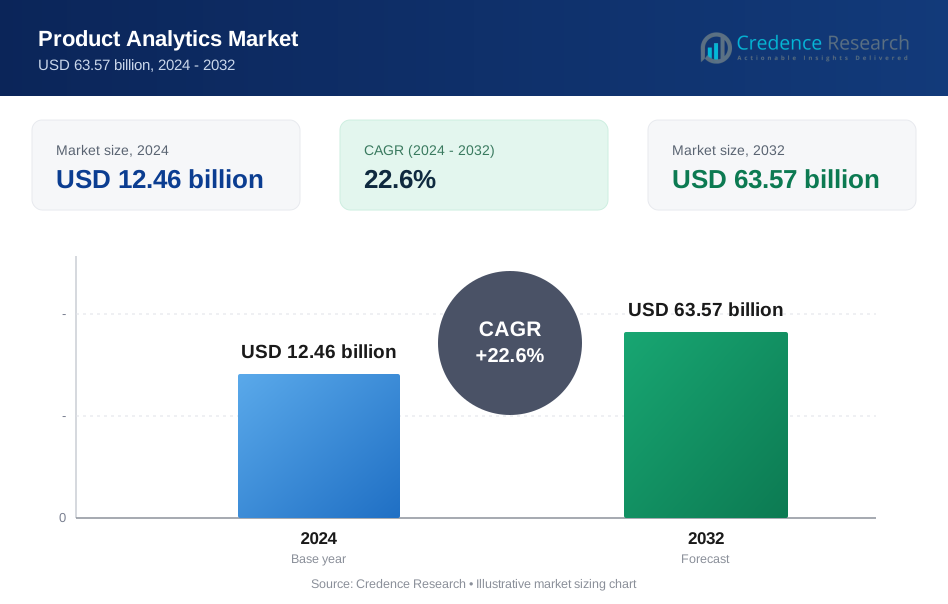
Product Analytics Market size was valued USD 12.46 billion in 2024 and is anticipated to reach USD 63.57 billion by 2032, at a CAGR of 22.6% during the forecast period.
| REPORT ATTRIBUTE | DETAILS |
|---|---|
| Historical Period | 2020-2023 |
| Base Year | 2024 |
| Forecast Period | 2025-2032 |
| Product Analytics Market Size 2024 | USD 12.46 billion |
| Product Analytics Market, CAGR | 22.6% |
| Product Analytics Market Size 2032 | USD 63.57 billion |
The Product Analytics Market includes strong competition from leading technology vendors such as Google LLC, Adobe Inc., Salesforce, Inc., Oracle, International Business Machines Corporation, Mixpanel, Medallia Inc., Accenture, LatentView Analytics, and Veritone, Inc. These companies compete through cloud-based platforms, AI-driven insights, automated reporting, and real-time behavioral tracking across web and mobile applications. Demand rises from SaaS providers, e-commerce platforms, telecom operators, and digital service companies seeking data-backed product decisions and higher user engagement. North America remains the leading region with 35% market share, supported by high enterprise digitalization, rapid cloud adoption, and strong investment in predictive analytics and customer experience optimization.
Market Insights
- The Product Analytics Market reached USD 12.46 billion in 2024 and will hit USD 63.57 billion by 2032 at a CAGR of 22.6%.
- Key growth comes from SaaS providers, e-commerce platforms, and telecom operators using analytics to improve user engagement, retention, and product decisions.
- North America holds the largest regional position with 35% share, driven by fast cloud adoption and predictive analytics investment, while Asia-Pacific gains momentum from digital payments, e-learning, and mobile commerce expansion.
- Cloud deployment remains the dominant segment as companies shift from on-premise systems to subscription-based analytics for real-time dashboards, automated reporting, and lower setup costs.
- Competition stays strong among Google, Adobe, Salesforce, IBM, Mixpanel, Medallia, Accenture, and Veritone, while restraints come from data privacy rules, integration challenges with legacy systems, and shortage of skilled analytics professionals.
Market Segmentation Analysis:
By Type
Big Data Analytics leads the product analytics market with the highest share due to rapid data creation from mobile apps, connected devices, and digital platforms. Companies use advanced algorithms and real-time processing to understand customer interactions, feature performance, and product engagement. The adoption of AI-driven dashboards, predictive tools, and automated insights strengthens decision-making in product development. Business Analytics follows, fueled by needs in KPI tracking, conversion analysis, and workflow optimization. Customer Analytics supports churn prediction and user segmentation, while Risk Analytics and Statistical Analysis assist in fraud detection and quality control across digital products.
- For instance, Veritone, Inc. uses its aiWARE platform to process vast amounts of data, overseeing 11.38 petabytes of information and processing 64.5 million cognitive media hours for clients annually across media and public safety applications, enabling rapid multi-format data analysis.
By Deployment
Cloud-based deployment holds the dominant share as enterprises prefer scalable infrastructure, lower upfront cost, and faster implementation. Real-time data processing, user behavior tracking, and multi-device analytics become simpler with cloud platforms. Vendors integrate machine learning pipelines, data visualization, and A/B testing modules through cloud subscriptions. On-premise solutions remain relevant for companies in regulated industries, especially those requiring data residency or strict control over proprietary datasets. However, regular feature upgrades, managed security, and easy API integrations push most companies toward cloud-based analytics platforms.
- For instance, Mixpanel’s cloud analytics platform processes approximately 7 trillion data points each year and aims to deliver query responses in under 1 second using its custom-built, high-performance columnar data engine designed for real-time analysis of event data.
By Enterprise Size
Large enterprises account for the largest market share as they manage high user volumes, complex product portfolios, and global operations. These businesses invest in AI-based analytics, customer journey mapping, anomaly detection, and heatmap analysis to improve product performance. Many deploy enterprise-wide analytics suites that combine UX data, marketing funnels, and financial metrics. SMEs show rising adoption due to affordable SaaS tools, lightweight integration, and no-code dashboards. Growing digital commerce and mobile-first business models encourage SMEs to adopt product analytics for user retention and faster product improvements.
Key Growth Drivers
Rising Digital Product Usage
Growth in mobile apps, SaaS platforms, and connected devices drives the demand for product analytics. Companies monitor user journeys, feature adoption, churn rates, and conversion paths to improve product performance. Real-time dashboards, behavioral tracking, and funnel analytics support faster decision-making and product iteration. Businesses rely on analytics to enhance user experience, reduce drop-offs, and increase customer retention across digital channels. As digital transactions expand, more organizations integrate product analytics into core development and marketing workflows.
- For instance, Oracle’s latest version of Oracle Enterprise Manager 13c Release 5 introduces hybrid-cloud management for on-prem and OCI resources, including self-service provisioning for VM, Bare Metal, Exadata Cloud Service and Exadata Cloud@Customer environments.
Increased Focus on Data-Driven Product Decisions
Enterprises invest in product analytics to replace guesswork with evidence-based insights. Teams analyze clickstream data, A/B tests, heatmaps, and customer segments to validate features before scaling. Predictive analytics helps forecast user demand and optimize roadmaps. By aligning product design with user behavior, companies reduce failed launches and improve feature success rates. Growing adoption of AI and machine learning strengthens this trend by offering automatic insights, anomaly detection, and future outcome prediction.
- For instance, Google Cloud include over 350 new data-and-AI features delivered in 2023. These innovations enable the integration of its BigQuery platform with Vertex AI and Gemini models for enterprise analytics.
Demand for Better Customer Engagement and Retention
Product analytics enables companies to understand why users abandon an app, stop using a feature, or churn. Businesses track customer lifetime value, session patterns, and satisfaction indicators to refine engagement strategies. Personalization engines built on analytics deliver targeted offers, in-app recommendations, and tailored communication. This boosts customer loyalty and recurring revenue models. Subscription-based businesses, gaming platforms, and digital marketplaces increasingly depend on analytics to improve retention and reduce customer acquisition cost.
Key Trends & Opportunities
AI-Driven and Predictive Analytics Adoption
Vendors integrate machine learning and automation to provide deeper user insights. Predictive models forecast churn, product demand, and user behavior. Auto-generated recommendations and anomaly detection reduce manual analysis and speed up decision cycles. Companies gain opportunities to personalize product experiences at scale and deliver smarter feature updates. The trend supports faster testing and optimization for digital-first businesses.
- For instance, Salesforce’s Agentforce platform now supports over 200 pre-built autonomous AI agents that handle workflows from research to appointment scheduling.
Growing Use of Self-Service Analytics Tools
Product teams demand simpler tools that allow non-technical users to run queries and create dashboards without coding. Self-service analytics platforms enable designers, marketers, and product managers to access real-time data independently. This reduces reliance on IT departments and speeds up experimentation. No-code and low-code solutions create opportunities for wider adoption across small and medium businesses.
- For instance, Adobe reports that its Express app recorded a 96% quarter-over-quarter growth in monthly active mobile users and an 86% year-over-year increase in cumulative creations, signalling strong uptake of self-service creation and analytics tools.
Key Challenges
Data Integration and Quality Issues
Companies collect data from apps, web, CRM, and third-party tools. Inconsistent formats and disconnected systems make it difficult to build a single source of truth. Poor data quality leads to inaccurate insights and weak decisions. Integrating legacy infrastructure with new analytics platforms adds complexity and cost. Organizations must strengthen governance, cleaning, and unified data pipelines to overcome this challenge.
Privacy and Compliance Restrictions
Rising concerns around data protection impact the market. Companies must follow strict rules like GDPR, CCPA, and industry-specific compliance standards. Restrictions on tracking cookies, location data, and third-party sharing limit analytics scope. Businesses need clear consent policies, secure data storage, and strong encryption. High compliance cost and risk of penalties make privacy a major operational challenge for analytics vendors and users.
Regional Analysis
North America
North America leads the Product Analytics Market with 35% market share, driven by strong digital adoption across enterprises. Tech companies, e-commerce platforms, and SaaS providers use advanced analytics to monitor customer behavior, product usage, and churn risk. The U.S. dominates the region due to high cloud deployment and spending on real-time data intelligence. Growing investment in AI-powered analytics, self-service dashboards, and customer lifecycle optimization boosts demand. Vendors integrate predictive models to enhance product engagement and reduce downtime. Expanding subscription-based businesses and mobile app usage continue to strengthen North America’s leadership position in the global market.
Europe
Europe holds 28% market share, supported by a large base of regulated industries such as banking, telecom, and retail. Companies adopt analytics to improve digital product performance, personalization, and compliance tracking. Germany, the U.K., and France remain major contributors due to strong enterprise digital transformation programs. Data privacy laws like GDPR push investments in secure and compliant analytics platforms. Cloud migration, IoT adoption, and omnichannel experiences fuel steady product analytics deployments. European vendors focus on user journey mapping, churn prediction, and deeper anomaly detection. Partnerships with software providers and analytics startups further enhance market growth.
Asia-Pacific
Asia-Pacific secures 25% market share and stands as the fastest-growing regional market. Rising smartphone penetration, booming e-commerce, and rapid digital payments adoption encourage companies to track customer activity at scale. China, India, Japan, and South Korea lead deployments across financial services, retail, gaming, and OTT platforms. Local enterprises invest in cloud-based analytics to improve app performance, retention rates, and personalization. Government-backed digital initiatives and startup expansion strengthen adoption. Vendors enhance multilingual dashboards and localized analytics models to support diverse users. Growing mobile-first business models push demand for real-time user insights, boosting regional momentum.
Latin America
Latin America accounts for 7% market share, driven by growing cloud adoption and mobile-centric consumer markets. Brazil and Mexico lead investments in analytics for fintech, retail, and telecom. Businesses use product analytics to reduce churn, enhance app usability, and support omnichannel strategies. Digital banking and online shopping growth create large volumes of behavioral data. Cost-effective cloud solutions support adoption among mid-sized enterprises. Vendors partner with local system integrators to expand services. Despite infrastructure gaps, rising smartphone usage and digital transformation plans support steady regional growth and wider analytics deployment.
Middle East & Africa
The Middle East & Africa hold 5% market share, supported by increasing digital investments in banking, government services, and telecommunications. Countries like the UAE and Saudi Arabia lead spending due to strong cloud strategies and smart city initiatives. Enterprises adopt product analytics to optimize digital portals, payment systems, and mobile applications. Financial services and e-commerce companies use analytics for fraud detection, personalization, and user journey monitoring. Limited technology budgets slow adoption in some African nations, yet rising mobile penetration and fintech growth open new opportunities. Regional demand continues to expand as digital infrastructure strengthens.
Market Segmentations:
By Type:
- Big Data Analytics
- Business Analytics
By Deployment:
- On-premise
- Cloud
By Enterprise Size:
- Large Enterprises
- Small & Medium Enterprises (SMEs)
By Geography
- North America
- U.S.
- Canada
- Mexico
- Europe
- Germany
- France
- U.K.
- Italy
- Spain
- Rest of Europe
- Asia Pacific
- China
- Japan
- India
- South Korea
- South-east Asia
- Rest of Asia Pacific
- Latin America
- Brazil
- Argentina
- Rest of Latin America
- Middle East & Africa
- GCC Countries
- South Africa
- Rest of the Middle East and Africa
Competitive Landscape
The competitive landscape in the Product Analytics Market players such as Veritone, Inc., Mixpanel, Accenture, Oracle, LatentView Analytics, Google LLC, Salesforce, Inc., International Business Machines Corporation, Adobe Inc., and Medallia Inc. The Product Analytics Market features strong rivalry among global and regional vendors offering cloud-based, AI-driven, and self-service analytics platforms. Companies compete on real-time user behavior tracking, automated reporting, data visualization, and personalization tools that support faster product decisions. Many vendors focus on product intelligence solutions that measure customer journeys, retention patterns, and churn risk across web and mobile applications. To gain advantage, players enhance machine learning capabilities, offer flexible APIs, and integrate seamlessly with CRM, CDP, and marketing automation systems. Pricing strategies, enterprise security, and data privacy compliance influence customer preference in regulated industries. Vendors also strengthen customer success programs to improve adoption and maximize lifetime value. Continuous investments in automation, predictive analytics, cross-platform tracking, and custom dashboards shape the market’s innovation cycle. As digital subscriptions, mobile-first services, and omnichannel platforms expand, competition increases across mid-size and large enterprises demanding deeper product insight.
Key Player Analysis
- Veritone, Inc.
- Mixpanel
- Accenture
- Oracle
- LatentView Analytics
- Google LLC
- Salesforce, Inc.
- International Business Machines Corporation
- Adobe Inc.
- Medallia Inc.
Recent Developments
- In June 2025, ThoughtSpot introduced a Snowflake-native edition of its Agentic Analytics Platform, weaving in Cortex AI and Snowpark integration for marketplace-based procurement.
- In March 2024, Oracle announced the launch of Oracle Analytics Server (OAS). This update brings more than a hundred new features that improve the analytics experience for every user in an organization. It offers new advancements that allow customers to derive more profound insights from their data and make decisions that lead to improved business results.
- In March 2024, Zoho Corp. officially launched its first two data centers in Saudi Arabia, located in Riyadh and Jeddah, marking a significant step in enhancing local data storage capabilities. This initiative aligns with the Kingdom's Personal Data Protection Laws and supports Zoho's commitment to data sovereignty.
- In February 2024, Medallia Inc., launched four new solutions to personalize customer and employee experiences. The solutions are Ask Athena, Intelligent Summaries, Smart Response, and Themes. These solutions will advance the ability of companies to spread insights broadly, engage employees, and customize experiences through affordable, ethical, and scalable AI and intelligent automation.
Report Coverage
The research report offers an in-depth analysis based on Type, Deployment, Enterprise Size and Geography. It details leading market players, providing an overview of their business, product offerings, investments, revenue streams, and key applications. Additionally, the report includes insights into the competitive environment, SWOT analysis, current market trends, as well as the primary drivers and constraints. Furthermore, it discusses various factors that have driven market expansion in recent years. The report also explores market dynamics, regulatory scenarios, and technological advancements that are shaping the industry. It assesses the impact of external factors and global economic changes on market growth. Lastly, it provides strategic recommendations for new entrants and established companies to navigate the complexities of the market.
Future Outlook
- The market will adopt deeper AI and machine learning models for automated product insights.
- Cloud-based analytics platforms will gain wider preference due to low setup cost and easier scaling.
- Companies will integrate product analytics with CRM, CDP, and marketing automation for unified customer intelligence.
- Self-service dashboards will expand to help non-technical teams access real-time insights.
- Mobile-first businesses will drive higher demand for in-app behavioral analytics and cohort tracking.
- Predictive analytics will support churn reduction, feature optimization, and customer lifetime value improvement.
- Data privacy compliance will influence product design, storage models, and access controls.
- Subscription-based business models will increase usage of retention, funnel, and revenue analytics.
- Businesses will adopt analytics tools for faster A/B testing, feature rollout, and usability improvement.
- Vendors will add more automation, anomaly detection, and cross-platform tracking to improve decision accuracy.
Request a Free Sample
Fill in your details and we'll send you a free sample report.
- Sample data tables & charts
- Research methodology
Need a Custom Version of This Report?
Tailor the scope, geography, or segments to your exact requirements.
- Custom geography or segment scope
- Direct access to our analyst team
Frequently Asked Questions
What is the current market size for Product Analytics Market, and what is its projected size in 2032?
At what Compound Annual Growth Rate is the Product Analytics Market projected to grow between 2025 and 2032?
Which Product Analytics Market segment held the largest share in 2024?
What are the primary factors fueling the growth of the Product Analytics Market?
Who are the leading companies in the Product Analytics Market?
Which region commanded the largest share of the Product Analytics Market in 2024?
Table of Content
Chapter 1. Report Introduction
- 1.1 Report Description & Purpose
- 1.1.1 Report Title & Market Definition
- 1.1.2 Unique Selling Propositions (USP) & Key Differentiators
- 1.1.3 Value Proposition for Stakeholders
- 1.2 Research Objectives
- 1.2.1 Market Sizing Objectives (Volume & Revenue) (Volume Where Applicable)
- 1.2.2 Segmentation Objectives
- 1.2.3 Competitive Intelligence Objectives
- 1.2.4 Forecast & Scenario Objectives
- 1.3 Report Scope
- 1.3.1 Product Analytics Scope – Segments & Subsegments Covered
- 1.3.2 Geographic Scope – Regions & Countries Covered
- 1.3.3 Historical Period, Base Year & Forecast Period (2024; forecast to 2032)
- 1.3.4 Inclusions & Exclusions
- 1.4 Industry Classification & Applicable Codes
- 1.5 Currency, Measurement Units & Valuation Basis
- 1.6 Target Stakeholders
- 1.7 Limitations & Assumptions
Chapter 2. Executive Summary
- 2.1 Global Product Analytics Market Snapshot
- 2.1.1 Market Size – Historical (2024) & Forecast (2024-2032) (2024: USD 12.46 billion → 2032: USD 63.57 billion)
- 2.1.2 Volume & Revenue – Global Totals (Volume Where Applicable)
- 2.1.3 Key Market Highlights – Top Five Facts
- 2.2 Product Analytics Market Segmentation Snapshot
- 2.2.1 Market Split by Region – 2024 vs. 2032
- 2.3 Competitive Snapshot
- 2.3.1 Top 10 Players by Revenue Share – 2024
- 2.3.2 Top 10 Players by Volume Share – 2024 (Volume Where Applicable)
- 2.3.3 Recent Strategic Developments (18-Month Summary)
- 2.4 Key Investment Highlights & Strategic Conclusions
Chapter 3. Product Analytics Market Dynamics & Industry Analysis
- 3.1 Market Overview & Context
- 3.1.1 Product Analytics Market Position in the Broader Industry Value Chain
- 3.1.2 Demand Structure & Purchasing Dynamics
- 3.1.3 Market Maturity & Development Stage by Region
- 3.2 Product Analytics Market Drivers
- 3.3 Product Analytics Market Restraints & Challenges
- 3.4 Product Analytics Market Opportunities
- 3.5 Porter's Five Forces Analysis
- 3.5.1 Threat of New Entrants
- 3.5.2 Bargaining Power of Suppliers
- 3.5.3 Bargaining Power of Buyers
- 3.5.4 Threat of Substitutes
- 3.5.5 Competitive Rivalry – Intensity Assessment
- 3.6 Product Analytics Value Chain Analysis
- 3.6.1 Upstream – Key Inputs, Resources & Suppliers
- 3.6.1.1 Key Input/Resource 1
- 3.6.1.2 Key Input/Resource 2
- 3.6.1.3 Key Input/Resource 3
- 3.6.2 Midstream – Core Operations & Value Creation
- 3.6.2.1 Operating Model & Process Overview
- 3.6.2.2 Key Operating Locations & Capabilities by Company
- 3.6.3 Downstream – Market Channels & End Users
- 3.6.3.1 Direct Sales & Customer Engagement Channels
- 3.6.3.2 Indirect Sales, Intermediaries & Partner Channels
- 3.6.4 Value Chain Profitability Analysis
- 3.6.1 Upstream – Key Inputs, Resources & Suppliers
- 3.7 PESTEL Analysis
- 3.7.1 Political Factors
- 3.7.2 Economic Factors
- 3.7.3 Social Factors
- 3.7.4 Technological Factors
- 3.7.5 Environmental Factors
- 3.7.6 Legal Factors
- 3.8 Product Analytics Supply Chain Analysis
- 3.8.1 Critical Input & Resource Availability Risk Assessment
- 3.8.2 Supplier & Operational Concentration Risk (Geographic Exposure)
- 3.8.3 Supply & Service Disruption Impact Analysis
- 3.9 Regulatory & Policy Landscape
Note: The regulatory and policy landscape section covers regulations based on their applicability to the market, Product Analytics category, geography, and scope of the study. Only regulatory frameworks with a material impact on operations, compliance, trade, sustainability, or market access are analyzed in detail.
Chapter 4. Key Investment Pockets & Opportunity Analysis
- 4.1 Product Analytics Market Attractiveness Analysis
- 4.1.1 By Region – Investment Attractiveness Matrix (Market Size × CAGR)
- 4.2 Absolute Revenue Growth Opportunity
- 4.2.1 By Region – Absolute Revenue Growth Through 2032
- 4.3 Incremental Demand Opportunity
- 4.3.1 By Region – Incremental Demand Through 2032
- 4.3.2 Segment – Incremental Demand
- 4.4 Emerging Submarket Opportunity Deep Dive (Subject to Applicability)
- 4.5 Priority Market Opportunity Scorecards
- 4.5.1 United States
- 4.5.2 Europe
- 4.5.3 Asia
- 4.5.4 Middle East & Africa
Note: Priority market opportunity scorecards reflect the geographic scope and strategic relevance of the study. Listed markets are indicative and may be adapted to the industry.
Chapter 5. Product Analytics Cross-Border Trade & Market Access Analysis
- 5.1 International Trade & Cross-Border Activity Overview
- 5.1.1 Global Export Value by Country (2024)
- 5.1.2 Global Export Volume by Country (2024) (Volume Where Applicable)
- 5.1.3 Global Import Value by Country (2024)
- 5.1.4 Global Import Volume by Country (2024) (Volume Where Applicable)
- 5.1.5 Net Trade Balance by Country (2024)
- 5.2 Export Analysis – Segment
- 5.2.1 Category 1 (Applicable Classification Code)
- 5.2.2 Category 2 (Applicable Classification Code)
- 5.2.3 Category 3 (Applicable Classification Code)
- 5.2.4 Category 4 (Applicable Classification Code)
- 5.2.5 Category 5 (Applicable Classification Code)
- 5.3 Import Analysis – Segment
- 5.3.1 Category 1 (Applicable Classification Code)
- 5.3.2 Category 2 (Applicable Classification Code)
- 5.3.3 Category 3 (Applicable Classification Code)
- 5.3.4 Category 4 (Applicable Classification Code)
- 5.3.5 Category 5 (Applicable Classification Code)
- 5.4 Cross-Border Pricing & Transaction Benchmarks
- 5.4.1 Export Pricing – Segment & Country
- 5.4.2 Import Pricing – Segment & Source Country
- 5.4.3 Price Trends (2024)
- 5.5 Key Cross-Border Trade & Delivery Routes
- 5.5.1 Cross-Border Trade/Delivery Route 1
- 5.5.2 Cross-Border Trade/Delivery Route 2
- 5.5.3 Cross-Border Trade/Delivery Route 3
- 5.5.4 Cross-Border Trade/Delivery Route 4
- 5.5.5 Cross-Border Trade/Delivery Route 5
- 5.6 Trade Policy & Market Access Impact Assessment
- 5.6.1 Tariff & Non-Tariff Barriers
- 5.6.2 Regional Trade & Economic Integration Frameworks
- 5.6.3 Bilateral & Multilateral Trade Agreements
- 5.6.4 Cross-Border Operating, Licensing & Localization Requirements
Note: This chapter applies where cross-border trade or delivery is relevant to Product Analytics. Goods, services, and digital offerings are assessed using applicable classifications and transaction measures. Import-export volumes, trade balances, and route analyses are included only where meaningful to the market.
Chapter 6. Competitive Landscape & Company Benchmarking
- 6.1 Product Analytics Market Concentration & Structure
- 6.1.1 Herfindahl-Hirschman Index (HHI) – the historical period vs. 2024
- 6.1.2 Leading, Mid-Sized & Emerging Player Structure
- 6.1.3 Global, Regional & Local Player Dynamics
- 6.2 Product Analytics Market Share Analysis – 2024
- 6.2.1 Global Revenue Share by Company
- 6.2.2 Global Volume Share by Company (Volume Where Applicable)
- 6.2.3 Regional Revenue Share
- 6.2.4 Market Share Evolution (the historical period vs. 2024)
- 6.2.5 Company Market Share by Key Segment
- 6.2.6 Company Market Share by Customer Group
- 6.3 Operating Scale, Capacity & Infrastructure Analysis
- 6.3.1 Global Operating Scale & Supply Capacity
- 6.3.2 Resource Utilization & Operating Efficiency
- 6.3.3 Output, Service Delivery & Activity Metrics
- 6.3.4 Operating Footprint & Infrastructure Map
- 6.3.5 Planned Operational & Capacity Expansion
- 6.4 Product Analytics Competitive Benchmarking Matrix
- 6.4.1 Revenue, Growth, Profitability & Operating Metric Comparison
- 6.4.2 Channel Revenue Mix
- 6.4.3 Geographic Revenue Exposure
- 6.4.4 R&D Intensity
- 6.4.5 Sustainability Maturity
- 6.5 Strategic Developments in Product Analytics (Last 24 Months)
- 6.5.1 Mergers, Acquisitions & Divestments
- 6.5.2 New Products, Services & Solutions in Product Analytics
- 6.5.3 Operational & Infrastructure Expansions
- 6.5.4 Strategic Alliances, Joint Ventures & Partnerships
- 6.5.5 Distribution Expansion & Market Entry
- 6.5.6 Sustainability & ESG Initiatives
- 6.6 Competitive Strategy Mapping
- 6.6.1 Leader, Challenger, Follower & Niche Classification
- 6.6.2 Pricing Strategy Comparison
- 6.6.3 Channel Strategy Matrix
Note: Strategic developments are included based on their materiality and the availability of reliable information.
Chapter 7. Global Product Analytics Market – By Sales & Delivery Channel
- 7.1 Segment Overview
- 7.1.1 Volume & Revenue Split by Channel (2024 & 2032) (Volume Where Applicable)
- 7.1.2 Channel Mix Evolution (2024-2032)
Chapter 8. Regional Market Analysis – Global Overview
- 8.1 Global Regional Overview
- 8.1.1 Regional Volume Share (Volume Where Applicable)
- 8.1.2 Regional Revenue Share
- 8.1.3 Regional Volume by Region (Volume Where Applicable)
- 8.1.4 Regional Revenue by Region
- 8.1.5 Regional Forecast Through 2032
- 8.2 Cross-Regional Segment Analysis
- 8.2.1 By Sales & Delivery Channel
- 8.2.2 By Competitive Positioning & Price Tier
Chapter 9. North America Product Analytics Market
- 9.1 United States
- 9.2 Canada
- 9.3 Mexico
Chapter 10. Europe Product Analytics Market
- 10.1 Germany
- 10.2 France
- 10.3 Italy
- 10.4 United Kingdom
- 10.5 Spain
- 10.6 Poland
- 10.7 Russia
- 10.8 Netherlands
- 10.9 Belgium
- 10.10 Sweden
- 10.11 Denmark
- 10.12 Norway
- 10.13 Rest of Europe
Chapter 11. Asia Pacific Product Analytics Market
- 11.1 China
- 11.2 India
- 11.3 Japan
- 11.4 South Korea
- 11.5 Thailand
- 11.6 Indonesia
- 11.7 Vietnam
- 11.8 Malaysia
- 11.9 Australia
- 11.10 Rest of Asia Pacific
Chapter 12. Latin America Product Analytics Market
- 12.1 Brazil
- 12.2 Argentina
- 12.3 Colombia
- 12.4 Chile
- 12.5 Rest of Latin America
Chapter 13. Middle East Product Analytics Market
- 13.1 Saudi Arabia
- 13.2 United Arab Emirates
- 13.3 Turkey
- 13.4 Israel
- 13.5 Iran
- 13.6 Rest of the Middle East
Chapter 14. Africa Product Analytics Market
- 14.1 South Africa
- 14.2 Egypt
- 14.3 Nigeria
- 14.4 Morocco
- 14.5 Rest of Africa
Chapter 15. Product Analytics Company Profiles
- 15.1 [Company 01]
- 15.1.1 Company Overview
- 15.1.2 Key Management Personnel
- 15.1.3 Products & Services Portfolio
- 15.1.4 Financial Performance
- 15.1.5 Key Market Focus & Geographic Presence
- 15.1.6 Recent Developments & Strategic Initiatives
Note: The company profile list is preliminary and may change based on research findings, market developments, data availability, and client requirements.
Chapter 16. Appendices
- Appendix A – List of Abbreviations & Acronyms
- Appendix B – Industry Classification Code Reference – Full Series
- Appendix C – Supply, Output & Operating Capacity Data Tables
- Appendix D – End-Use & Demand Base Tables
- Appendix E – Demand, Adoption & Usage Assumptions
- Appendix F – Pricing & Revenue Metric Reference Tables
- Appendix G – Company Operations & Infrastructure Database
- Appendix H – Cross-Border Trade & Activity Data Tables (Where Applicable)
- Appendix I – Regulatory Summary Tables
- Appendix J – Primary Research Participant List (Anonymized)
- Appendix K – Primary Research Questionnaire Framework
- Appendix L – Data Sources & Bibliography
- Appendix M – Market Size Divergence & Source Comparison
Chapter 17. Research Methodology
- 17.1 Research Framework & Philosophy
- 17.2 Secondary Research – Sources, Hierarchy & Data Extraction
- 17.3 Data Modeling – Bottom-Up & Top-Down Market Sizing
- 17.4 Primary Research – Stakeholder Framework, LOI & Sample Sizes
- 17.5 Forecast Methodology – Regression, Scenario & Sensitivity Analysis
- 17.6 Quality Control – Four-Layer Validation Framework
- 17.7 Limitations & Standard Assumptions
- 17.8 Disclaimer
