
Catalog Management System Market Overview:
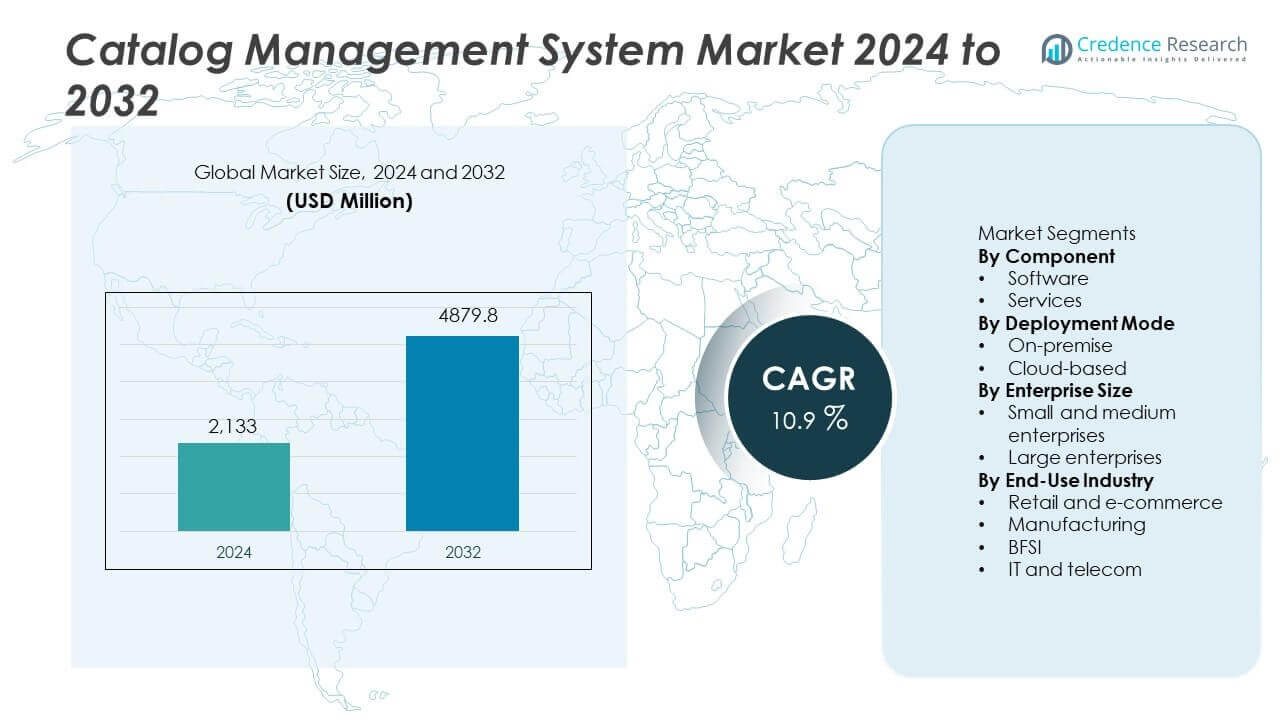
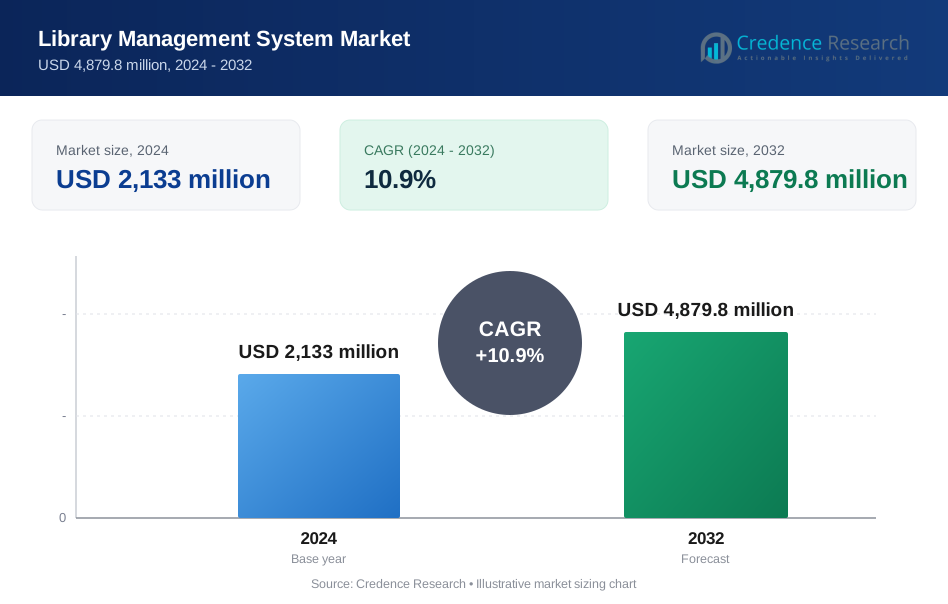
The Catalog Management System market was valued at USD 2,133 million in 2024 and is anticipated to reach USD 4,879.8 million by 2032, registering a CAGR of 10.9% during the forecast period.
| REPORT ATTRIBUTE | DETAILS |
|---|---|
| Historical Period | 2020-2023 |
| Base Year | 2024 |
| Forecast Period | 2025-2032 |
| Catalog Management System Market Size 2024 | USD 2,133 million |
| Catalog Management System Market, CAGR | 10.9% |
| Catalog Management System Market Size 2032 | USD 4,879.8 million |
Catalog Management System Market Insights
- Market growth is driven by rising omnichannel retail and digital commerce adoption, with software components leading the market at a 63% share due to demand for centralized product data and automation.
- Key trends include rapid adoption of cloud-based deployment, which holds a 68% share, supported by scalability, subscription pricing, and easier integration with e-commerce platforms.
- Competitive intensity remains high as enterprise vendors and PIM specialists focus on AI-driven enrichment, data accuracy, and seamless ERP integration, while integration complexity and data security concerns act as restraints.
- North America leads the market with a 34% share, followed by Asia Pacific at 29% and Europe at 27%, driven by strong e-commerce ecosystems, SME digitalization, and regulatory-driven data consistency needs.
Catalog Management System Market Segmentation Analysis:
By Component
The component segment is led by software solutions, holding a market share of 63%. Organizations prioritize software platforms to centralize product data, pricing, and attributes across channels. Catalog management software improves data accuracy, reduces manual errors, and supports faster product updates. Growing omnichannel retail and digital commerce adoption strongly support software demand. Advanced features such as automation, AI-based enrichment, and integration with ERP systems further drive adoption. Services follow, driven by implementation and support needs. However, recurring software licenses and scalability benefits position software as the dominant component segment.
- For instance, SAP Product Master supports managing more than 10 million product records in a single instance. The platform enables rule-based validation that removes duplicate entries during ingestion.
By Deployment Mode
The deployment mode segment is dominated by cloud-based solutions, accounting for 68% market share. Enterprises prefer cloud deployment for scalability, lower infrastructure costs, and real-time accessibility. Cloud platforms support rapid updates and seamless integration with e-commerce systems. Subscription pricing models attract cost-sensitive users and growing businesses. Cloud deployment also enables remote collaboration and faster catalog updates. On-premise solutions retain relevance for data-sensitive environments but show slower growth. Rising digital transformation initiatives continue to strengthen cloud-based deployment leadership.
- For instance, Salesforce Commerce Cloud leverages a multi-site architecture to support concurrent catalog management across global regions. The platform utilizes non-disruptive update processes to ensure storefronts remain operational and available to shoppers while catalog changes are synchronized.
By Enterprise Size
Large enterprises lead the enterprise size segment with a market share of 57%. These organizations manage complex product portfolios across multiple channels and regions. Catalog management systems help large firms maintain data consistency and operational efficiency. Integration with supply chain and marketing systems supports enterprise-scale operations. SMEs follow, driven by growing online presence and platform affordability. However, higher transaction volumes and customization needs position large enterprises as the dominant user group. Expansion of global retail and manufacturing firms supports continued dominance.
Key Growth Drivers
Rising Omnichannel Retail and E-commerce Adoption
Omnichannel retail expansion drives strong demand for catalog management systems. Businesses must manage product data across websites, marketplaces, and physical stores. Catalog platforms ensure data consistency, faster updates, and accurate pricing. Retailers rely on centralized catalogs to reduce errors and improve customer experience. Growth in online shopping increases product complexity and SKU volumes. Catalog systems support rapid onboarding and content enrichment. Integration with e-commerce platforms improves operational speed. Omnichannel strategies continue to push sustained market growth.
- For instance, Adobe Commerce supports managing more than 50 million SKUs within a single product catalog. The platform enables real-time synchronization across web, mobile, and in-store channels.
Increasing Need for Product Data Accuracy and Compliance
Organizations face rising pressure to maintain accurate product information. Incorrect data leads to customer dissatisfaction and revenue loss. Catalog management systems automate validation and standardization processes. Industries such as retail and manufacturing require compliance with labeling and data rules. Centralized catalogs reduce manual errors and duplication. Improved data governance strengthens brand trust. As product assortments expand, accuracy needs intensify. This requirement strongly supports system adoption.
- For instance, Informatica Product 360 applies a comprehensive set of data quality rules to product records. The platform performs automated validation during ingestion and utilizes match-and-merge capabilities to reduce duplicate entries at scale.
Digital Transformation Across Enterprises
Enterprises invest heavily in digital transformation initiatives. Catalog management systems support automation and workflow efficiency. Integration with ERP, CRM, and supply chain systems improves coordination. Businesses seek scalable platforms to manage growing digital catalogs. Cloud-based tools enable faster deployment and updates. Digital-first strategies increase reliance on structured product data. Transformation programs across sectors continue to drive demand growth.
Key Trends & Opportunities
Adoption of AI and Automation in Catalog Management
AI-driven tools enhance product categorization and data enrichment. Automation reduces manual data entry and processing time. Intelligent recommendations improve search and discovery. AI helps identify data gaps and inconsistencies. These features increase catalog quality and usability. Vendors offering AI capabilities gain differentiation. Automation also lowers operational costs. This trend creates strong innovation and revenue opportunities.
- For instance, Akeneo uses AI-based classification to process more than 1 million product attributes per hour. The system applies machine-learning models to auto-assign categories across 100+ taxonomies.
Growth of Cloud-Based Subscription Models
Cloud deployment gains traction due to flexibility and cost efficiency. Subscription pricing lowers entry barriers for SMEs. Cloud platforms support real-time collaboration and scalability. Frequent updates improve system performance and security. Businesses prefer reduced infrastructure management. Vendors expand SaaS offerings to capture wider demand. Cloud adoption continues to open new growth avenues.
- For instance, Salsify processes a vast volume of product data through its cloud platform and facilitates real-time syndication to numerous retailer and marketplace endpoints.
Key Challenges
Complex Integration with Legacy Systems
Many enterprises operate legacy IT infrastructures. Integrating catalog systems with existing platforms poses challenges. Customization increases deployment time and cost. Data migration risks disrupt operations. Technical complexity slows adoption in traditional industries. Skilled integration support becomes essential. Integration barriers remain a key market constraint.
Data Security and Privacy Concerns
Catalog systems store sensitive product and pricing data. Cybersecurity threats raise data protection concerns. Cloud deployments increase exposure risks if controls are weak. Regulatory requirements add compliance pressure. Enterprises demand strong encryption and access control. Security investments increase overall costs. Privacy concerns continue to challenge broader adoption.
Regional Analysis
North America
North America holds a market share of 34% in the Catalog Management System market. Strong adoption stems from mature e-commerce ecosystems and advanced IT infrastructure. Large retailers and manufacturers rely on centralized catalogs to manage complex SKUs and omnichannel operations. Cloud-first strategies and SaaS adoption accelerate deployment across enterprises. Integration with ERP and CRM systems remains a key requirement. The United States leads demand due to digital transformation spending and data governance focus. Ongoing investments in AI-driven enrichment further support regional leadership.
Europe
Europe accounts for a market share of 27% in the Catalog Management System market. Demand is driven by strict data accuracy and compliance requirements across retail and manufacturing. Enterprises prioritize consistent product information across cross-border channels. Germany, the United Kingdom, and France contribute strongly due to large retail networks and industrial bases. Cloud adoption grows steadily, supported by data residency compliance. Multilingual catalog needs increase platform complexity. Focus on customer experience and regulatory alignment sustains stable regional growth.
Asia Pacific
Asia Pacific commands a market share of 29% in the Catalog Management System market. Rapid e-commerce expansion and digital-first consumers drive adoption. China, India, Japan, and Southeast Asia fuel demand through rising online marketplaces. SMEs adopt cloud-based systems to scale quickly and manage expanding catalogs. High SKU growth and mobile commerce increase the need for automation. Investments in retail tech and manufacturing digitization strengthen uptake. The region shows strong momentum supported by platform localization and affordability.
Rest of the World
The Rest of the World holds a market share of 10% in the Catalog Management System market. Latin America and the Middle East lead adoption due to growing e-commerce penetration. Retail modernization and marketplace growth drive initial demand. Cloud deployment supports cost-efficient implementation. Africa shows early-stage adoption tied to digital retail growth. Integration needs and budget constraints temper expansion. Gradual improvements in infrastructure and digital skills support steady, long-term growth potential.
Catalog Management System Market Segmentations:
By Component
- Software
- Services
By Deployment Mode
- On-premise
- Cloud-based
By Enterprise Size
- Small and medium enterprises
- Large enterprises
By End-Use Industry
- Retail and e-commerce
- Manufacturing
- BFSI
- IT and telecom
By Geography
- North America
- U.S.
- Canada
- Mexico
- Europe
- Germany
- France
- U.K.
- Italy
- Spain
- Rest of Europe
- Asia Pacific
- China
- Japan
- India
- South Korea
- South-east Asia
- Rest of Asia Pacific
- Latin America
- Brazil
- Argentina
- Rest of Latin America
- Middle East & Africa
- GCC Countries
- South Africa
- Rest of the Middle East and Africa
Competitive Landscape
Competitive landscape analysis highlights key players including SAP, IBM, Oracle, Adobe, Salesforce, Informatica, Salsify, Akeneo, Stibo Systems, and Pimcore. The Catalog Management System market remains highly competitive, with vendors focusing on scalability, integration depth, and data accuracy. Enterprise software providers leverage strong ERP and CRM ecosystems to retain large clients. Specialized PIM vendors compete through faster deployment and flexible cloud models. AI-driven data enrichment and automation strengthen product differentiation. Omnichannel support remains a core buying criterion for retailers and manufacturers. Vendors also invest in API-based integrations to improve interoperability. Subscription pricing and modular offerings attract mid-sized enterprises. Continuous feature upgrades and customer experience improvements shape competitive positioning across regions.
Key Player Analysis
Recent Developments
- In November 2025, SAP continued its monthly (rather than regular quarterly) update cycle for SAP Commerce Cloud, specifically under the version 2211 "continuous innovation" model.
- In October 2025, IBM released IBM Software Hub 5.2.2. While this update included new operand versions for several services (such as watsonx.data intelligence version 2.2.2), IBM Product Master was subsequently updated to operand version 9.0.0 as part of the IBM Software Hub 5.3.0 release cycle.
Report Coverage
The research report offers an in-depth analysis based on Component, Deployment Mode, Enterprise Size, End-Use Industry and Geography. It details leading market players, providing an overview of their business, product offerings, investments, revenue streams, and key applications. Additionally, the report includes insights into the competitive environment, SWOT analysis, current market trends, as well as the primary drivers and constraints. Furthermore, it discusses various factors that have driven market expansion in recent years. The report also explores market dynamics, regulatory scenarios, and technological advancements that are shaping the industry. It assesses the impact of external factors and global economic changes on market growth. Lastly, it provides strategic recommendations for new entrants and established companies to navigate the complexities of the market.
Future Outlook
- Omnichannel retail growth will continue to drive catalog management system adoption.
- Cloud-based platforms will gain wider acceptance across enterprise sizes.
- AI-driven automation will improve product data quality and enrichment.
- Integration with ERP, CRM, and e-commerce systems will deepen.
- SMEs will increase adoption due to subscription pricing and scalability.
- Demand for real-time catalog updates will rise across channels.
- Data governance and compliance requirements will shape platform features.
- Vendors will focus on modular and API-driven architectures.
- Customer experience optimization will remain a key buying factor.
- Market competition will intensify as digital commerce expands globally.
Request a Free Sample
Fill in your details and we'll send you a free sample report.
- Sample data tables & charts
- Research methodology
Need a Custom Version of This Report?
Tailor the scope, geography, or segments to your exact requirements.
- Custom geography or segment scope
- Direct access to our analyst team
Frequently Asked Questions
What is the current market size for Catalog Management System market, and what is its projected size in 2032?
At what Compound Annual Growth Rate is the Catalog Management System market projected to grow between 2024 and 2032?
Which Catalog Management System market segment held the largest share in 2024?
What are the primary factors fueling the growth of the Catalog Management System market?
Who are the leading companies in the Catalog Management System market?
Which region commanded the largest share of the Catalog Management System market in 2024?
Table of Content
Chapter 1. Report Introduction
- 1.1 Report Description & Purpose
- 1.1.1 Report Title & Market Definition
- 1.1.2 Unique Selling Propositions (USP) & Key Differentiators
- 1.1.3 Value Proposition for Stakeholders
- 1.2 Research Objectives
- 1.2.1 Market Sizing Objectives (Volume & Revenue)
- 1.2.2 Segmentation Objectives
- 1.2.3 Competitive Intelligence Objectives
- 1.2.4 Forecast & Scenario Objectives
- 1.3 Report Scope
- 1.3.1 Library Management System Scope – Types & Subtypes Covered
- 1.3.2 Geographic Scope – Regions & Countries Covered
- 1.3.3 Historical Period, Base Year & Forecast Period (2024; forecast to 2032)
- 1.3.4 Inclusions & Exclusions
- 1.4 HS Code & Classification Framework
- 1.5 Currency, Units & Pricing Basis
- 1.6 Target Stakeholders
- 1.7 Limitations & Assumptions
Chapter 2. Executive Summary
- 2.1 Global Library Management System Market Snapshot
- 2.1.1 Market Size – Historical (2024) & Forecast (2024-2032) (2024: USD 2,133 million → 2032: USD 4,879.8 million)
- 2.1.2 Volume & Revenue – Global Totals
- 2.1.3 Key Market Highlights – Top Five Facts
- 2.2 Library Management System Market Segmentation Snapshot
- 2.2.1 Market Split by Region – 2024 vs. 2032
- 2.3 Competitive Snapshot
- 2.3.1 Top 10 Players by Revenue Share – 2024
- 2.3.2 Top 10 Players by Volume Share – 2024
- 2.3.3 Recent Strategic Developments (18-Month Summary)
- 2.4 Key Investment Highlights & Strategic Conclusions
Chapter 3. Library Management System Market Dynamics & Industry Analysis
- 3.1 Market Overview & Context
- 3.1.1 Library Management System Market Position in the Broader Automotive Value Chain
- 3.1.2 OEM vs. Replacement Market Dynamics
- 3.1.3 Market Maturity & Development Stage by Region
- 3.2 Library Management System Market Drivers
- 3.3 Library Management System Market Restraints & Challenges
- 3.4 Library Management System Market Opportunities
- 3.5 Porter's Five Forces Analysis
- 3.5.1 Threat of New Entrants
- 3.5.2 Bargaining Power of Suppliers
- 3.5.3 Bargaining Power of Buyers
- 3.5.4 Threat of Substitutes
- 3.5.5 Competitive Rivalry – Intensity Assessment
- 3.6 Library Management System Value Chain Analysis
- 3.6.1 Upstream – Raw Material/Input Suppliers
- 3.6.1.1 Raw Material/Input 1
- 3.6.1.2 Raw Material/Input 2
- 3.6.1.3 Raw Material/Input 3
- 3.6.2 Midstream – Production/Manufacturing/Service Delivery
- 3.6.2.1 Production/Process Overview
- 3.6.2.2 Key Facility Locations & Capacity by Manufacturer
- 3.6.3 Downstream – Distribution & End Consumer
- 3.6.3.1 Primary Channel – B2B/OEM
- 3.6.3.2 Secondary Channels – Dealer, Retail, Online, Direct
- 3.6.4 Value Chain Profitability Analysis
- 3.6.1 Upstream – Raw Material/Input Suppliers
- 3.7 PESTEL Analysis
- 3.7.1 Political Factors
- 3.7.2 Economic Factors
- 3.7.3 Social Factors
- 3.7.4 Technological Factors
- 3.7.5 Environmental Factors
- 3.7.6 Legal Factors
- 3.8 Library Management System Supply Chain Analysis
- 3.8.1 Raw Material/Input Supply Risk Assessment
- 3.8.2 Manufacturing Concentration Risk (Geographic Exposure)
- 3.8.3 Trade Disruption Impact Analysis
- 3.9 Regulatory & Policy Landscape
Note: The regulatory and policy landscape section covers regulations based on their applicability to the market, Library Management System category, geography, and scope of the study. Only regulatory frameworks with a material impact on operations, compliance, trade, sustainability, or market access are analyzed in detail.
Chapter 4. Key Investment Pockets & Opportunity Analysis
- 4.1 Library Management System Market Attractiveness Analysis
- 4.1.1 By Region – Investment Attractiveness Matrix (Volume × CAGR)
- 4.2 Absolute Revenue Growth Opportunity
- 4.2.1 By Region – Absolute USD Growth Through 2032
- 4.3 Incremental Volume Opportunity
- 4.3.1 By Region – Incremental Volume Through 2032
- 4.3.2 Segment – Incremental Volume
- 4.4 Emerging Submarket Opportunity Deep Dive (Subject to Applicability)
- 4.5 Emerging Market Opportunity Scorecards
- 4.5.1 United States
- 4.5.2 Europe
- 4.5.3 Asia
- 4.5.4 Middle East & Africa
Note: Emerging Market Opportunity Scorecards will be included based on relevance and strategic importance. Regions listed are indicative and may vary depending on data availability and market dynamics.
Chapter 5. Library Management System Import-Export Analysis & Trade Flows
- 5.1 Global Trade Overview
- 5.1.1 Global Export Value by Country (2024)
- 5.1.2 Global Export Volume by Country (2024)
- 5.1.3 Global Import Value by Country (2024)
- 5.1.4 Global Import Volume by Country (2024)
- 5.1.5 Net Trade Balance by Country (2024)
- 5.2 Export Analysis – Segment
- 5.2.1 Type 1 (HS Code)
- 5.2.2 Type 2 (HS Code)
- 5.2.3 Type 3 (HS Code)
- 5.2.4 Type 4 (HS Code)
- 5.2.5 Type 5 (HS Code)
- 5.3 Import Analysis – Segment
- 5.3.1 Type 1 (HS Code)
- 5.3.2 Type 2 (HS Code)
- 5.3.3 Type 3 (HS Code)
- 5.3.4 Type 4 (HS Code)
- 5.3.5 Type 5 (HS Code)
- 5.4 Average Unit Trade Prices
- 5.4.1 Average Export Price – Segment & Country
- 5.4.2 Average Import Price – Segment & Source Country
- 5.4.3 Price Trends (2024)
- 5.5 Key Trade Route Analysis
- 5.5.1 Trade Route 1
- 5.5.2 Trade Route 2
- 5.5.3 Trade Route 3
- 5.5.4 Trade Route 4
- 5.5.5 Trade Route 5
- 5.6 Trade Policy Impact Assessment
- 5.6.1 US Anti-Dumping & Section 301 Tariffs
- 5.6.2 EU Customs Union Impact
- 5.6.3 Major Free Trade Agreements
- 5.6.4 USMCA Rules of Origin
Note: Trade policy analysis will be included only where relevant to the Library Management System market.
Chapter 6. Competitive Landscape & Company Benchmarking
- 6.1 Library Management System Market Concentration & Structure
- 6.1.1 Herfindahl-Hirschman Index (HHI) – vs. 2024
- 6.1.2 Tier 1, Tier 2 & Tier 3 Market Structure
- 6.1.3 Global, Regional & Local Player Dynamics
- 6.2 Library Management System Market Share Analysis – 2024
- 6.2.1 Global Revenue Share by Company
- 6.2.2 Global Volume Share by Company
- 6.2.3 Regional Revenue Share
- 6.2.4 Market Share Evolution ( vs. 2024)
- 6.2.5 OEM Segment Share by Company
- 6.2.6 Replacement Segment Share by Company
- 6.3 Production/Delivery Capacity & Facility Analysis
- 6.3.1 Global Installed Capacity
- 6.3.2 Capacity Utilization Rates
- 6.3.3 Production/Output Volume
- 6.3.4 Facility Locations & Capacity Map
- 6.3.5 Planned Capacity Additions
- 6.4 Library Management System Competitive Benchmarking Matrix
- 6.4.1 Revenue, Volume, CAGR & Profitability Comparison
- 6.4.2 Channel Revenue Mix
- 6.4.3 Geographic Revenue Exposure
- 6.4.4 R&D Intensity
- 6.4.5 Sustainability Maturity
- 6.5 Strategic Developments in Library Management System (Last 24 Months)
- 6.5.1 Mergers, Acquisitions & Divestments
- 6.5.2 New Library Management System Launches
- 6.5.3 Facility Expansions
- 6.5.4 Strategic Alliances, Joint Ventures & Partnerships
- 6.5.5 Distribution Expansion & Market Entry
- 6.5.6 Sustainability & ESG Initiatives
- 6.6 Competitive Strategy Mapping
- 6.6.1 Leader, Challenger, Follower & Niche Classification
- 6.6.2 Pricing Strategy Comparison
- 6.6.3 Channel Strategy Matrix
Note: Strategic developments are included based on their materiality and the availability of reliable information.
Chapter 7. Global Library Management System Market – By Distribution Channel
- 7.1 Segment Overview
- 7.1.1 Volume & Revenue Split by Channel (2024 & 2032)
- 7.1.2 Channel Mix Evolution (2024-2032)
Chapter 8. Regional Market Analysis – Global Overview
- 8.1 Global Regional Overview
- 8.1.1 Regional Volume Share
- 8.1.2 Regional Revenue Share
- 8.1.3 Regional Volume by Region
- 8.1.4 Regional Revenue by Region
- 8.1.5 Regional Forecast Through 2032
- 8.2 Cross-Regional Segment Analysis
- 8.2.1 By Distribution Channel
- 8.2.2 By Brand/Price Tier
Chapter 9. North America Library Management System Market
- 9.1 United States
- 9.2 Canada
- 9.3 Mexico
Chapter 10. Europe Library Management System Market
- 10.1 Germany
- 10.2 France
- 10.3 Italy
- 10.4 United Kingdom
- 10.5 Spain
- 10.6 Poland
- 10.7 Russia
- 10.8 Netherlands
- 10.9 Belgium
- 10.10 Sweden
- 10.11 Denmark
- 10.12 Norway
- 10.13 Rest of Europe
Chapter 11. Asia Pacific Library Management System Market
- 11.1 China
- 11.2 India
- 11.3 Japan
- 11.4 South Korea
- 11.5 Thailand
- 11.6 Indonesia
- 11.7 Vietnam
- 11.8 Malaysia
- 11.9 Australia
- 11.10 Rest of Asia Pacific
Chapter 12. Latin America Library Management System Market
- 12.1 Brazil
- 12.2 Argentina
- 12.3 Colombia
- 12.4 Chile
- 12.5 Rest of Latin America
Chapter 13. Middle East Library Management System Market
- 13.1 Saudi Arabia
- 13.2 United Arab Emirates
- 13.3 Turkey
- 13.4 Israel
- 13.5 Iran
- 13.6 Rest of the Middle East
Chapter 14. Africa Library Management System Market
- 14.1 South Africa
- 14.2 Egypt
- 14.3 Nigeria
- 14.4 Morocco
- 14.5 Rest of Africa
Chapter 15. Library Management System Company Profiles
- 15.1 [Company 01]
- 15.1.1 Company Overview
- 15.1.2 Key Management Personnel
- 15.1.3 Products & Services Portfolio
- 15.1.4 Financial Performance
- 15.1.5 Key Market Focus & Geographic Presence
- 15.1.6 Recent Developments & Strategic Initiatives
Note: The company profile list is preliminary and may change based on research findings, market developments, data availability, and client requirements.
Chapter 16. Appendices
- Appendix A – List of Abbreviations & Acronyms
- Appendix B – Industry Classification Code Reference – Full Series
- Appendix C – Production & Capacity Data Tables
- Appendix D – End-Use & Demand Base Tables
- Appendix E – Consumption & Replacement Rate Assumptions
- Appendix F – ASP Reference Tables
- Appendix G – Manufacturing & Facility Database
- Appendix H – Import-Export Data Tables
- Appendix I – Regulatory Summary Tables
- Appendix J – Primary Research Participant List (Anonymized)
- Appendix K – Primary Research Questionnaire Framework
- Appendix L – Data Sources & Bibliography
- Appendix M – Market Size Divergence & Source Comparison
Chapter 17. Research Methodology
- 17.1 Research Framework & Philosophy
- 17.2 Secondary Research – Sources, Hierarchy & Data Extraction
- 17.3 Data Modeling – Bottom-Up & Top-Down Market Sizing
- 17.4 Primary Research – Stakeholder Framework, LOI & Sample Sizes
- 17.5 Forecast Methodology – Regression, Scenario & Sensitivity Analysis
- 17.6 Quality Control – Four-Layer Validation Framework
- 17.7 Limitations & Standard Assumptions
- 17.8 Disclaimer
