
Smart Contact Lens Market Overview:
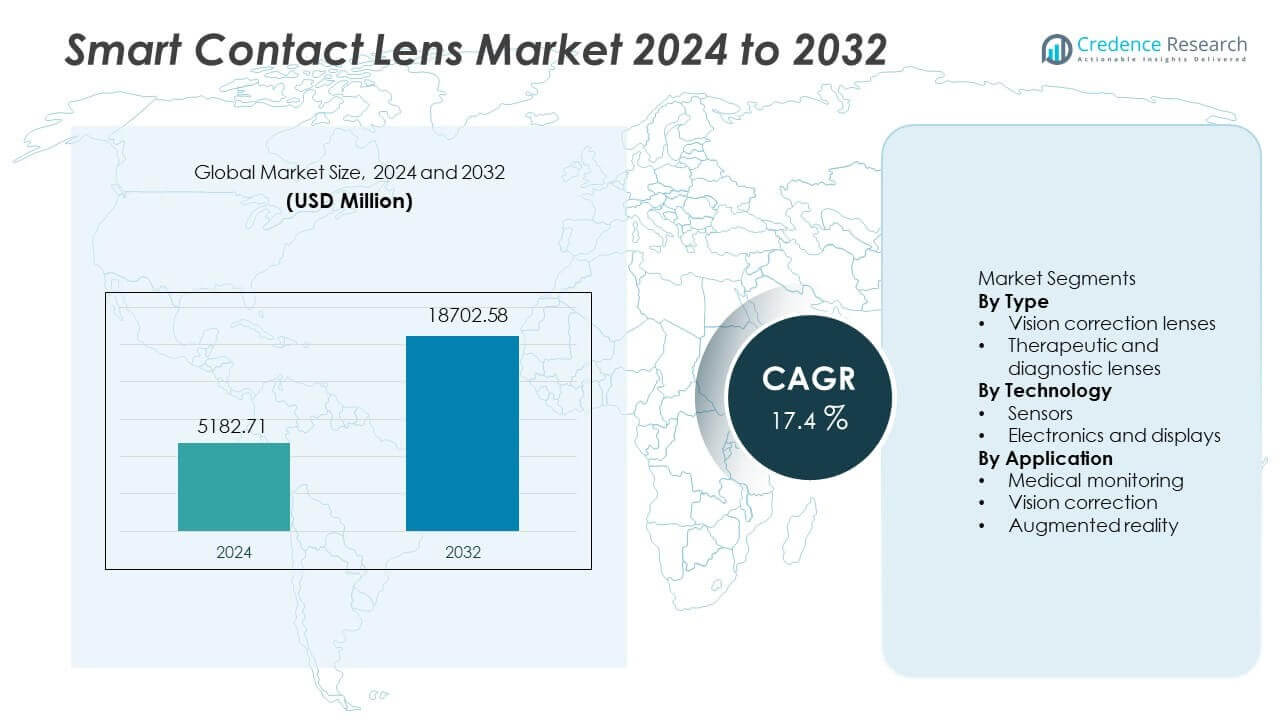
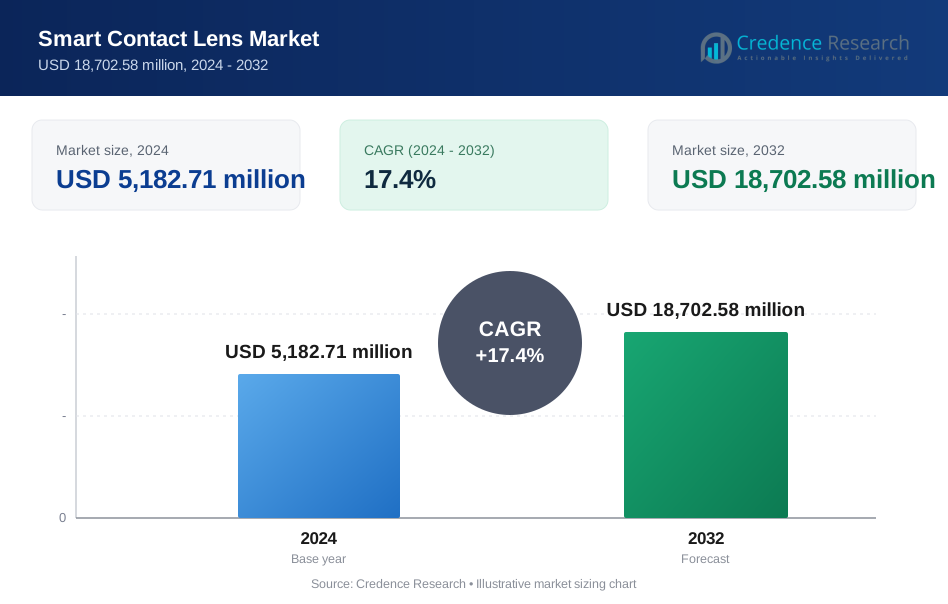
The smart contact lens market was valued at USD 5,182.71 million in 2024 and is expected to reach USD 18,702.58 million by 2032, growing at a CAGR of 17.4% during the forecast period.
| REPORT ATTRIBUTE | DETAILS |
|---|---|
| Historical Period | 2020-2023 |
| Base Year | 2024 |
| Forecast Period | 2025-2032 |
| Smart Contact Lens Market Size 2024 | USD 5,182.71 million |
| Smart Contact Lens Market, CAGR | 17.4% |
| Smart Contact Lens Market Size 2032 | USD 18,702.58 million |
Smart Contact Lens Market Insights
- Rising demand for non-invasive health monitoring acts as a key market driver, with vision correction lenses leading the type segment at a 61% share due to high prevalence of refractive disorders.
- Major market trends include strong adoption of sensor-based technologies, which hold a 57% segment share, supported by real-time monitoring of glucose levels and intraocular pressure.
- Competitive analysis shows an innovation-led market where major players focus on R&D, sensor miniaturization, and partnerships with healthcare and technology firms to accelerate commercialization.
- Regional analysis indicates North America leads with a 36% market share, followed by Europe at 28%, Asia Pacific at 26%, Latin America at 6%, and the Middle East and Africa at 4%.
Smart Contact Lens Market Segmentation Analysis:
By Type
By type, vision correction lenses dominate the smart contact lens market with a 61% market share, driven by rising prevalence of refractive errors and strong adoption of digital vision correction solutions. These lenses integrate smart features such as autofocus adjustment and vision enhancement while maintaining core corrective functionality. High demand from aging populations and increasing screen exposure supports adoption. Established eyewear manufacturers and technology firms actively invest in smart corrective lenses to improve comfort and usability. Therapeutic and diagnostic lenses hold the remaining share, supported by growing interest in non-invasive health monitoring, particularly for glucose and ocular pressure measurement.
- For instance, Mojo Vision demonstrated a smart lens prototype featuring a micro-LED display with 14,000 pixels per inch, enhancing clarity for vision-impaired users.
By Technology
By technology, sensors lead the market with a 57% market share, supported by their critical role in real-time health data collection. Embedded sensors enable continuous monitoring of biomarkers such as glucose levels, intraocular pressure, and hydration. Medical device companies prioritize sensor integration to support early diagnosis and disease management. Advances in miniaturization and biocompatible materials improve accuracy and wearer comfort. Electronics and display technologies follow, driven by applications requiring data visualization and connectivity. However, sensor dominance remains strong due to direct clinical value and expanding healthcare use cases.
- For instance, Google’s Verily tested a glucose-sensing lens platform with micro-sensors designed to detect analytes in tear fluid at one reading per second.
By Application
By application, medical monitoring holds the largest share at 49%, driven by increasing demand for continuous and non-invasive health tracking solutions. Smart contact lenses support monitoring of chronic conditions such as diabetes and glaucoma, improving patient compliance and early intervention. Healthcare providers favor these solutions for real-time data access and reduced patient burden. Vision correction follows, supported by integration of smart features into corrective lenses. Augmented reality represents a smaller but emerging share, driven by innovation in wearable displays and human–machine interaction for future consumer and enterprise applications.
Key Growth Drivers
Rising Demand for Non-Invasive Health Monitoring
Growing preference for non-invasive medical solutions strongly drives the smart contact lens market. Smart lenses enable continuous monitoring of biomarkers such as glucose levels and intraocular pressure without blood sampling or bulky devices. This capability improves patient comfort and compliance, especially among individuals with chronic conditions. Healthcare providers value real-time data access for early diagnosis and treatment adjustment. Increasing focus on preventive care further supports adoption. Technological advances in biocompatible materials and micro-sensors enhance safety and accuracy. This driver remains central as healthcare systems seek patient-friendly monitoring tools.
- For instance, Sensimed AG reported clinical use of its Triggerfish smart lens system that tracked intraocular pressure changes over 288 data points across 24 hours during wear.
Increasing Prevalence of Vision Disorders and Digital Eye Strain
Rising cases of myopia, presbyopia, and digital eye strain fuel demand for smart vision correction solutions. Prolonged screen exposure across all age groups increases visual fatigue and corrective needs. Smart contact lenses offer adaptive vision correction and enhanced visual comfort. Aging populations also contribute to sustained demand for advanced corrective technologies. Eye care professionals increasingly support innovative solutions that combine correction with digital functionality. This driver supports consistent market growth as visual health becomes a global priority.
- For instance, Johnson & Johnson Vision reported presbyopia product trials using advanced hydrogel lens materials delivering oxygen transmissibility of 147 Dk/t, improving comfort during extended wear.
Advancements in Microelectronics and Sensor Technologies
Rapid progress in microelectronics accelerates smart contact lens development. Miniaturized sensors, flexible circuits, and wireless communication improve lens functionality without compromising comfort. Improved power efficiency supports longer wear time. Technology integration enables accurate data transmission to external devices. Collaboration between medical device firms and technology companies strengthens innovation pipelines. These advancements reduce technical barriers and accelerate commercialization, making smart lenses more viable for large-scale adoption.
Key Trends and Opportunities
Integration of Smart Lenses with Digital Health Ecosystems
Integration with digital health platforms creates strong growth opportunities. Smart contact lenses increasingly connect with smartphones and cloud-based systems. This integration enables data analytics, remote monitoring, and personalized healthcare management. Healthcare providers benefit from continuous patient data streams. Technology firms explore partnerships to expand ecosystem compatibility. This trend supports scalable deployment and enhances value for both patients and providers.
- For instance, Innovega Inc. tested its iOptik platform, which utilizes specialized contact lenses paired with wearable glasses to deliver visual data through integrated micro-displays for device processing.
Emergence of Augmented Reality and Vision Enhancement Applications
Augmented reality applications present future growth opportunities. Smart lenses with display capabilities support real-time information overlay and enhanced vision experiences. Potential use cases include navigation, training, and assistive vision. Ongoing research improves display resolution and energy efficiency. Early-stage development attracts investment and innovation. This trend positions smart lenses beyond healthcare, expanding long-term commercial potential.
- For instance, Sony Corporation has secured patents describing ultra-thin film layers designed to improve energy efficiency and reduce power loss during display use.
Key Challenges
Technical Complexity and Power Management Limitations
Smart contact lenses face significant technical challenges. Integrating electronics into thin, flexible lenses requires advanced engineering. Power supply limitations restrict functionality and wear duration. Heat management and signal stability remain concerns. Addressing these issues increases development time and costs. Overcoming technical constraints remains critical for widespread adoption.
Regulatory Approval and High Development Costs
Regulatory approval processes pose major challenges. Smart contact lenses combine medical devices and electronics, requiring strict safety validation. Clinical trials and compliance increase time to market. High research and development costs limit entry for smaller players. Pricing pressure also affects commercialization. Navigating regulatory complexity remains a key hurdle for market expansion.
Regional Analysis
North America
North America holds 36% market share in the smart contact lens market, driven by strong healthcare spending and early technology adoption. The region benefits from advanced R&D capabilities and close collaboration between medical device firms and technology companies. High prevalence of diabetes and glaucoma supports demand for non-invasive monitoring solutions. Regulatory clarity and strong clinical trial infrastructure accelerate commercialization. Eye care professionals show openness to innovative vision technologies. Consumer awareness of wearable health devices further supports adoption. Presence of leading innovators and startups strengthens product development and pilot deployments across the United States and Canada.
Europe
Europe accounts for 28% market share, supported by robust healthcare systems and strong emphasis on preventive care. Regulatory frameworks encourage patient safety and clinical validation, supporting steady adoption. Rising incidence of vision disorders and aging populations drive demand for smart vision correction. Research institutions and medtech firms collaborate on sensor and biocompatible material innovation. Public healthcare adoption supports trials in medical monitoring applications. Consumer acceptance of advanced medical wearables remains high. Western Europe leads adoption, while Central and Eastern Europe show gradual uptake driven by healthcare modernization.
Asia Pacific
Asia Pacific commands 26% market share, driven by large patient populations and rapid healthcare digitization. Rising prevalence of diabetes and myopia supports strong demand for medical monitoring and vision correction. Governments invest in digital health infrastructure and innovation. Manufacturing capabilities and cost advantages support scalable production. Growing middle-class income increases access to advanced eye care solutions. Japan, South Korea, and China lead in technology integration and clinical research. Partnerships between local manufacturers and global firms accelerate market entry and adoption across the region.
Latin America
Latin America holds 6% market share, supported by improving healthcare access and growing awareness of advanced eye care. Urban centers drive early adoption through private clinics and specialty hospitals. Demand focuses on vision correction and diagnostic applications. Limited reimbursement and higher device costs slow broader uptake. However, rising chronic disease prevalence supports long-term potential. International companies expand distributor networks to improve availability. Regulatory progress and pilot programs help build clinical confidence. Brazil and Mexico remain key markets for initial commercialization.
Middle East and Africa
The Middle East and Africa represent 4% market share, driven by investments in healthcare modernization and specialty care. Adoption concentrates in high-income Gulf countries with advanced medical infrastructure. Demand centers on medical monitoring for chronic disease management. Limited awareness and reimbursement constraints affect wider adoption. Import dependence influences pricing and availability. However, government-led digital health initiatives support pilot deployments. Growing private healthcare investment and technology partnerships create long-term opportunities for smart contact lens adoption across select markets.
Smart Contact Lens Market Segmentations:
By Type
- Vision correction lenses
- Therapeutic and diagnostic lenses
By Technology
- Sensors
- Electronics and displays
By Application
- Medical monitoring
- Vision correction
- Augmented reality
By Geography
- North America
- U.S.
- Canada
- Mexico
- Europe
- Germany
- France
- U.K.
- Italy
- Spain
- Rest of Europe
- Asia Pacific
- China
- Japan
- India
- South Korea
- South-east Asia
- Rest of Asia Pacific
- Latin America
- Brazil
- Argentina
- Rest of Latin America
- Middle East & Africa
- GCC Countries
- South Africa
- Rest of the Middle East and Africa
Competitive Landscape
Competitive landscape analysis highlights an innovation-driven smart contact lens market led by key players including Johnson & Johnson Vision, Alcon Inc., Novartis AG, Google (Verily Life Sciences), Sensimed AG, Mojo Vision Inc., Samsung Electronics Co., Ltd., Sony Corporation, Medella Health, and Innovega Inc. These companies focus on advanced sensor integration, biocompatible materials, and wireless data transmission to enhance lens performance. Strategic collaborations between technology firms and medical device companies accelerate research and clinical validation. Leading players invest heavily in R&D to address power efficiency, comfort, and long-term wearability. Regulatory approvals and clinical trials remain central to competitive positioning. Companies also explore partnerships with healthcare providers and digital health platforms to support data-driven monitoring solutions. Smaller innovators compete by targeting niche applications such as glaucoma monitoring and augmented reality-enabled vision enhancement.
Key Player Analysis
- Johnson & Johnson Vision
- Alcon Inc.
- Novartis AG
- Google (Verily Life Sciences)
- Sensimed AG
- Mojo Vision Inc.
- Samsung Electronics Co., Ltd.
- Sony Corporation
- Medella Health
- Innovega Inc.
Recent Developments
- In September 2025, Alcon Inc. announced new eye-care innovations and study highlights at the ESCRS 2025 meeting, showing its ongoing advanced eye technology work.
- In 2023, Mojo Vision Inc. officially halted development of the Mojo Lens to pivot its business toward commercializing its Micro-LED display technology.
Report Coverage
The research report offers an in-depth analysis based on Type, Technology, Application and Geography. It details leading market players, providing an overview of their business, product offerings, investments, revenue streams, and key applications. Additionally, the report includes insights into the competitive environment, SWOT analysis, current market trends, as well as the primary drivers and constraints. Furthermore, it discusses various factors that have driven market expansion in recent years. The report also explores market dynamics, regulatory scenarios, and technological advancements that are shaping the industry. It assesses the impact of external factors and global economic changes on market growth. Lastly, it provides strategic recommendations for new entrants and established companies to navigate the complexities of the market.
Future Outlook
- Adoption of smart contact lenses will increase as non-invasive health monitoring gains acceptance.
- Medical monitoring applications will remain the primary demand driver.
- Sensor accuracy and miniaturization will continue to improve lens performance.
- Integration with digital health platforms will expand clinical and remote monitoring use.
- Vision correction lenses will incorporate more adaptive and automated features.
- Regulatory approvals will support gradual commercialization across major regions.
- Augmented reality capabilities will open new long-term application areas.
- Partnerships between technology firms and medical device companies will increase.
- Manufacturing scale-up will improve affordability and market penetration.
- Emerging markets will show rising adoption as healthcare infrastructure advances.
Request a Free Sample
Fill in your details and we'll send you a free sample report.
- Sample data tables & charts
- Research methodology
Need a Custom Version of This Report?
Tailor the scope, geography, or segments to your exact requirements.
- Custom geography or segment scope
- Direct access to our analyst team
Frequently Asked Questions
What is the current market size for the Smart Contact Lens market, and what is its projected size in 2032?
At what Compound Annual Growth Rate is the Smart Contact Lens market projected to grow between 2024 and 2032?
Which Smart Contact Lens market segment held the largest share in 2024?
What are the primary factors fueling the growth of the Smart Contact Lens market?
Who are the leading companies in the Smart Contact Lens market?
Which region commanded the largest share of the Smart Contact Lens market in 2024?
Table of Content
Chapter 1. Report Introduction
- 1.1 Report Description & Purpose
- 1.1.1 Report Title & Market Definition
- 1.1.2 Unique Selling Propositions (USP) & Key Differentiators
- 1.1.3 Value Proposition for Stakeholders
- 1.2 Research Objectives
- 1.2.1 Market Sizing Objectives (Volume & Revenue)
- 1.2.2 Segmentation Objectives
- 1.2.3 Competitive Intelligence Objectives
- 1.2.4 Forecast & Scenario Objectives
- 1.3 Report Scope
- 1.3.1 Smart Contact Lens Scope – Types & Subtypes Covered
- 1.3.2 Geographic Scope – Regions & Countries Covered
- 1.3.3 Historical Period, Base Year & Forecast Period (2024; forecast to 2032)
- 1.3.4 Inclusions & Exclusions
- 1.4 HS Code & Classification Framework
- 1.5 Currency, Units & Pricing Basis
- 1.6 Target Stakeholders
- 1.7 Limitations & Assumptions
Chapter 2. Executive Summary
- 2.1 Global Smart Contact Lens Market Snapshot
- 2.1.1 Market Size – Historical (2024) & Forecast (2024-2032) (2024: USD 5,182.71 million → 2032: USD 18,702.58 million)
- 2.1.2 Volume & Revenue – Global Totals
- 2.1.3 Key Market Highlights – Top Five Facts
- 2.2 Smart Contact Lens Market Segmentation Snapshot
- 2.2.1 Market Split by Region – 2024 vs. 2032
- 2.3 Competitive Snapshot
- 2.3.1 Top 10 Players by Revenue Share – 2024
- 2.3.2 Top 10 Players by Volume Share – 2024
- 2.3.3 Recent Strategic Developments (18-Month Summary)
- 2.4 Key Investment Highlights & Strategic Conclusions
Chapter 3. Smart Contact Lens Market Dynamics & Industry Analysis
- 3.1 Market Overview & Context
- 3.1.1 Smart Contact Lens Market Position in the Broader Automotive Value Chain
- 3.1.2 OEM vs. Replacement Market Dynamics
- 3.1.3 Market Maturity & Development Stage by Region
- 3.2 Smart Contact Lens Market Drivers
- 3.3 Smart Contact Lens Market Restraints & Challenges
- 3.4 Smart Contact Lens Market Opportunities
- 3.5 Porter's Five Forces Analysis
- 3.5.1 Threat of New Entrants
- 3.5.2 Bargaining Power of Suppliers
- 3.5.3 Bargaining Power of Buyers
- 3.5.4 Threat of Substitutes
- 3.5.5 Competitive Rivalry – Intensity Assessment
- 3.6 Smart Contact Lens Value Chain Analysis
- 3.6.1 Upstream – Raw Material/Input Suppliers
- 3.6.1.1 Raw Material/Input 1
- 3.6.1.2 Raw Material/Input 2
- 3.6.1.3 Raw Material/Input 3
- 3.6.2 Midstream – Production/Manufacturing/Service Delivery
- 3.6.2.1 Production/Process Overview
- 3.6.2.2 Key Facility Locations & Capacity by Manufacturer
- 3.6.3 Downstream – Distribution & End Consumer
- 3.6.3.1 Primary Channel – B2B/OEM
- 3.6.3.2 Secondary Channels – Dealer, Retail, Online, Direct
- 3.6.4 Value Chain Profitability Analysis
- 3.6.1 Upstream – Raw Material/Input Suppliers
- 3.7 PESTEL Analysis
- 3.7.1 Political Factors
- 3.7.2 Economic Factors
- 3.7.3 Social Factors
- 3.7.4 Technological Factors
- 3.7.5 Environmental Factors
- 3.7.6 Legal Factors
- 3.8 Smart Contact Lens Supply Chain Analysis
- 3.8.1 Raw Material/Input Supply Risk Assessment
- 3.8.2 Manufacturing Concentration Risk (Geographic Exposure)
- 3.8.3 Trade Disruption Impact Analysis
- 3.9 Regulatory & Policy Landscape
Note: The regulatory and policy landscape section covers regulations based on their applicability to the market, Smart Contact Lens category, geography, and scope of the study. Only regulatory frameworks with a material impact on operations, compliance, trade, sustainability, or market access are analyzed in detail.
Chapter 4. Key Investment Pockets & Opportunity Analysis
- 4.1 Smart Contact Lens Market Attractiveness Analysis
- 4.1.1 By Region – Investment Attractiveness Matrix (Volume × CAGR)
- 4.2 Absolute Revenue Growth Opportunity
- 4.2.1 By Region – Absolute USD Growth Through 2032
- 4.3 Incremental Volume Opportunity
- 4.3.1 By Region – Incremental Volume Through 2032
- 4.3.2 Segment – Incremental Volume
- 4.4 Emerging Submarket Opportunity Deep Dive (Subject to Applicability)
- 4.5 Emerging Market Opportunity Scorecards
- 4.5.1 United States
- 4.5.2 Europe
- 4.5.3 Asia
- 4.5.4 Middle East & Africa
Note: Emerging Market Opportunity Scorecards will be included based on relevance and strategic importance. Regions listed are indicative and may vary depending on data availability and market dynamics.
Chapter 5. Smart Contact Lens Import-Export Analysis & Trade Flows
- 5.1 Global Trade Overview
- 5.1.1 Global Export Value by Country (2024)
- 5.1.2 Global Export Volume by Country (2024)
- 5.1.3 Global Import Value by Country (2024)
- 5.1.4 Global Import Volume by Country (2024)
- 5.1.5 Net Trade Balance by Country (2024)
- 5.2 Export Analysis – Segment
- 5.2.1 Type 1 (HS Code)
- 5.2.2 Type 2 (HS Code)
- 5.2.3 Type 3 (HS Code)
- 5.2.4 Type 4 (HS Code)
- 5.2.5 Type 5 (HS Code)
- 5.3 Import Analysis – Segment
- 5.3.1 Type 1 (HS Code)
- 5.3.2 Type 2 (HS Code)
- 5.3.3 Type 3 (HS Code)
- 5.3.4 Type 4 (HS Code)
- 5.3.5 Type 5 (HS Code)
- 5.4 Average Unit Trade Prices
- 5.4.1 Average Export Price – Segment & Country
- 5.4.2 Average Import Price – Segment & Source Country
- 5.4.3 Price Trends (2024)
- 5.5 Key Trade Route Analysis
- 5.5.1 Trade Route 1
- 5.5.2 Trade Route 2
- 5.5.3 Trade Route 3
- 5.5.4 Trade Route 4
- 5.5.5 Trade Route 5
- 5.6 Trade Policy Impact Assessment
- 5.6.1 US Anti-Dumping & Section 301 Tariffs
- 5.6.2 EU Customs Union Impact
- 5.6.3 Major Free Trade Agreements
- 5.6.4 USMCA Rules of Origin
Note: Trade policy analysis will be included only where relevant to the Smart Contact Lens market.
Chapter 6. Competitive Landscape & Company Benchmarking
- 6.1 Smart Contact Lens Market Concentration & Structure
- 6.1.1 Herfindahl-Hirschman Index (HHI) – vs. 2024
- 6.1.2 Tier 1, Tier 2 & Tier 3 Market Structure
- 6.1.3 Global, Regional & Local Player Dynamics
- 6.2 Smart Contact Lens Market Share Analysis – 2024
- 6.2.1 Global Revenue Share by Company
- 6.2.2 Global Volume Share by Company
- 6.2.3 Regional Revenue Share
- 6.2.4 Market Share Evolution ( vs. 2024)
- 6.2.5 OEM Segment Share by Company
- 6.2.6 Replacement Segment Share by Company
- 6.3 Production/Delivery Capacity & Facility Analysis
- 6.3.1 Global Installed Capacity
- 6.3.2 Capacity Utilization Rates
- 6.3.3 Production/Output Volume
- 6.3.4 Facility Locations & Capacity Map
- 6.3.5 Planned Capacity Additions
- 6.4 Smart Contact Lens Competitive Benchmarking Matrix
- 6.4.1 Revenue, Volume, CAGR & Profitability Comparison
- 6.4.2 Channel Revenue Mix
- 6.4.3 Geographic Revenue Exposure
- 6.4.4 R&D Intensity
- 6.4.5 Sustainability Maturity
- 6.5 Strategic Developments in Smart Contact Lens (Last 24 Months)
- 6.5.1 Mergers, Acquisitions & Divestments
- 6.5.2 New Smart Contact Lens Launches
- 6.5.3 Facility Expansions
- 6.5.4 Strategic Alliances, Joint Ventures & Partnerships
- 6.5.5 Distribution Expansion & Market Entry
- 6.5.6 Sustainability & ESG Initiatives
- 6.6 Competitive Strategy Mapping
- 6.6.1 Leader, Challenger, Follower & Niche Classification
- 6.6.2 Pricing Strategy Comparison
- 6.6.3 Channel Strategy Matrix
Note: Strategic developments are included based on their materiality and the availability of reliable information.
Chapter 7. Global Smart Contact Lens Market – By Distribution Channel
- 7.1 Segment Overview
- 7.1.1 Volume & Revenue Split by Channel (2024 & 2032)
- 7.1.2 Channel Mix Evolution (2024-2032)
Chapter 8. Regional Market Analysis – Global Overview
- 8.1 Global Regional Overview
- 8.1.1 Regional Volume Share
- 8.1.2 Regional Revenue Share
- 8.1.3 Regional Volume by Region
- 8.1.4 Regional Revenue by Region
- 8.1.5 Regional Forecast Through 2032
- 8.2 Cross-Regional Segment Analysis
- 8.2.1 By Distribution Channel
- 8.2.2 By Brand/Price Tier
Chapter 9. North America Smart Contact Lens Market
- 9.1 United States
- 9.2 Canada
- 9.3 Mexico
Chapter 10. Europe Smart Contact Lens Market
- 10.1 Germany
- 10.2 France
- 10.3 Italy
- 10.4 United Kingdom
- 10.5 Spain
- 10.6 Poland
- 10.7 Russia
- 10.8 Netherlands
- 10.9 Belgium
- 10.10 Sweden
- 10.11 Denmark
- 10.12 Norway
- 10.13 Rest of Europe
Chapter 11. Asia Pacific Smart Contact Lens Market
- 11.1 China
- 11.2 India
- 11.3 Japan
- 11.4 South Korea
- 11.5 Thailand
- 11.6 Indonesia
- 11.7 Vietnam
- 11.8 Malaysia
- 11.9 Australia
- 11.10 Rest of Asia Pacific
Chapter 12. Latin America Smart Contact Lens Market
- 12.1 Brazil
- 12.2 Argentina
- 12.3 Colombia
- 12.4 Chile
- 12.5 Rest of Latin America
Chapter 13. Middle East Smart Contact Lens Market
- 13.1 Saudi Arabia
- 13.2 United Arab Emirates
- 13.3 Turkey
- 13.4 Israel
- 13.5 Iran
- 13.6 Rest of the Middle East
Chapter 14. Africa Smart Contact Lens Market
- 14.1 South Africa
- 14.2 Egypt
- 14.3 Nigeria
- 14.4 Morocco
- 14.5 Rest of Africa
Chapter 15. Smart Contact Lens Company Profiles
- 15.1 [Company 01]
- 15.1.1 Company Overview
- 15.1.2 Key Management Personnel
- 15.1.3 Products & Services Portfolio
- 15.1.4 Financial Performance
- 15.1.5 Key Market Focus & Geographic Presence
- 15.1.6 Recent Developments & Strategic Initiatives
Note: The company profile list is preliminary and may change based on research findings, market developments, data availability, and client requirements.
Chapter 16. Appendices
- Appendix A – List of Abbreviations & Acronyms
- Appendix B – Industry Classification Code Reference – Full Series
- Appendix C – Production & Capacity Data Tables
- Appendix D – End-Use & Demand Base Tables
- Appendix E – Consumption & Replacement Rate Assumptions
- Appendix F – ASP Reference Tables
- Appendix G – Manufacturing & Facility Database
- Appendix H – Import-Export Data Tables
- Appendix I – Regulatory Summary Tables
- Appendix J – Primary Research Participant List (Anonymized)
- Appendix K – Primary Research Questionnaire Framework
- Appendix L – Data Sources & Bibliography
- Appendix M – Market Size Divergence & Source Comparison
Chapter 17. Research Methodology
- 17.1 Research Framework & Philosophy
- 17.2 Secondary Research – Sources, Hierarchy & Data Extraction
- 17.3 Data Modeling – Bottom-Up & Top-Down Market Sizing
- 17.4 Primary Research – Stakeholder Framework, LOI & Sample Sizes
- 17.5 Forecast Methodology – Regression, Scenario & Sensitivity Analysis
- 17.6 Quality Control – Four-Layer Validation Framework
- 17.7 Limitations & Standard Assumptions
- 17.8 Disclaimer
