
Market Overview
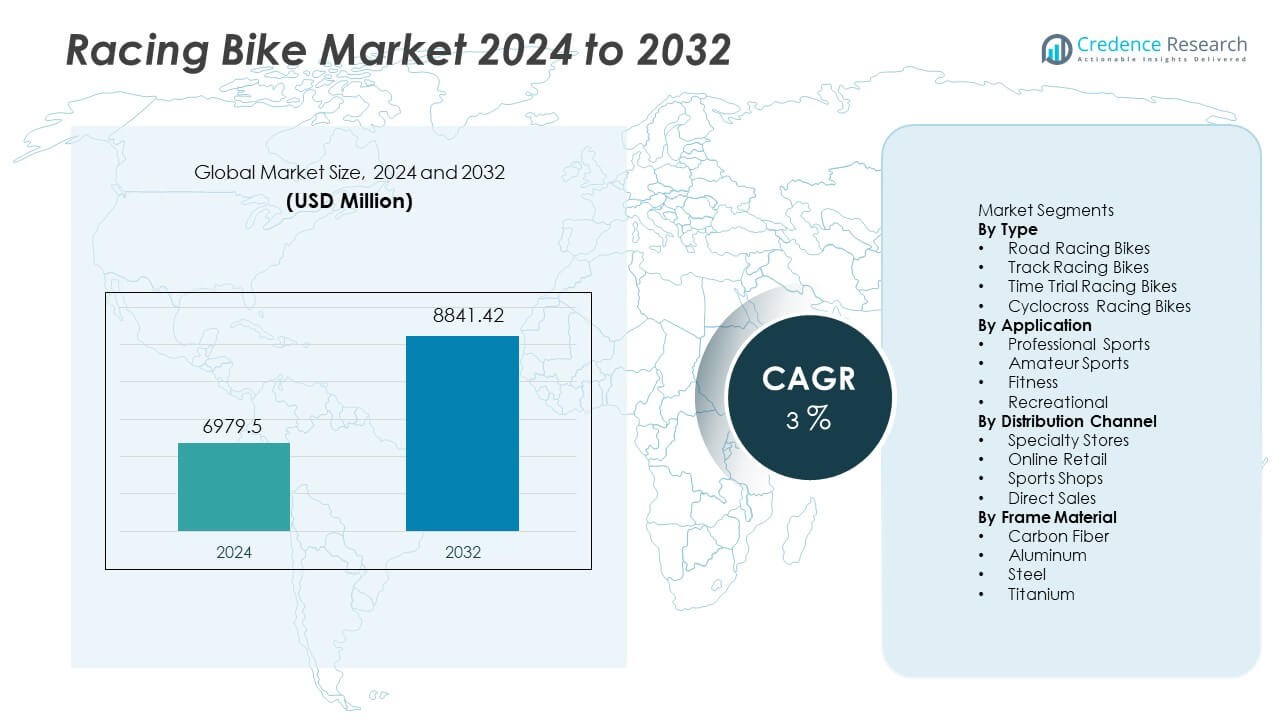
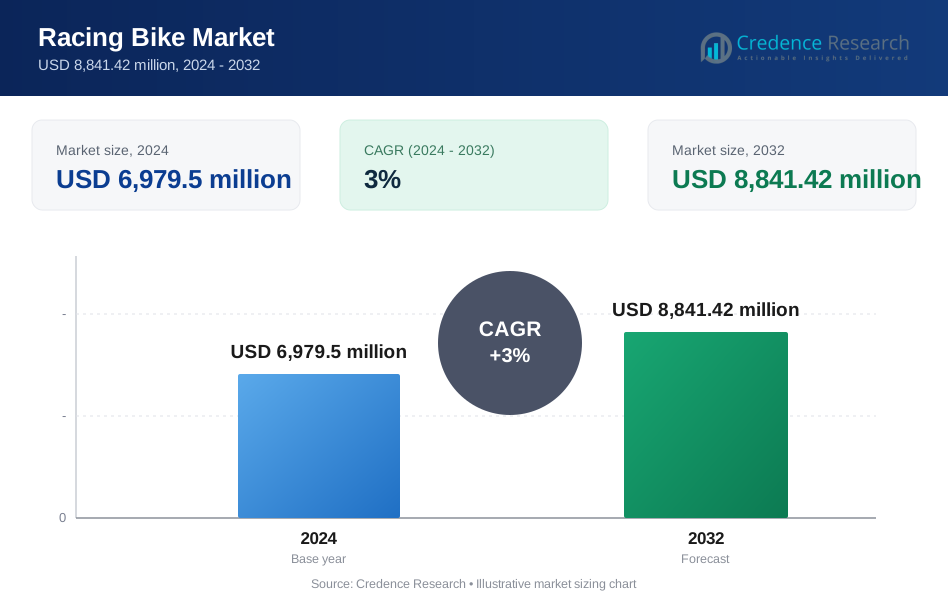
The racing bike market reached USD 6,979.5 million in 2024. The market is forecast to grow to USD 8,841.42 million by 2032. This sector is expected to expand at a CAGR of 3% during the forecast period.
| REPORT ATTRIBUTE | DETAILS |
|---|---|
| Historical Period | 2020-2023 |
| Base Year | 2024 |
| Forecast Period | 2025-2032 |
| Racing Bike Market Size 2024 | USD 6,979.5 Million |
| Racing Bike Market, CAGR | 3% |
| Racing Bike Market Size 2032 | USD 8,841.42 Million |
Top players in the racing bike market include Specialized Bicycle Components, Trek Bicycle, Giant Bicycles, Cannondale, Canyon Bicycles, BMC Switzerland, Merida Industry, Focus Bikes, Colnago, and Bianchi. These companies focus on advanced carbon frames, aerodynamic geometry, and integrated performance components that support professional racing standards and endurance cycling needs. Europe stands as the leading region with 34% share, supported by strong cycling culture, established tournaments, and high participation in professional road racing events. Asia Pacific follows with rising demand driven by expanding fitness adoption, increasing cycling clubs, and growth in competitive events across China, Japan, and Australia.
Market Insights
- The racing bike market reached USD 6,979.5 million in 2024 and is forecast to hit USD 8,841.42 million by 2032 at a CAGR of 3%.
- Growing participation in competitive cycling and rising interest in endurance fitness drive advanced frame adoption and premium product replacement across professional and amateur racing segments.
- Carbon frame innovation, aerodynamic integration, and rising customization trends support premium demand and encourage rapid component upgrades across Road Racing Bikes, which held 42% share.
- Leading companies focus on sponsorships, performance engineering, and lightweight material development, while high cost and limited cycling infrastructure in developing regions restrict wider adoption and volume penetration.
- Europe leads with 34% share, followed by Asia Pacific at 29% and North America at 28%, while Latin America and Middle East and Africa remain smaller markets due to limited racing culture and lower spending on premium performance equipment.
Market Segmentation Analysis:
By Type
Road racing bikes remained the dominant type and held 42% share in 2024, supported by their strong use in global racing tournaments and rising interest in long-distance endurance events. Track models gained steady demand from velodrome facilities and national cycling programs, while time trial products benefited from aerodynamic frame advances and carbon integration. Cyclocross racing bikes saw higher uptake across mixed-terrain competitions and winter sports clubs, which widened adoption outside traditional road segments. Manufacturers continued to launch lightweight frames and integrated braking systems that improved speed and safety, directly lifting demand in premium ranges. Endurance racing remains the primary growth driver as consumer focus shifts toward long-distance performance training and organized road events across developed markets worldwide.
- For instance, Specialized introduced the S-Works Tarmac SL8 with frame weight near 685 grams and reported drag reduction of 16 watts at 45 km/h compared with its earlier SL7 platform.
By Application
Professional sports accounted for the highest application share, representing 46% of total demand due to strong participation in international cycling events and brand sponsorship programs. Amateur riders expanded the consumer base through regional events and cycling clubs, while fitness-focused consumers adopted racing models as part of endurance and health routines. Recreational riders increasingly selected entry-level racing frames that offer competitive performance without premium pricing. The growth of televised cycling competitions and rising sponsorship investments strengthened product visibility across new countries. Expanding cycling academies and training institutions accelerated equipment replacement cycles. Product innovation, improved aerodynamics, and custom frame geometry further boosted professional usage, while amateur participation benefited from growing sports tourism and wider access to certified racing tracks.
- For instance, Canyon released the Aeroad CFR and used premium Toray M40X carbon to create a frame with next-level stiffness proven by many pro victories in UCI WorldTour stages.
By Distribution Channel
Specialty stores dominated distribution and captured 41% share, driven by greater preference for expert consultation, customized sizing, and professional component fitting that supports improved performance. Online retail expanded quickly through digital catalogs and configuration tools, while sports shops maintained steady volumes across urban locations offering mid-range racing products. Direct sales models increased due to brand-owned stores and test-ride events that promoted product engagement and brand loyalty. Better availability of premium carbon frames within specialty channels encouraged higher spending among professional and amateur riders. Online platforms capitalized on global shipping and seasonal promotions. Growing digital awareness and direct customization remained key drivers, while specialty stores continued to lead due to strong after-sales services and technical support advantages.
Key Growth Drivers
Rising Participation in Competitive Cycling
Competitive cycling events continue to expand across international and regional levels. Racing tournaments encourage higher product demand among professional and amateur riders. Sponsorship investments increase media exposure and improve athlete engagement with premium bikes. National cycling federations provide training support that drives equipment upgrades. Growing interest in endurance events attracts new entrants, who prefer advanced frames and lighter components. Youth programs encourage participation and help expand long-term cycling culture. Major brands partner with global competitions to promote performance models. This factor strengthens adoption in regions with established cycling networks and expanding sports tourism across many developed economies.
- For instance, Trek supplied the Madone SLR platform to the Lidl-Trek WorldTour team, which used it successfully in various stages, including mountainous terrain, demonstrating its capability as a versatile race bike.
Advances in Lightweight Materials
Innovations in carbon fiber and titanium frames support better aerodynamics and higher performance during long distance rides. Manufacturers focus on weight reduction without weakening durability or rigidity. Advanced components improve speed, handling, and climbing efficiency for competitive use. Integrated braking and aerodynamic profiles enhance safety and stability. Material innovation drives premium pricing and encourages professional riders to replace older frames. Composite structures deliver improved shock absorption during tough terrain rides. Investments in research and racing technology push steady product upgrades. This factor maintains brand differentiation and strengthens demand for high-end professional segments across competitive events.
- For instance, Pinarello used Torayca T1100 1K carbon on the Dogma F platform delivering frame stiffness near 128 N/mm during lab testing, Wilier Triestina applied HUS-MOD carbon on the Filante SLR and achieved sub-800 gram framesets across size medium builds, and Scott introduced the Foil RC using F01 airfoil shaping that reduced drag values by 13 watts at 45 km/h in wind tunnel measurements conducted in Switzerland.
Growing Fitness and Endurance Culture
Fitness demand rises as consumers adopt cycling for health improvement and personal performance goals. Social media platforms encourage participation through cycling groups and virtual long-distance challenges. Fitness apps promote tracking features that increase daily use of racing bikes. Gyms and sports academies add endurance cycling programs that raise adoption among new riders. Urban populations shift toward low-impact exercise and sustainable outdoor sports. Rising awareness of cardiovascular benefits supports consistent demand. The growing preference for long weekend rides also supports racing format choices. This driver expands customer interest beyond competitive sports and strengthens long-term product demand.
Key Trends and Opportunities
Expansion of E-Racing Platforms
Virtual racing events create new participation channels for global cyclists. Online simulation platforms host competitions that replicate professional circuits and endurance races. Riders invest in racing models that support digital resistance systems and precision drivetrain inputs. Smart trainers and connectivity solutions strengthen interest among home users. Brands sponsor e-racing leagues that attract large audiences and new athletes. Demand for data-enabled components grows due to performance analytics integration. Technology partnerships with sporting platforms generate long-term engagement. This trend opens cross-selling opportunities for digital accessories and performance upgrades across professional and recreational users.
- For instance, Wahoo Fitness integrated dual-band ANT+ and Bluetooth connectivity on its KICKR Smart Trainer supporting very high power accuracy, Tacx deployed Neo 2T direct drive technology enabling significant max torque output during virtual climbs, and Elite developed RealMotion inertia control delivering a substantial flywheel resistance on the Direto XR model for immersive e-racing training.
Customization and Premium Component Adoption
Consumers demand customized racing bikes that match fit, aerodynamics, and handling preferences. Riders select frame geometry, wheel profiles, and gearing based on competition needs or terrain type. Custom options support premium pricing and higher brand loyalty. Professional teams adopt precision-engineered drivetrains and aero components that showcase technology advantages. Demand for integrated cockpit designs and hidden cable routing expands across new launches. Lightweight wheels and advanced braking systems become standard in mid-premium ranges. This opportunity supports higher margins for leading brands and promotes frequent replacement cycles across professional riders and serious enthusiasts.
- For instance, Shimano delivered 12-speed Dura-Ace R9200 drivetrains with closer gear steps in the cassette's "sweet spot" for race efficiency, enabling smooth and continuous pedaling cadence. SRAM introduced RED AXS wireless shifting known for being its most responsive, quick, and precise front shifting to date.
Key Challenges
High Cost of Premium Racing Products
Premium racing bikes require advanced materials and high-precision engineering, which keeps pricing elevated for most consumer groups. Cost barriers limit adoption among amateurs and recreational cyclists in price-sensitive markets. Elite professional models require frequent component upgrades that further increase total spending. Many buyers postpone replacement decisions due to high investment requirements. Limited affordability slows penetration in emerging regions where cycling culture remains developing. Competitive brands introduce entry-level models, yet price remains a core restraint. This challenge continues to restrict volume expansion across non-professional user bases.
Limited Infrastructure in Developing Regions
Many developing regions lack dedicated cycling tracks and training facilities, which restricts participation in competitive racing formats. Urban traffic congestion and safety concerns discourage regular road usage among amateur riders. Limited access to skilled service centers slows adoption of advanced performance models. Racing events remain concentrated in established markets with strong cycling infrastructure. Developing countries need public programs and community support to encourage long-term participation. Without track networks and safe cycling lanes, market penetration stays uneven. This challenge slows brand expansion and limits racing culture development across emerging markets.
Regional Analysis
North America
North America accounted for 28% share in 2024, supported by strong cycling sports culture and widespread adoption of premium racing components. The United States leads demand due to large endurance communities and increasing participation in triathlon events. Canada benefits from organized cycling leagues and expanding investment in training facilities across urban centers. Product replacement rates remain high due to technology upgrades and performance optimization trends. Brands focus on carbon frames and advanced wheel systems that appeal to competitive users. Growth continues to depend on cycling infrastructure development and promotional activities from regional sports associations across both countries.
Europe
Europe held 34% share and remained the leading regional market owing to deep-rooted cycling traditions and strong professional racing tournaments such as Tour de France and Giro d’Italia. Western European countries support large-scale cycling participation and early adoption of lightweight materials in high-performance models. Increasing interest in recreational cycling improves entry-level segment penetration. Manufacturers expand sponsorship programs across European racing events, improving consumer engagement and brand recall. Product innovation focuses on aerodynamic frames tailored to European racing routes and climatic conditions. Rising government support for cycling-friendly mobility solutions continues to reinforce demand across professional and amateur riders.
Asia Pacific
Asia Pacific represented 29% share and recorded the fastest growth due to rising interest in competitive cycling events and emerging sports culture across China and Japan. Expanding urban cycling clubs support strong adoption of high-performance bikes among younger riders. Technological improvements in carbon fiber manufacturing across Asian countries enable competitive pricing compared with Western brands. Australia and South Korea report increasing cycling sports participation and rising demand for advanced racing components. Government focus on outdoor sports and health improvement contributes to broader consumer awareness. Asia Pacific remains a significant growth opportunity due to expanding recreational and competitive user bases.
Latin America
Latin America accounted for 5% share, driven by increasing interest in endurance cycling across Mexico, Brazil, and Argentina. Growth remains supported by regional cycling tournaments, expanding sports retail chains, and rising availability of imported premium models. High cost remains a challenge for wider market penetration, which keeps professional and amateur segments relatively narrow. Urban cycling initiatives and fitness awareness encourage long-distance riding and weekend activities, which support future adoption. Retail expansion and online sales channels help improve product accessibility. Market outlook remains positive but depends on economic stability and local sponsorship support across regional cycling events.
Middle East and Africa
Middle East and Africa held 4% share with gradual adoption driven by rising sports tourism and premium lifestyle spending in Gulf countries. Regional cycling events in the UAE and Qatar encourage greater participation in competitive racing and high-performance road biking. Local climate conditions favor indoor cycling clubs and specialized training centers, supporting niche demand for advanced frames. Africa shows early-stage growth led by recreational cycling and limited racing infrastructure. Price sensitivity remains a key barrier to expansion in many markets. Further development depends on sports promotion initiatives, cycling infrastructure, international events, and investment in professional training programs across major cities.
Market Segmentations:
By Type
- Road Racing Bikes
- Track Racing Bikes
- Time Trial Racing Bikes
- Cyclocross Racing Bikes
By Application
- Professional Sports
- Amateur Sports
- Fitness
- Recreational
By Distribution Channel
- Specialty Stores
- Online Retail
- Sports Shops
- Direct Sales
By Frame Material
- Carbon Fiber
- Aluminum
- Steel
- Titanium
By Geography
- North America
- U.S.
- Canada
- Mexico
- Europe
- Germany
- France
- U.K.
- Italy
- Spain
- Rest of Europe
- Asia Pacific
- China
- Japan
- India
- South Korea
- South-east Asia
- Rest of Asia Pacific
- Latin America
- Brazil
- Argentina
- Rest of Latin America
- Middle East & Africa
- GCC Countries
- South Africa
- Rest of the Middle East and Africa
Competitive Landscape
Competitive landscape includes Specialized Bicycle Components, Trek Bicycle, Giant Bicycles, Cannondale, Canyon Bicycles, BMC Switzerland, Merida Industry, Focus Bikes, Colnago, and Bianchi. Leading companies focus on lightweight carbon frames, aerodynamic designs, and integrated braking systems to enhance racing performance. Global brands continue to invest in sponsorships and professional cycling teams, which strengthen brand visibility and encourage adoption among amateur and professional users. Manufacturers emphasize research and material innovation, especially in carbon composites and advanced wheel systems, to support speed and handling advantages. Digital platforms help companies promote direct sales and customized configurations, improving premium revenue opportunities. Many players expand distribution partnerships with specialty retailers and online channels to reach diverse user groups, while selective localization strategies support competitive positioning across key regions.
Key Player Analysis
- Canyon Bicycles
- Specialized Bicycle Components
- Colnago
- Bianchi
- Trek Bicycle
- Merida Industry
- Focus Bikes
- Cannondale
- Giant Bicycles
- BMC Switzerland
Recent Developments
- In October 2025, Colnago launched a new track racing bike - the T1Rs, dubbed the fastest bike in Colnago’s range.
- In September 2025, Bianchi unveiled limited-edition “Founder’s Edition” versions of its top racing bikes - the Specialissima RC and Oltre RC - to mark its 140th anniversary.
- In July 2025, teams riding for the top pro tours used bikes from Canyon and Specialized as the most common brands at the Tour de France, showing these brands’ dominance in high-level road racing this season.
Report Coverage
The research report offers an in-depth analysis based on Type, Application, Distribution Channel, Frame Material and Geography. It details leading market players, providing an overview of their business, product offerings, investments, revenue streams, and key applications. Additionally, the report includes insights into the competitive environment, SWOT analysis, current market trends, as well as the primary drivers and constraints. Furthermore, it discusses various factors that have driven market expansion in recent years. The report also explores market dynamics, regulatory scenarios, and technological advancements that are shaping the industry. It assesses the impact of external factors and global economic changes on market growth. Lastly, it provides strategic recommendations for new entrants and established companies to navigate the complexities of the market.
Future Outlook
- Demand for aerodynamic frames will increase due to growing competition levels.
- Lightweight carbon components will expand across mid-premium ranges.
- Professional sponsorships will strengthen adoption among emerging racing teams.
- Fitness and endurance cycling will boost sales across urban markets.
- E-racing platforms will encourage digital engagement and product upgrades.
- Smart connectivity in drivetrains will support real-time performance feedback.
- Replacement cycles will shorten in premium racing and triathlon segments.
- Regional brands will expand through online retail and customization.
- Government cycling programs will raise participation in new regions.
- Continued material innovation will drive safety, speed, and long-distance performance.
Request a Free Sample
Fill in your details and we'll send you a free sample report.
- Sample data tables & charts
- Research methodology
Need a Custom Version of This Report?
Tailor the scope, geography, or segments to your exact requirements.
- Custom geography or segment scope
- Direct access to our analyst team
Frequently Asked Questions
What is the current market size for the Racing Bike market, and what is its projected size in 2032?
At what Compound Annual Growth Rate is the Racing Bike market projected to grow between 2024 and 2032?
Which Racing Bike market segment held the largest share in 2024?
What are the primary factors fueling the growth of the Racing Bike market?
Who are the leading companies in the Racing Bike market?
Which region commanded the largest share of the Racing Bike market in 2024?
Table of Content
Chapter 1. Report Introduction
- 1.1 Report Description & Purpose
- 1.1.1 Report Title & Market Definition
- 1.1.2 Unique Selling Propositions (USP) & Key Differentiators
- 1.1.3 Value Proposition for Stakeholders
- 1.2 Research Objectives
- 1.2.1 Market Sizing Objectives (Volume & Revenue)
- 1.2.2 Segmentation Objectives
- 1.2.3 Competitive Intelligence Objectives
- 1.2.4 Forecast & Scenario Objectives
- 1.3 Report Scope
- 1.3.1 Racing Bike Scope – Types & Subtypes Covered
- 1.3.2 Geographic Scope – Regions & Countries Covered
- 1.3.3 Historical Period, Base Year & Forecast Period (2024; forecast to 2032)
- 1.3.4 Inclusions & Exclusions
- 1.4 HS Code & Classification Framework
- 1.5 Currency, Units & Pricing Basis
- 1.6 Target Stakeholders
- 1.7 Limitations & Assumptions
Chapter 2. Executive Summary
- 2.1 Global Racing Bike Market Snapshot
- 2.1.1 Market Size – Historical (2024) & Forecast (2024-2032) (2024: USD 6,979.5 million → 2032: USD 8,841.42 million)
- 2.1.2 Volume & Revenue – Global Totals
- 2.1.3 Key Market Highlights – Top Five Facts
- 2.2 Racing Bike Market Segmentation Snapshot
- 2.2.1 Market Split by Region – 2024 vs. 2032
- 2.3 Competitive Snapshot
- 2.3.1 Top 10 Players by Revenue Share – 2024
- 2.3.2 Top 10 Players by Volume Share – 2024
- 2.3.3 Recent Strategic Developments (18-Month Summary)
- 2.4 Key Investment Highlights & Strategic Conclusions
Chapter 3. Racing Bike Market Dynamics & Industry Analysis
- 3.1 Market Overview & Context
- 3.1.1 Racing Bike Market Position in the Broader Automotive Value Chain
- 3.1.2 OEM vs. Replacement Market Dynamics
- 3.1.3 Market Maturity & Development Stage by Region
- 3.2 Racing Bike Market Drivers
- 3.3 Racing Bike Market Restraints & Challenges
- 3.4 Racing Bike Market Opportunities
- 3.5 Porter's Five Forces Analysis
- 3.5.1 Threat of New Entrants
- 3.5.2 Bargaining Power of Suppliers
- 3.5.3 Bargaining Power of Buyers
- 3.5.4 Threat of Substitutes
- 3.5.5 Competitive Rivalry – Intensity Assessment
- 3.6 Racing Bike Value Chain Analysis
- 3.6.1 Upstream – Raw Material/Input Suppliers
- 3.6.1.1 Raw Material/Input 1
- 3.6.1.2 Raw Material/Input 2
- 3.6.1.3 Raw Material/Input 3
- 3.6.2 Midstream – Production/Manufacturing/Service Delivery
- 3.6.2.1 Production/Process Overview
- 3.6.2.2 Key Facility Locations & Capacity by Manufacturer
- 3.6.3 Downstream – Distribution & End Consumer
- 3.6.3.1 Primary Channel – B2B/OEM
- 3.6.3.2 Secondary Channels – Dealer, Retail, Online, Direct
- 3.6.4 Value Chain Profitability Analysis
- 3.6.1 Upstream – Raw Material/Input Suppliers
- 3.7 PESTEL Analysis
- 3.7.1 Political Factors
- 3.7.2 Economic Factors
- 3.7.3 Social Factors
- 3.7.4 Technological Factors
- 3.7.5 Environmental Factors
- 3.7.6 Legal Factors
- 3.8 Racing Bike Supply Chain Analysis
- 3.8.1 Raw Material/Input Supply Risk Assessment
- 3.8.2 Manufacturing Concentration Risk (Geographic Exposure)
- 3.8.3 Trade Disruption Impact Analysis
- 3.9 Regulatory & Policy Landscape
Note: The regulatory and policy landscape section covers regulations based on their applicability to the market, Racing Bike category, geography, and scope of the study. Only regulatory frameworks with a material impact on operations, compliance, trade, sustainability, or market access are analyzed in detail.
Chapter 4. Key Investment Pockets & Opportunity Analysis
- 4.1 Racing Bike Market Attractiveness Analysis
- 4.1.1 By Region – Investment Attractiveness Matrix (Volume × CAGR)
- 4.2 Absolute Revenue Growth Opportunity
- 4.2.1 By Region – Absolute USD Growth Through 2032
- 4.3 Incremental Volume Opportunity
- 4.3.1 By Region – Incremental Volume Through 2032
- 4.3.2 Segment – Incremental Volume
- 4.4 Emerging Submarket Opportunity Deep Dive (Subject to Applicability)
- 4.5 Emerging Market Opportunity Scorecards
- 4.5.1 United States
- 4.5.2 Europe
- 4.5.3 Asia
- 4.5.4 Middle East & Africa
Note: Emerging Market Opportunity Scorecards will be included based on relevance and strategic importance. Regions listed are indicative and may vary depending on data availability and market dynamics.
Chapter 5. Racing Bike Import-Export Analysis & Trade Flows
- 5.1 Global Trade Overview
- 5.1.1 Global Export Value by Country (2024)
- 5.1.2 Global Export Volume by Country (2024)
- 5.1.3 Global Import Value by Country (2024)
- 5.1.4 Global Import Volume by Country (2024)
- 5.1.5 Net Trade Balance by Country (2024)
- 5.2 Export Analysis – Segment
- 5.2.1 Type 1 (HS Code)
- 5.2.2 Type 2 (HS Code)
- 5.2.3 Type 3 (HS Code)
- 5.2.4 Type 4 (HS Code)
- 5.2.5 Type 5 (HS Code)
- 5.3 Import Analysis – Segment
- 5.3.1 Type 1 (HS Code)
- 5.3.2 Type 2 (HS Code)
- 5.3.3 Type 3 (HS Code)
- 5.3.4 Type 4 (HS Code)
- 5.3.5 Type 5 (HS Code)
- 5.4 Average Unit Trade Prices
- 5.4.1 Average Export Price – Segment & Country
- 5.4.2 Average Import Price – Segment & Source Country
- 5.4.3 Price Trends (2024)
- 5.5 Key Trade Route Analysis
- 5.5.1 Trade Route 1
- 5.5.2 Trade Route 2
- 5.5.3 Trade Route 3
- 5.5.4 Trade Route 4
- 5.5.5 Trade Route 5
- 5.6 Trade Policy Impact Assessment
- 5.6.1 US Anti-Dumping & Section 301 Tariffs
- 5.6.2 EU Customs Union Impact
- 5.6.3 Major Free Trade Agreements
- 5.6.4 USMCA Rules of Origin
Note: Trade policy analysis will be included only where relevant to the Racing Bike market.
Chapter 6. Competitive Landscape & Company Benchmarking
- 6.1 Racing Bike Market Concentration & Structure
- 6.1.1 Herfindahl-Hirschman Index (HHI) – vs. 2024
- 6.1.2 Tier 1, Tier 2 & Tier 3 Market Structure
- 6.1.3 Global, Regional & Local Player Dynamics
- 6.2 Racing Bike Market Share Analysis – 2024
- 6.2.1 Global Revenue Share by Company
- 6.2.2 Global Volume Share by Company
- 6.2.3 Regional Revenue Share
- 6.2.4 Market Share Evolution ( vs. 2024)
- 6.2.5 OEM Segment Share by Company
- 6.2.6 Replacement Segment Share by Company
- 6.3 Production/Delivery Capacity & Facility Analysis
- 6.3.1 Global Installed Capacity
- 6.3.2 Capacity Utilization Rates
- 6.3.3 Production/Output Volume
- 6.3.4 Facility Locations & Capacity Map
- 6.3.5 Planned Capacity Additions
- 6.4 Racing Bike Competitive Benchmarking Matrix
- 6.4.1 Revenue, Volume, CAGR & Profitability Comparison
- 6.4.2 Channel Revenue Mix
- 6.4.3 Geographic Revenue Exposure
- 6.4.4 R&D Intensity
- 6.4.5 Sustainability Maturity
- 6.5 Strategic Developments in Racing Bike (Last 24 Months)
- 6.5.1 Mergers, Acquisitions & Divestments
- 6.5.2 New Racing Bike Launches
- 6.5.3 Facility Expansions
- 6.5.4 Strategic Alliances, Joint Ventures & Partnerships
- 6.5.5 Distribution Expansion & Market Entry
- 6.5.6 Sustainability & ESG Initiatives
- 6.6 Competitive Strategy Mapping
- 6.6.1 Leader, Challenger, Follower & Niche Classification
- 6.6.2 Pricing Strategy Comparison
- 6.6.3 Channel Strategy Matrix
Note: Strategic developments are included based on their materiality and the availability of reliable information.
Chapter 7. Global Racing Bike Market – By Distribution Channel
- 7.1 Segment Overview
- 7.1.1 Volume & Revenue Split by Channel (2024 & 2032)
- 7.1.2 Channel Mix Evolution (2024-2032)
Chapter 8. Regional Market Analysis – Global Overview
- 8.1 Global Regional Overview
- 8.1.1 Regional Volume Share
- 8.1.2 Regional Revenue Share
- 8.1.3 Regional Volume by Region
- 8.1.4 Regional Revenue by Region
- 8.1.5 Regional Forecast Through 2032
- 8.2 Cross-Regional Segment Analysis
- 8.2.1 By Distribution Channel
- 8.2.2 By Brand/Price Tier
Chapter 9. North America Racing Bike Market
- 9.1 United States
- 9.2 Canada
- 9.3 Mexico
Chapter 10. Europe Racing Bike Market
- 10.1 Germany
- 10.2 France
- 10.3 Italy
- 10.4 United Kingdom
- 10.5 Spain
- 10.6 Poland
- 10.7 Russia
- 10.8 Netherlands
- 10.9 Belgium
- 10.10 Sweden
- 10.11 Denmark
- 10.12 Norway
- 10.13 Rest of Europe
Chapter 11. Asia Pacific Racing Bike Market
- 11.1 China
- 11.2 India
- 11.3 Japan
- 11.4 South Korea
- 11.5 Thailand
- 11.6 Indonesia
- 11.7 Vietnam
- 11.8 Malaysia
- 11.9 Australia
- 11.10 Rest of Asia Pacific
Chapter 12. Latin America Racing Bike Market
- 12.1 Brazil
- 12.2 Argentina
- 12.3 Colombia
- 12.4 Chile
- 12.5 Rest of Latin America
Chapter 13. Middle East Racing Bike Market
- 13.1 Saudi Arabia
- 13.2 United Arab Emirates
- 13.3 Turkey
- 13.4 Israel
- 13.5 Iran
- 13.6 Rest of the Middle East
Chapter 14. Africa Racing Bike Market
- 14.1 South Africa
- 14.2 Egypt
- 14.3 Nigeria
- 14.4 Morocco
- 14.5 Rest of Africa
Chapter 15. Racing Bike Company Profiles
- 15.1 [Company 01]
- 15.1.1 Company Overview
- 15.1.2 Key Management Personnel
- 15.1.3 Products & Services Portfolio
- 15.1.4 Financial Performance
- 15.1.5 Key Market Focus & Geographic Presence
- 15.1.6 Recent Developments & Strategic Initiatives
Note: The company profile list is preliminary and may change based on research findings, market developments, data availability, and client requirements.
Chapter 16. Appendices
- Appendix A – List of Abbreviations & Acronyms
- Appendix B – Industry Classification Code Reference – Full Series
- Appendix C – Production & Capacity Data Tables
- Appendix D – End-Use & Demand Base Tables
- Appendix E – Consumption & Replacement Rate Assumptions
- Appendix F – ASP Reference Tables
- Appendix G – Manufacturing & Facility Database
- Appendix H – Import-Export Data Tables
- Appendix I – Regulatory Summary Tables
- Appendix J – Primary Research Participant List (Anonymized)
- Appendix K – Primary Research Questionnaire Framework
- Appendix L – Data Sources & Bibliography
- Appendix M – Market Size Divergence & Source Comparison
Chapter 17. Research Methodology
- 17.1 Research Framework & Philosophy
- 17.2 Secondary Research – Sources, Hierarchy & Data Extraction
- 17.3 Data Modeling – Bottom-Up & Top-Down Market Sizing
- 17.4 Primary Research – Stakeholder Framework, LOI & Sample Sizes
- 17.5 Forecast Methodology – Regression, Scenario & Sensitivity Analysis
- 17.6 Quality Control – Four-Layer Validation Framework
- 17.7 Limitations & Standard Assumptions
- 17.8 Disclaimer
