
Market Overview
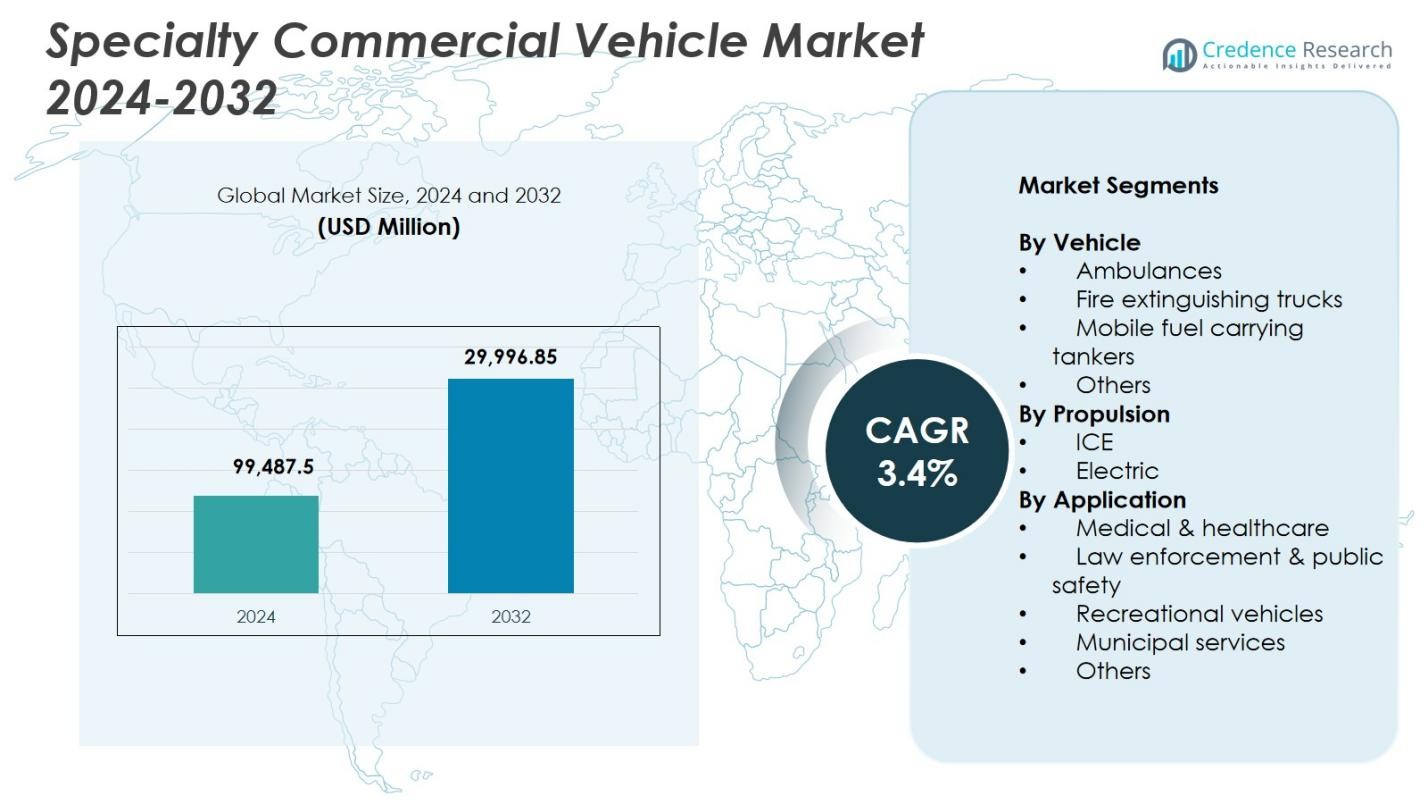
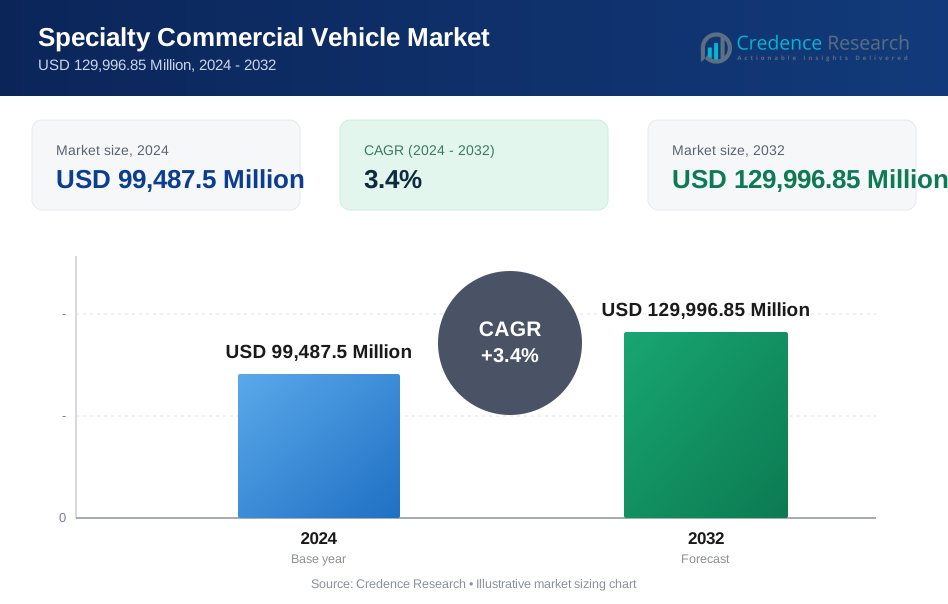
Specialty Commercial Vehicle Market size was valued at USD 99,487.5 Million in 2024 and is anticipated to reach USD 129,996.85 Million by 2032, at a CAGR of 3.4% during the forecast period.
| REPORT ATTRIBUTE | DETAILS |
|---|---|
| Historical Period | 2020-2023 |
| Base Year | 2024 |
| Forecast Period | 2025-2032 |
| Specialty Commercial Vehicle Market Size 2024 | USD 99,487.5 Million |
| Specialty Commercial Vehicle Market, CAGR | 3.4% |
| Specialty Commercial Vehicle Market Size 2032 | USD 129,996.85 Million |
Specialty Commercial Vehicle Market features key players such as REV Group, Oshkosh Corporation, Mercedes‑Benz Group, Farber Specialty Vehicles, Isuzu Motors, NFI Group, Traton SE, Volvo Group, LDV, and Pierce Manufacturing, each contributing to specialized applications across healthcare, public safety, municipal, and industrial sectors. These companies focus on advanced customization, durable platforms, and the integration of smart technologies to support evolving emergency and utility needs. Regionally, North America led the market with a 34.2% share in 2024, driven by strong investments in public safety fleets and mobile healthcare infrastructure, followed by Europe and Asia Pacific with robust adoption of electrified and application‑specific specialty vehicles.
Market Insights
- Specialty Commercial Vehicle Market was valued at USD 99,487.5 Million in 2024 and is projected to reach USD 129,996.85 Million by 2032, growing at a CAGR of 3.4%.
- Market growth is driven by expanding investments in emergency response systems, mobile healthcare services, and public safety infrastructure.
- A key trend is the increasing adoption of electric specialty vehicles, supported by emission regulations and government subsidies across developed regions.
- Leading players such as REV Group, Mercedes-Benz, Oshkosh, and Farber Specialty Vehicles are expanding their presence through customization, electrification, and smart fleet technologies.
- Infrastructure gaps for EV charging and high procurement costs remain major restraints, especially in price-sensitive and rural markets.
- North America led with 34.2% share in 2024, followed by Europe with 28.6% and Asia Pacific with 24.1%, while ambulances dominated by vehicle segment with 38.6% share.
Market Segmentation Analysis:
By Vehicle
In 2024, ambulances emerged as the dominant segment in the specialty commercial vehicle market, accounting for 38.6% of the total market share. The demand for ambulances is primarily driven by rising healthcare investments, growing emphasis on emergency medical response infrastructure, and government mandates on ambulance-to-population ratios. The COVID-19 pandemic further accelerated procurement in both public and private sectors. Additionally, the integration of telehealth equipment and mobile intensive care systems into ambulance designs has enhanced their utility, fueling adoption across emerging economies. Fire extinguishing trucks and mobile fuel tankers followed as key segments due to municipal and industrial deployment.
- For instance, Tata Motors launched the Tata Magic Express Ambulance 2100, powered by a 798 cc 4-stroke CRDi turbocharged engine delivering 44 HP and 110 Nm torque, with a mileage of 21.84 kmpl for efficient patient transport in urban and rural areas.
By Propulsion
ICE-powered vehicles held the leading share in 2024, commanding 78.3% of the market. Their dominance is attributed to mature technology, established fueling infrastructure, and heavy-duty performance reliability, especially for long-haul and emergency services. However, the electric segment is gaining traction, supported by government incentives, emission reduction goals, and improved battery range. Municipalities are gradually adopting electric platforms for low-emission zones, particularly in ambulances and light-duty specialty vans. Key OEMs are expanding electric offerings to align with decarbonization targets, suggesting a potential shift in share toward electric vehicles during the forecast period.
- For instance, London Ambulance Service deployed Ford E-Transit electric ambulances converted by WAS in 2024 for 12-hour frontline shifts, achieving up to 317 km range. These support zero-emission goals alongside ICE vehicles.
By Application
The medical & healthcare segment led the market in 2024, representing 42.7% of total demand. The dominance is largely attributed to expanding healthcare outreach, especially in rural areas, and increasing government focus on emergency medical transport systems. Rising chronic disease prevalence and growing demand for mobile diagnostic and treatment units are also boosting deployment. Law enforcement and public safety applications, including mobile command units and prisoner transport vehicles, held the second-largest share due to rising urban security budgets. Meanwhile, recreational and municipal services segments are growing steadily, driven by tourism recovery and smart city investments respectively.
Key Growth Drivers
Expansion of Emergency and Public Safety Infrastructure
Governments across developed and developing economies are significantly expanding investments in emergency response and public safety infrastructure, propelling the demand for specialty commercial vehicles. Increasing focus on public health readiness, disaster response capabilities, and urban safety is leading to large-scale procurement of ambulances, fire trucks, and command vehicles. This is particularly prominent in regions implementing universal healthcare access or overhauling outdated municipal fleets. Budget allocations for emergency preparedness and rising collaboration with private fleet operators further amplify demand, making this a critical growth pillar for the market.
- For instance, the Indian Institute of Science in Bangalore tendered for an Advanced Cardiac Life Support ambulance equipped for high-level emergency care during transport. The vehicle includes advanced medical equipment to bolster rapid response capabilities on campus.
Electrification and Emissions Regulation Compliance
The global shift toward low-emission mobility is driving specialty vehicle manufacturers to electrify their fleets. Regulatory frameworks such as the EU Green Deal, U.S. EPA emission standards, and China’s New Energy Vehicle (NEV) policy are pushing OEMs and public agencies to adopt electric specialty commercial vehicles. Applications such as urban ambulances, mobile clinics, and municipal service vehicles are ideal candidates for electrification due to their defined routes and limited daily range. This trend is incentivized by subsidies, tax rebates, and dedicated infrastructure plans, significantly accelerating electric vehicle adoption in this segment.
- For instance, Toyota developed the world's first fuel cell electric vehicle (FCEV) mobile clinic based on its Coaster minibus with the Mirai FCEV fuel cell system for the Japanese Red Cross Kumamoto Hospital in 2021.
Growth in Mobile Healthcare and Diagnostics
Rising healthcare outreach initiatives and demand for accessible diagnostic services are fueling the deployment of mobile healthcare units. Specialty vehicles equipped as mobile clinics, vaccination centers, and diagnostic labs are increasingly used in rural and underserved areas. Public health programs, non-profit organizations, and private diagnostic chains are investing in these mobile solutions to bridge healthcare access gaps. Additionally, post-pandemic demand for isolation units and mobile testing labs remains steady, driving customization and innovation in medical specialty vehicles. This segment continues to benefit from healthcare digitization and integrated telemedicine capabilities.
Key Trends & Opportunities
Integration of Smart Technologies and Telematics
The incorporation of advanced telematics, GPS tracking, and real-time diagnostic systems in specialty commercial vehicles is transforming operational efficiency. Municipal authorities, healthcare providers, and emergency services increasingly demand connected vehicle platforms that enable remote monitoring, fleet optimization, and predictive maintenance. AI-enabled routing for ambulances and live data feeds from fire trucks or hazardous material response units are gaining traction. These smart features not only reduce response times but also improve service quality and cost-efficiency. OEMs offering IoT-enabled solutions stand to capture significant opportunity in this evolving market landscape.
- For instance, Pierce Manufacturing integrated its Command Zone™ advanced electronics system with Wi-Fi diagnostics and remote monitoring features to streamline diagnostics and fleet readiness for fire departments.
Surge in Customization and Modular Configurations
Customer demand for highly specialized, modular vehicle configurations is rising, driven by the unique needs of different end-use sectors. Whether it's a mobile command center, vaccine refrigeration unit, or patient isolation pod, buyers now expect bespoke vehicle designs that can be adapted to specific missions. This has opened up opportunities for specialty body builders and upfitters to offer rapid, scalable, and cost-effective customization services. The trend is further accelerated by leasing models, where flexibility and rapid deployment capability are critical. Manufacturers offering tailored solutions are poised to gain competitive advantage.
- For instance, LDV builds mobile command centers on Freightliner MT-55 chassis with flat floor slide-outs and Intel-I-Touch™ automation for rapid deployment of satellite dishes, camera masts, and HVAC systems.
Key Challenges
High Capital Investment and Long Procurement Cycles
Specialty commercial vehicles often require complex design, certification, and customization processes, leading to high upfront costs and lengthy procurement timelines. Public sector tenders typically involve multi-stage bidding and budget approvals, while private buyers face financing constraints. The high capital intensity, coupled with long replacement cycles and limited resale value, makes it challenging for new market entrants or small fleet operators to invest. This challenge is particularly significant in low-income regions, where budget limitations slow adoption despite growing demand for specialized services.
Infrastructure Gaps for Electric Specialty Vehicles
While electrification offers long-term benefits, the lack of charging infrastructure and range limitations hinder the adoption of electric specialty commercial vehicles. Emergency and municipal services often require vehicles with reliable, uninterrupted operation something not always feasible with current battery technology. Moreover, fleet operators must invest in depot charging setups, grid upgrades, and technician training, adding to the transition cost. Inconsistent policy support and absence of standardized charging protocols across regions further complicate deployment. Addressing these infrastructure gaps remains crucial for unlocking the full potential of electric specialty fleets.
Regional Analysis
North America
North America led the specialty commercial vehicle market in 2024 with a market share of 34.2%, driven by strong demand from municipal services, healthcare, and emergency response sectors. The United States dominates the region, supported by well-funded public safety programs, frequent fleet renewals, and rapid adoption of smart fleet technologies. Significant investments in electrification of public service vehicles and expansion of mobile healthcare fleets further boost the market. Additionally, federal grants and urban resilience initiatives support growth across both urban and rural areas. Canada contributes steadily, particularly in fire safety and utility vehicle segments.
Europe
Europe held the second-largest share in the specialty commercial vehicle market in 2024, accounting for 28.6%. The region benefits from stringent emissions regulations, robust public sector procurement frameworks, and mature vehicle upfitting ecosystems. Countries such as Germany, France, and the UK are investing heavily in zero-emission ambulances, fire engines, and police vehicles under climate and sustainability mandates. EU funding programs and circular economy policies are also fostering fleet electrification and retrofitting. Moreover, high demand for customized medical and diagnostic vehicles in Eastern Europe is adding to regional momentum, supported by healthcare modernization initiatives.
Asia Pacific
Asia Pacific accounted for 24.1% of the specialty commercial vehicle market in 2024, led by rising urbanization, public infrastructure upgrades, and healthcare accessibility programs. China and India are key growth engines, with large-scale investments in emergency response systems, mobile clinics, and firefighting fleets. The Make in India and Smart Cities missions have catalyzed vehicle procurement, while China's New Energy Vehicle push is supporting electric specialty fleet deployments. Southeast Asia and Australia are also witnessing increased adoption in municipal services and tourism-based specialty vehicles, driving diversified demand across the region’s varied economies.
Latin America
Latin America represented a smaller but growing share of 7.5% in 2024, supported by public safety modernization and healthcare outreach in underserved areas. Brazil and Mexico lead in terms of market size, investing in ambulance fleets, fire trucks, and mobile diagnostic vehicles. Economic recovery post-COVID and regional cooperation on emergency preparedness have stimulated vehicle procurement by both government and non-profit organizations. Challenges related to funding and supply chain reliability persist, but increasing collaborations with international manufacturers and donor-backed health initiatives are helping the market expand steadily across the region.
Middle East & Africa
The Middle East & Africa captured 5.6% of the global specialty commercial vehicle market in 2024, driven by infrastructure development, disaster preparedness efforts, and growing public health investments. The Gulf Cooperation Council (GCC) countries, especially Saudi Arabia and the UAE, are major contributors due to strong investments in smart cities, defense, and emergency vehicle fleets. In Africa, demand is primarily supported by humanitarian and healthcare programs facilitated by international aid and NGOs, particularly in sub-Saharan regions. The market is steadily advancing, with growing interest in mobile medical and utility vehicles amid improving economic conditions.
Market Segmentations:
By Vehicle
- Ambulances
- Fire extinguishing trucks
- Mobile fuel carrying tankers
- Others
By Propulsion
- ICE
- Electric
By Application
- Medical & healthcare
- Law enforcement & public safety
- Recreational vehicles
- Municipal services
- Others
By Geography
- North America
- U.S.
- Canada
- Mexico
- Europe
- Germany
- France
- U.K.
- Italy
- Spain
- Rest of Europe
- Asia Pacific
- China
- Japan
- India
- South Korea
- South-east Asia
- Rest of Asia Pacific
- Latin America
- Brazil
- Argentina
- Rest of Latin America
- Middle East & Africa
- GCC Countries
- South Africa
- Rest of the Middle East and Africa
Competitive Landscape
The competitive landscape of the specialty commercial vehicle market features prominent players such as REV Group, Oshkosh Corporation, Mercedes-Benz Group AG, Farber Specialty Vehicles, Isuzu Motors, NFI Group, Traton SE, LDV Inc., Volvo Group, and Pierce Manufacturing. These companies focus on delivering highly customized vehicles for sectors such as emergency response, healthcare, municipal services, and law enforcement. REV Group and Pierce lead in the fire and rescue segment, while Farber Specialty Vehicles specializes in mobile medical units and diagnostic vans. Mercedes-Benz and Volvo offer robust platforms with high safety and performance standards, often chosen for ambulance and police van configurations. Traton and NFI contribute to the electrification of public service fleets, introducing zero-emission specialty buses and utility vehicles. Competitive differentiation is driven by technological integration, product modularity, service networks, and fleet electrification capabilities. Strategic collaborations with local upfitters, public procurement agencies, and health organizations continue to shape market positioning and regional penetration strategies.
Key Player Analysis
Recent Developments
- In November 2025, Horton Emergency Vehicles part of REV announced a manufacturing expansion in Grove City, Ohio, with a USD 2.6 million investment to increase capacity and speed up ambulance deliveries.
- In July 2025, Pierce Manufacturing Inc., an Oshkosh Corporation business, delivered the first Pierce Volterra electric pumper to Cary Fire Department in North Carolina, marking the initial fully operational electric fire truck on the U.S. East Coast.
- In December 2025, Daimler India Commercial Vehicles launched the BharatBenz BB1924, a 19.5-ton heavy-duty bus designed for intercity passenger transport in India.
Report Coverage
The research report offers an in-depth analysis based on Vehicle, Propulsion, Application and Geography. It details leading market players, providing an overview of their business, product offerings, investments, revenue streams, and key applications. Additionally, the report includes insights into the competitive environment, SWOT analysis, current market trends, as well as the primary drivers and constraints. Furthermore, it discusses various factors that have driven market expansion in recent years. The report also explores market dynamics, regulatory scenarios, and technological advancements that are shaping the industry. It assesses the impact of external factors and global economic changes on market growth. Lastly, it provides strategic recommendations for new entrants and established companies to navigate the complexities of the market.
Future Outlook
- Demand for ambulances and mobile medical units will continue to grow due to rising healthcare outreach programs.
- Adoption of electric specialty vehicles will accelerate, driven by emission regulations and urban fleet electrification targets.
- Integration of telematics and AI-powered fleet management systems will enhance operational efficiency.
- Custom-built and modular vehicle configurations will gain popularity across healthcare and public safety sectors.
- Government investments in emergency response and disaster preparedness will boost market growth.
- Public-private partnerships will expand to support procurement and deployment of specialty vehicles in rural areas.
- Lightweight materials and smart interiors will become key design trends for improved fuel efficiency and utility.
- Vehicle manufacturers will increase collaboration with software providers for smart vehicle applications.
- Aftermarket services and vehicle refurbishment markets will gain traction due to budget-conscious public buyers.
- Emerging markets in Asia and Africa will experience rapid growth as infrastructure and health systems expand.
Request a Free Sample
Fill in your details and we'll send you a free sample report.
- Sample data tables & charts
- Research methodology
Need a Custom Version of This Report?
Tailor the scope, geography, or segments to your exact requirements.
- Custom geography or segment scope
- Direct access to our analyst team
Frequently Asked Questions
What is the current market size for Specialty Commercial Vehicle Market, and what is its projected size in 2032?
At what Compound Annual Growth Rate is the Specialty Commercial Vehicle Market projected to grow between 2024 and 2032?
Which Specialty Commercial Vehicle Market segment held the largest share in 2024?
What are the primary factors fueling the growth of the Specialty Commercial Vehicle Market?
Who are the leading companies in the Specialty Commercial Vehicle Market?
Which region commanded the largest share of the Specialty Commercial Vehicle Market in 2024?
Table of Content
Chapter 1. Report Introduction
- 1.1 Report Description & Purpose
- 1.1.1 Report Title & Market Definition
- 1.1.2 Unique Selling Propositions (USP) & Key Differentiators
- 1.1.3 Value Proposition for Stakeholders
- 1.2 Research Objectives
- 1.2.1 Market Sizing Objectives (Volume & Revenue)
- 1.2.2 Segmentation Objectives
- 1.2.3 Competitive Intelligence Objectives
- 1.2.4 Forecast & Scenario Objectives
- 1.3 Report Scope
- 1.3.1 Specialty Commercial Vehicle Scope – Types & Subtypes Covered
- 1.3.2 Geographic Scope – Regions & Countries Covered
- 1.3.3 Historical Period, Base Year & Forecast Period (2024; forecast to 2032)
- 1.3.4 Inclusions & Exclusions
- 1.4 HS Code & Classification Framework
- 1.5 Currency, Units & Pricing Basis
- 1.6 Target Stakeholders
- 1.7 Limitations & Assumptions
Chapter 2. Executive Summary
- 2.1 Global Specialty Commercial Vehicle Market Snapshot
- 2.1.1 Market Size – Historical (2024) & Forecast (2024-2032) (2024: USD 99,487.5 Million → 2032: USD 129,996.85 Million)
- 2.1.2 Volume & Revenue – Global Totals
- 2.1.3 Key Market Highlights – Top Five Facts
- 2.2 Specialty Commercial Vehicle Market Segmentation Snapshot
- 2.2.1 Market Split by Region – 2024 vs. 2032
- 2.3 Competitive Snapshot
- 2.3.1 Top 10 Players by Revenue Share – 2024
- 2.3.2 Top 10 Players by Volume Share – 2024
- 2.3.3 Recent Strategic Developments (18-Month Summary)
- 2.4 Key Investment Highlights & Strategic Conclusions
Chapter 3. Specialty Commercial Vehicle Market Dynamics & Industry Analysis
- 3.1 Market Overview & Context
- 3.1.1 Specialty Commercial Vehicle Market Position in the Broader Automotive Value Chain
- 3.1.2 OEM vs. Replacement Market Dynamics
- 3.1.3 Market Maturity & Development Stage by Region
- 3.2 Specialty Commercial Vehicle Market Drivers
- 3.3 Specialty Commercial Vehicle Market Restraints & Challenges
- 3.4 Specialty Commercial Vehicle Market Opportunities
- 3.5 Porter's Five Forces Analysis
- 3.5.1 Threat of New Entrants
- 3.5.2 Bargaining Power of Suppliers
- 3.5.3 Bargaining Power of Buyers
- 3.5.4 Threat of Substitutes
- 3.5.5 Competitive Rivalry – Intensity Assessment
- 3.6 Specialty Commercial Vehicle Value Chain Analysis
- 3.6.1 Upstream – Raw Material/Input Suppliers
- 3.6.1.1 Raw Material/Input 1
- 3.6.1.2 Raw Material/Input 2
- 3.6.1.3 Raw Material/Input 3
- 3.6.2 Midstream – Production/Manufacturing/Service Delivery
- 3.6.2.1 Production/Process Overview
- 3.6.2.2 Key Facility Locations & Capacity by Manufacturer
- 3.6.3 Downstream – Distribution & End Consumer
- 3.6.3.1 Primary Channel – B2B/OEM
- 3.6.3.2 Secondary Channels – Dealer, Retail, Online, Direct
- 3.6.4 Value Chain Profitability Analysis
- 3.6.1 Upstream – Raw Material/Input Suppliers
- 3.7 PESTEL Analysis
- 3.7.1 Political Factors
- 3.7.2 Economic Factors
- 3.7.3 Social Factors
- 3.7.4 Technological Factors
- 3.7.5 Environmental Factors
- 3.7.6 Legal Factors
- 3.8 Specialty Commercial Vehicle Supply Chain Analysis
- 3.8.1 Raw Material/Input Supply Risk Assessment
- 3.8.2 Manufacturing Concentration Risk (Geographic Exposure)
- 3.8.3 Trade Disruption Impact Analysis
- 3.9 Regulatory & Policy Landscape
Note: The regulatory and policy landscape section covers regulations based on their applicability to the market, Specialty Commercial Vehicle category, geography, and scope of the study. Only regulatory frameworks with a material impact on operations, compliance, trade, sustainability, or market access are analyzed in detail.
Chapter 4. Key Investment Pockets & Opportunity Analysis
- 4.1 Specialty Commercial Vehicle Market Attractiveness Analysis
- 4.1.1 By Region – Investment Attractiveness Matrix (Volume × CAGR)
- 4.2 Absolute Revenue Growth Opportunity
- 4.2.1 By Region – Absolute USD Growth Through 2032
- 4.3 Incremental Volume Opportunity
- 4.3.1 By Region – Incremental Volume Through 2032
- 4.3.2 Segment – Incremental Volume
- 4.4 Emerging Submarket Opportunity Deep Dive (Subject to Applicability)
- 4.5 Emerging Market Opportunity Scorecards
- 4.5.1 United States
- 4.5.2 Europe
- 4.5.3 Asia
- 4.5.4 Middle East & Africa
Note: Emerging Market Opportunity Scorecards will be included based on relevance and strategic importance. Regions listed are indicative and may vary depending on data availability and market dynamics.
Chapter 5. Specialty Commercial Vehicle Import-Export Analysis & Trade Flows
- 5.1 Global Trade Overview
- 5.1.1 Global Export Value by Country (2024)
- 5.1.2 Global Export Volume by Country (2024)
- 5.1.3 Global Import Value by Country (2024)
- 5.1.4 Global Import Volume by Country (2024)
- 5.1.5 Net Trade Balance by Country (2024)
- 5.2 Export Analysis – Segment
- 5.2.1 Type 1 (HS Code)
- 5.2.2 Type 2 (HS Code)
- 5.2.3 Type 3 (HS Code)
- 5.2.4 Type 4 (HS Code)
- 5.2.5 Type 5 (HS Code)
- 5.3 Import Analysis – Segment
- 5.3.1 Type 1 (HS Code)
- 5.3.2 Type 2 (HS Code)
- 5.3.3 Type 3 (HS Code)
- 5.3.4 Type 4 (HS Code)
- 5.3.5 Type 5 (HS Code)
- 5.4 Average Unit Trade Prices
- 5.4.1 Average Export Price – Segment & Country
- 5.4.2 Average Import Price – Segment & Source Country
- 5.4.3 Price Trends (2024)
- 5.5 Key Trade Route Analysis
- 5.5.1 Trade Route 1
- 5.5.2 Trade Route 2
- 5.5.3 Trade Route 3
- 5.5.4 Trade Route 4
- 5.5.5 Trade Route 5
- 5.6 Trade Policy Impact Assessment
- 5.6.1 US Anti-Dumping & Section 301 Tariffs
- 5.6.2 EU Customs Union Impact
- 5.6.3 Major Free Trade Agreements
- 5.6.4 USMCA Rules of Origin
Note: Trade policy analysis will be included only where relevant to the Specialty Commercial Vehicle market.
Chapter 6. Competitive Landscape & Company Benchmarking
- 6.1 Specialty Commercial Vehicle Market Concentration & Structure
- 6.1.1 Herfindahl-Hirschman Index (HHI) – vs. 2024
- 6.1.2 Tier 1, Tier 2 & Tier 3 Market Structure
- 6.1.3 Global, Regional & Local Player Dynamics
- 6.2 Specialty Commercial Vehicle Market Share Analysis – 2024
- 6.2.1 Global Revenue Share by Company
- 6.2.2 Global Volume Share by Company
- 6.2.3 Regional Revenue Share
- 6.2.4 Market Share Evolution ( vs. 2024)
- 6.2.5 OEM Segment Share by Company
- 6.2.6 Replacement Segment Share by Company
- 6.3 Production/Delivery Capacity & Facility Analysis
- 6.3.1 Global Installed Capacity
- 6.3.2 Capacity Utilization Rates
- 6.3.3 Production/Output Volume
- 6.3.4 Facility Locations & Capacity Map
- 6.3.5 Planned Capacity Additions
- 6.4 Specialty Commercial Vehicle Competitive Benchmarking Matrix
- 6.4.1 Revenue, Volume, CAGR & Profitability Comparison
- 6.4.2 Channel Revenue Mix
- 6.4.3 Geographic Revenue Exposure
- 6.4.4 R&D Intensity
- 6.4.5 Sustainability Maturity
- 6.5 Strategic Developments in Specialty Commercial Vehicle (Last 24 Months)
- 6.5.1 Mergers, Acquisitions & Divestments
- 6.5.2 New Specialty Commercial Vehicle Launches
- 6.5.3 Facility Expansions
- 6.5.4 Strategic Alliances, Joint Ventures & Partnerships
- 6.5.5 Distribution Expansion & Market Entry
- 6.5.6 Sustainability & ESG Initiatives
- 6.6 Competitive Strategy Mapping
- 6.6.1 Leader, Challenger, Follower & Niche Classification
- 6.6.2 Pricing Strategy Comparison
- 6.6.3 Channel Strategy Matrix
Note: Strategic developments are included based on their materiality and the availability of reliable information.
Chapter 7. Global Specialty Commercial Vehicle Market – By Distribution Channel
- 7.1 Segment Overview
- 7.1.1 Volume & Revenue Split by Channel (2024 & 2032)
- 7.1.2 Channel Mix Evolution (2024-2032)
Chapter 8. Regional Market Analysis – Global Overview
- 8.1 Global Regional Overview
- 8.1.1 Regional Volume Share
- 8.1.2 Regional Revenue Share
- 8.1.3 Regional Volume by Region
- 8.1.4 Regional Revenue by Region
- 8.1.5 Regional Forecast Through 2032
- 8.2 Cross-Regional Segment Analysis
- 8.2.1 By Distribution Channel
- 8.2.2 By Brand/Price Tier
Chapter 9. North America Specialty Commercial Vehicle Market
- 9.1 United States
- 9.2 Canada
- 9.3 Mexico
Chapter 10. Europe Specialty Commercial Vehicle Market
- 10.1 Germany
- 10.2 France
- 10.3 Italy
- 10.4 United Kingdom
- 10.5 Spain
- 10.6 Poland
- 10.7 Russia
- 10.8 Netherlands
- 10.9 Belgium
- 10.10 Sweden
- 10.11 Denmark
- 10.12 Norway
- 10.13 Rest of Europe
Chapter 11. Asia Pacific Specialty Commercial Vehicle Market
- 11.1 China
- 11.2 India
- 11.3 Japan
- 11.4 South Korea
- 11.5 Thailand
- 11.6 Indonesia
- 11.7 Vietnam
- 11.8 Malaysia
- 11.9 Australia
- 11.10 Rest of Asia Pacific
Chapter 12. Latin America Specialty Commercial Vehicle Market
- 12.1 Brazil
- 12.2 Argentina
- 12.3 Colombia
- 12.4 Chile
- 12.5 Rest of Latin America
Chapter 13. Middle East Specialty Commercial Vehicle Market
- 13.1 Saudi Arabia
- 13.2 United Arab Emirates
- 13.3 Turkey
- 13.4 Israel
- 13.5 Iran
- 13.6 Rest of the Middle East
Chapter 14. Africa Specialty Commercial Vehicle Market
- 14.1 South Africa
- 14.2 Egypt
- 14.3 Nigeria
- 14.4 Morocco
- 14.5 Rest of Africa
Chapter 15. Specialty Commercial Vehicle Company Profiles
- 15.1 [Company 01]
- 15.1.1 Company Overview
- 15.1.2 Key Management Personnel
- 15.1.3 Products & Services Portfolio
- 15.1.4 Financial Performance
- 15.1.5 Key Market Focus & Geographic Presence
- 15.1.6 Recent Developments & Strategic Initiatives
Note: The company profile list is preliminary and may change based on research findings, market developments, data availability, and client requirements.
Chapter 16. Appendices
- Appendix A – List of Abbreviations & Acronyms
- Appendix B – Industry Classification Code Reference – Full Series
- Appendix C – Production & Capacity Data Tables
- Appendix D – End-Use & Demand Base Tables
- Appendix E – Consumption & Replacement Rate Assumptions
- Appendix F – ASP Reference Tables
- Appendix G – Manufacturing & Facility Database
- Appendix H – Import-Export Data Tables
- Appendix I – Regulatory Summary Tables
- Appendix J – Primary Research Participant List (Anonymized)
- Appendix K – Primary Research Questionnaire Framework
- Appendix L – Data Sources & Bibliography
- Appendix M – Market Size Divergence & Source Comparison
Chapter 17. Research Methodology
- 17.1 Research Framework & Philosophy
- 17.2 Secondary Research – Sources, Hierarchy & Data Extraction
- 17.3 Data Modeling – Bottom-Up & Top-Down Market Sizing
- 17.4 Primary Research – Stakeholder Framework, LOI & Sample Sizes
- 17.5 Forecast Methodology – Regression, Scenario & Sensitivity Analysis
- 17.6 Quality Control – Four-Layer Validation Framework
- 17.7 Limitations & Standard Assumptions
- 17.8 Disclaimer
