
Market Overviews
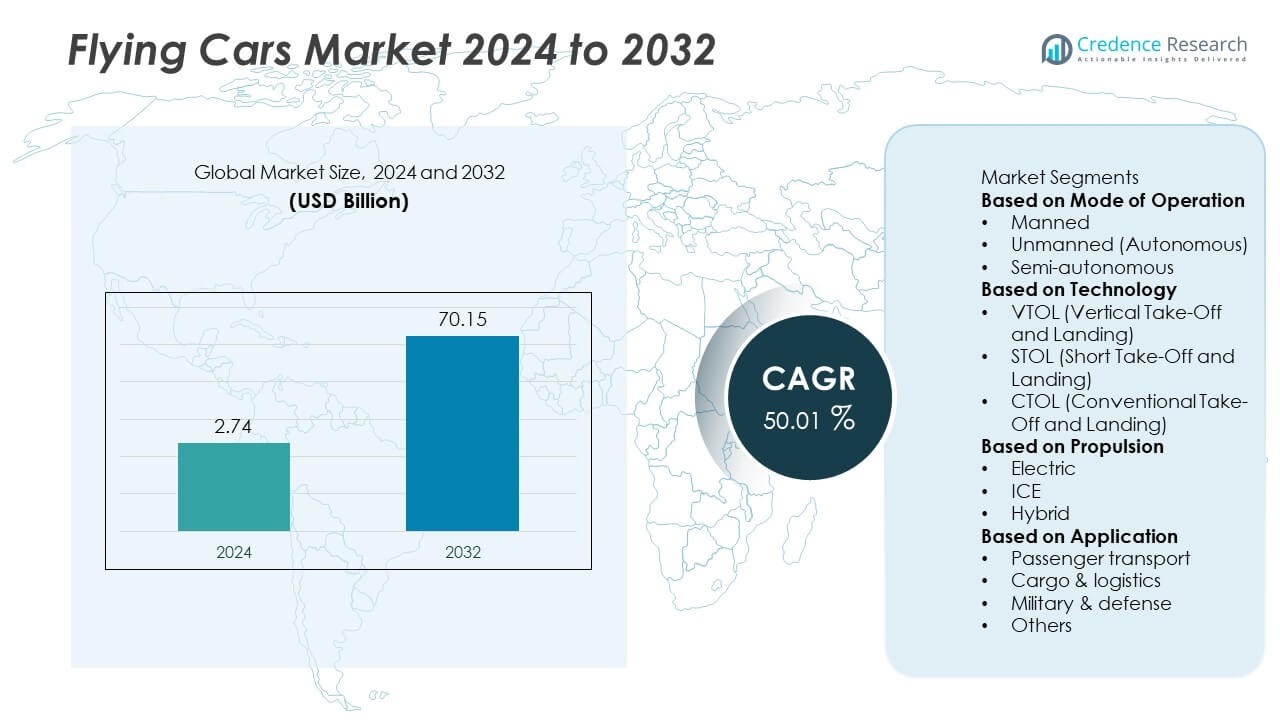
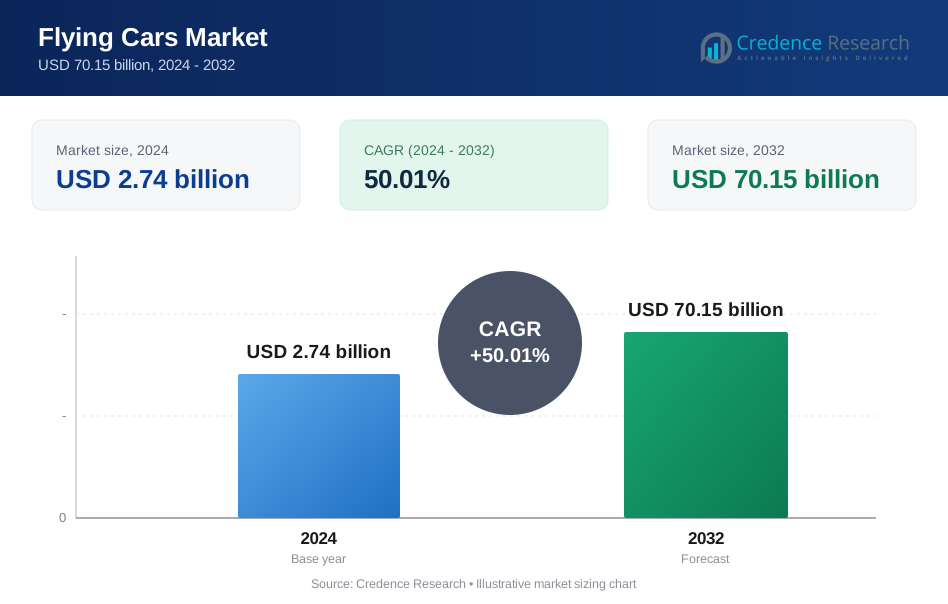
The Flying Cars Market was valued at USD 2.74 billion in 2024 and is projected to reach USD 70.15 billion by 2032, growing at an impressive CAGR of 50.01% during the forecast period.
| REPORT ATTRIBUTE | DETAILS |
|---|---|
| Historical Period | 2020-2023 |
| Base Year | 2024 |
| Forecast Period | 2025-2032 |
| Flying Cars Market Size 2024 | USD 2.74 Billion |
| Flying Cars Market, CAGR | 50.01% |
| Flying Cars Market Size 2032 | USD 70.15 Billion |
The flying cars market is led by major companies including PAL-V International, Archer Aviation, Airbus, SkyDrive, UBER, Terrafugia, Moller, AeroMobil, Joby Aviation, and Boeing. These companies are driving innovation through electric propulsion systems, autonomous flight technology, and hybrid air mobility designs. North America emerged as the leading region with a 41% market share in 2024, driven by advanced R&D initiatives, strong regulatory support, and large-scale pilot programs. Europe followed with a 29% share, supported by sustainability-driven policies and technological collaborations, while Asia-Pacific accounted for 23%, fueled by rapid urbanization, government investments in smart city infrastructure, and growing public-private partnerships in next-generation air mobility solutions.
Market Insights
- The flying cars market was valued at USD 2.74 billion in 2024 and is projected to reach USD 70.15 billion by 2032, registering a CAGR of 50.01% during the forecast period.
- Growing urban congestion, advancements in electric propulsion, and strong investments in air mobility infrastructure are driving rapid market growth worldwide.
- The market is witnessing strong trends in autonomous flight systems, AI-based navigation, and sustainable eVTOL technologies enhancing safety and performance.
- Key players such as PAL-V International, Airbus, Joby Aviation, and Archer Aviation are focusing on partnerships, prototype launches, and certification to strengthen global presence.
- North America held a 41% market share in 2024, followed by Europe with 29% and Asia-Pacific with 23%; by technology, the VTOL segment led with a 58% share, highlighting growing preference for vertical take-off designs suited for dense urban environments.
Market Segmentation Analysis:
By Mode of Operation
The segment dominated the flying cars market in 2024, holding a 46% share. This segment’s leadership is driven by advancements in AI-based navigation, autonomous flight control, and collision avoidance systems. Autonomous flying cars offer enhanced safety, efficiency, and reduced pilot dependency, making them ideal for urban air mobility. Growing investment by tech and aerospace companies in autonomous aerial platforms further supports demand. The increasing acceptance of driverless technologies across transportation industries is accelerating commercialization and regulatory approval for fully autonomous air mobility systems.
- For instance, Joby Aviation has demonstrated autonomous flight technology through partnerships with the U.S. military and has conducted flight testing in collaboration with NASA. The company acquired the autonomy division of Xwing, which developed the "Superpilot" autonomous flight system.
By Technology
The VTOL (Vertical Take-Off and Landing) segment led the market in 2024 with a 58% share, attributed to its flexibility and suitability for congested urban environments. VTOL vehicles eliminate the need for runways, allowing vertical lift and landing from compact areas, making them ideal for intra-city transport. Manufacturers are heavily investing in electric VTOL prototypes powered by distributed propulsion systems to enhance stability and efficiency. The rise of air taxi services and infrastructure development for vertiports across major cities are major factors driving the widespread adoption of VTOL technology.
- For instance, Archer Aviation's Midnight eVTOL features twelve independent electric propellers, achieved a piloted flight covering approximately 55 miles at speeds exceeding 203 kilometers per hour at its California test facility, and has completed its first transition flight.
By Propulsion
The electric propulsion segment accounted for a 54% share of the global flying cars market in 2024, fueled by growing emphasis on sustainability and reduced emissions. Electric flying cars offer quieter operations, lower maintenance costs, and improved energy efficiency compared to internal combustion engines. Government incentives for electric mobility and advancements in high-density battery technology are accelerating adoption. Leading companies are developing next-generation electric powertrains and fast-charging systems to extend range and performance. The global shift toward zero-emission aviation continues to position electric propulsion as the future standard for flying cars.
Key Growth Drivers
Advancements in Electric and Hybrid Propulsion Systems
Rapid improvements in battery energy density and electric propulsion technology are driving the flying cars market forward. Electric and hybrid powertrains reduce emissions, lower maintenance costs, and enhance efficiency. Manufacturers are investing heavily in lightweight materials and high-performance batteries to extend flight range and reduce operational costs. These innovations align with global sustainability goals and urban air mobility initiatives. The transition toward clean energy aviation is accelerating development, positioning electric flying cars as the future of short-distance transportation.
- For instance, Airbus has conducted flight tests of its all-electric CityAirbus NextGen prototype at its Donauwörth facility. The aircraft, which has eight electric propellers and a cruise speed of 120 km/h, is designed to have an operational range of 80 km.
Growing Urbanization and Traffic Congestion Solutions
Increasing urban congestion and limited ground infrastructure are key factors fueling the adoption of flying cars. Urban air mobility offers faster, more efficient travel options, reducing commute times in major metropolitan areas. Governments and private companies are collaborating to develop aerial corridors and vertiport networks to enable safe operations. The rising need for smart, space-efficient transportation systems is prompting investment in flying car projects, particularly in regions such as North America, Europe, and Asia-Pacific where urban populations are expanding rapidly.
- For instance, SkyDrive partnered with Japan's Ministry of Land, Infrastructure, Transport and Tourism to obtain certification for its SD-05 eVTOL aircraft and conduct demonstration flights at the Osaka Expo in 2025.
Rising Investments and Strategic Partnerships
Massive funding from automotive, aerospace, and technology firms is accelerating product development and commercialization. Collaborations between companies such as Hyundai, Joby Aviation, and Airbus are helping advance design, safety standards, and mass production capabilities. Governments are also supporting prototype testing and certification programs for electric vertical take-off and landing (eVTOL) vehicles. These partnerships are not only boosting innovation but also ensuring faster integration of flying cars into existing mobility ecosystems, paving the way for commercial launches within the decade.
Key Trends and Opportunities
Integration of AI and Autonomous Flight Technology
The adoption of artificial intelligence and machine learning is transforming the capabilities of flying cars. AI enables precise navigation, route optimization, and obstacle detection, improving safety and reliability. Autonomous flight systems are reducing human error, paving the way for fully automated air taxis. Companies are developing advanced air traffic management solutions to handle autonomous vehicle coordination. This integration presents significant opportunities for urban mobility platforms and investors in smart aviation infrastructure.
- For instance, Joby Aviation leveraged its Superpilot autonomy software to conduct over 7,000 miles of uncrewed flights across 40 hours during a U.S. Department of Defense exercise, validating gate-to-gate autonomous flight in complex airspace.
Development of Urban Air Mobility Infrastructure
The expansion of vertiports, charging stations, and digital air traffic systems is creating new opportunities in the flying car ecosystem. Governments and private firms are collaborating to establish infrastructure that supports regular flying car operations. Integration with smart cities and digital communication networks enhances safety and efficiency. As pilot programs and urban mobility trials progress, infrastructure development will remain critical in shaping the long-term commercial viability of flying cars.
- For instance, Uber Elevate has designed a modular Skyport concept able to support vertical takeoff and landing traffic of up to 1,000 aircraft per hour, using retrofitted parking decks or helipad rooftops as infrastructure nodes.
Sustainability and Zero-Emission Initiatives
Environmental concerns are pushing manufacturers to design eco-friendly flying vehicles. Companies are focusing on electric and hydrogen-powered models to minimize carbon footprints. These developments align with international emission reduction goals and promote long-term sustainability. The shift toward zero-emission air mobility creates opportunities for green technology providers, material innovators, and investors focused on sustainable aviation solutions.
Key Challenges
High Development and Operational Costs
The high cost of research, development, and certification remains a major obstacle to widespread adoption. Flying cars require advanced propulsion systems, robust materials, and regulatory compliance testing, all of which increase production expenses. Additionally, building supporting infrastructure like vertiports and charging networks demands significant investment. These factors make flying cars less accessible for the mass market. Achieving cost efficiency through economies of scale and technological advancement is essential for commercial success.
Regulatory and Safety Concerns
Strict aviation regulations and safety certifications present major challenges to market growth. Governments are still developing frameworks for air traffic management, pilot licensing, and autonomous flight approval. Concerns around mid-air collisions, noise pollution, and urban flight paths delay commercialization. Manufacturers must meet stringent safety standards while ensuring cost-effective production. Collaboration between aviation authorities and industry players is crucial to establish globally accepted regulations for safe and efficient urban air operations.
Regional Analysis
North America
North America dominated the flying cars market in 2024 with a 41% share, driven by strong technological innovation, robust funding, and supportive government policies for urban air mobility. The United States leads the region with active projects from companies like Joby Aviation, Archer Aviation, and Boeing. High adoption potential for electric vertical take-off and landing (eVTOL) vehicles and extensive testing of autonomous air systems further strengthen the region’s position. Favorable regulatory initiatives by the Federal Aviation Administration (FAA) and growing partnerships between automotive and aerospace firms continue to accelerate commercialization across key U.S. cities.
Europe
Europe accounted for a 29% share of the global flying cars market in 2024, supported by progressive regulatory frameworks and increasing investments in air mobility infrastructure. Countries such as Germany, the United Kingdom, and France are leading innovation through collaborations among aviation startups and automotive giants. The European Union Aviation Safety Agency (EASA) is developing certification standards for eVTOL vehicles, boosting industry confidence. Sustainable transportation goals and pilot programs for urban air taxis are expanding across major cities, positioning Europe as a frontrunner in green air transport adoption.
Asia-Pacific
Asia-Pacific captured a 23% market share in 2024, emerging as a rapidly expanding region due to strong government initiatives and growing urban populations. Countries like Japan, China, and South Korea are investing heavily in flying car development and smart city integration. Japan’s national roadmap for air mobility and China’s progress with companies like XPeng AeroHT highlight the region’s commitment to commercialization. Rising disposable incomes, dense urbanization, and technological readiness support demand. Regional governments are also encouraging local manufacturing and public-private partnerships to enhance air traffic safety and operational scalability.
Latin America
Latin America held a 4% share of the global flying cars market in 2024. Growth in this region is fueled by expanding urbanization and increasing interest in sustainable mobility. Countries like Brazil and Mexico are investing in aviation infrastructure and exploring aerial transportation to address congested cities. Regional collaborations with global players are enabling early-stage testing and prototype development. Although regulatory and cost barriers remain, improving economic conditions and government-led innovation initiatives are expected to create new opportunities for air mobility adoption in the coming years.
Middle East & Africa
The Middle East & Africa region accounted for a 3% share of the global flying cars market in 2024, with rising interest in advanced transportation solutions and tourism-driven aerial mobility. The UAE leads the region with Dubai’s smart city initiatives and partnerships with eVTOL developers for urban flight operations. Saudi Arabia is investing in futuristic transport infrastructure under Vision 2030. Africa shows potential through early-stage pilot projects focused on logistics and passenger transport. Despite limited infrastructure, growing investments and government support signal a gradual move toward commercial flying car adoption.
Market Segmentations:
By Mode of Operation
- Manned
- Unmanned (Autonomous)
- Semi-autonomous
By Technology
- VTOL (Vertical Take-Off and Landing)
- STOL (Short Take-Off and Landing)
- CTOL (Conventional Take-Off and Landing)
By Propulsion
- Electric
- ICE
- Hybrid
By Application
- Passenger transport
- Cargo & logistics
- Military & defense
- Others
By Geography
- North America
- U.S.
- Canada
- Mexico
- Europe
- Germany
- France
- U.K.
- Italy
- Spain
- Rest of Europe
- Asia Pacific
- China
- Japan
- India
- South Korea
- South-east Asia
- Rest of Asia Pacific
- Latin America
- Brazil
- Argentina
- Rest of Latin America
- Middle East & Africa
- GCC Countries
- South Africa
- Rest of the Middle East and Africa
Competitive Landscape
The competitive landscape of the flying cars market features major players such as PAL-V International, Archer Aviation, Airbus, SkyDrive, UBER, Terrafugia, Moller, AeroMobil, Joby Aviation, and Boeing. These companies are leading innovation through advancements in electric vertical take-off and landing (eVTOL) technologies, autonomous flight systems, and hybrid propulsion designs. Strategic partnerships and heavy investments are accelerating prototype development, testing, and commercialization across urban air mobility networks. Manufacturers are focusing on reducing production costs, improving safety systems, and achieving regulatory certifications for large-scale deployment. Collaborations between aerospace firms and automotive manufacturers are also expanding the ecosystem, integrating AI-driven navigation and smart infrastructure. Government approvals, air traffic management frameworks, and infrastructure readiness remain key competitive factors. As global demand for sustainable and efficient urban transport rises, established aviation leaders and emerging startups are intensifying their efforts to capture early market leadership in this transformative mobility segment.
Key Player Analysis
- PAL-V International
- Archer Aviation
- Airbus
- SkyDrive
- UBER
- Terrafugia
- Moller
- AeroMobil
- Joby Aviation
- Boeing
Recent Developments
- In October 2025, Joby Aviation and Archer Aviation performed public flight demonstrations of their eVTOL aircraft at the Monterey County Airshow, showcasing quiet electric flight over ~10 minutes.
- In September 2025, Archer Aviation announced plans to participate in the White House’s eVTOL pilot program with U.S. airlines and cities for air taxi trials.
- In December 2024, PAL-V collaborated with Netherlands Aerospace Center (NLR) to develop rotor blades for the Liberty, with new blades weighing 78 pounds per set and spanning nearly 36 feet.
- In September 2024, PAL-V Liberty passed its first Periodic Technical Inspection (PTI/APK), four years after its road certification.
Report Coverage
The research report offers an in-depth analysis based on Mode of Operation, Technology, Propulsion, Application and Geography. It details leading market players, providing an overview of their business, product offerings, investments, revenue streams, and key applications. Additionally, the report includes insights into the competitive environment, SWOT analysis, current market trends, as well as the primary drivers and constraints. Furthermore, it discusses various factors that have driven market expansion in recent years. The report also explores market dynamics, regulatory scenarios, and technological advancements that are shaping the industry. It assesses the impact of external factors and global economic changes on market growth. Lastly, it provides strategic recommendations for new entrants and established companies to navigate the complexities of the market.
Future Outlook
- Increasing government support will accelerate regulatory approvals and commercial adoption of flying cars.
- Advancements in battery and propulsion technology will extend flight range and reduce energy costs.
- Integration of autonomous flight systems will enhance safety and operational efficiency in urban air mobility.
- Development of vertiports and air traffic infrastructure will enable large-scale deployment in major cities.
- Strategic partnerships between aviation and automotive firms will speed up prototype testing and production.
- Growing demand for zero-emission transport will push manufacturers toward fully electric flying vehicles.
- Rising investments from venture capital and tech firms will strengthen innovation and commercialization efforts.
- Expansion of air taxi services will create new opportunities in passenger and logistics applications.
- Emerging markets in Asia-Pacific and the Middle East will experience rapid adoption through smart city projects.
- Continuous improvements in safety standards and certification processes will enhance consumer confidence and market maturity.
Request a Free Sample
Fill in your details and we'll send you a free sample report.
- Sample data tables & charts
- Research methodology
Need a Custom Version of This Report?
Tailor the scope, geography, or segments to your exact requirements.
- Custom geography or segment scope
- Direct access to our analyst team
Frequently Asked Questions
What is the current market size for Flying Cars market, and what is its projected size in 2032?
At what Compound Annual Growth Rate is the Flying Cars market projected to grow between 2025 and 2032?
Which Flying Cars market segment held the largest share in 2024?
What are the primary factors fueling the growth of the Flying Cars market?
Who are the leading companies in the Flying Cars market?
Which region commanded the largest share of the Flying Cars market in 2024?
Table of Content
Chapter 1. Report Introduction
- 1.1 Report Description & Purpose
- 1.1.1 Report Title & Market Definition
- 1.1.2 Unique Selling Propositions (USP) & Key Differentiators
- 1.1.3 Value Proposition for Stakeholders
- 1.2 Research Objectives
- 1.2.1 Market Sizing Objectives (Volume & Revenue)
- 1.2.2 Segmentation Objectives
- 1.2.3 Competitive Intelligence Objectives
- 1.2.4 Forecast & Scenario Objectives
- 1.3 Report Scope
- 1.3.1 Flying Cars Scope – Types & Subtypes Covered
- 1.3.2 Geographic Scope – Regions & Countries Covered
- 1.3.3 Historical Period, Base Year & Forecast Period (2024; forecast to 2032)
- 1.3.4 Inclusions & Exclusions
- 1.4 HS Code & Classification Framework
- 1.5 Currency, Units & Pricing Basis
- 1.6 Target Stakeholders
- 1.7 Limitations & Assumptions
Chapter 2. Executive Summary
- 2.1 Global Flying Cars Market Snapshot
- 2.1.1 Market Size – Historical (2024) & Forecast (2024-2032) (2024: USD 2.74 billion → 2032: USD 70.15 billion)
- 2.1.2 Volume & Revenue – Global Totals
- 2.1.3 Key Market Highlights – Top Five Facts
- 2.2 Flying Cars Market Segmentation Snapshot
- 2.2.1 Market Split by Region – 2024 vs. 2032
- 2.3 Competitive Snapshot
- 2.3.1 Top 10 Players by Revenue Share – 2024
- 2.3.2 Top 10 Players by Volume Share – 2024
- 2.3.3 Recent Strategic Developments (18-Month Summary)
- 2.4 Key Investment Highlights & Strategic Conclusions
Chapter 3. Flying Cars Market Dynamics & Industry Analysis
- 3.1 Market Overview & Context
- 3.1.1 Flying Cars Market Position in the Broader Automotive Value Chain
- 3.1.2 OEM vs. Replacement Market Dynamics
- 3.1.3 Market Maturity & Development Stage by Region
- 3.2 Flying Cars Market Drivers
- 3.3 Flying Cars Market Restraints & Challenges
- 3.4 Flying Cars Market Opportunities
- 3.5 Porter's Five Forces Analysis
- 3.5.1 Threat of New Entrants
- 3.5.2 Bargaining Power of Suppliers
- 3.5.3 Bargaining Power of Buyers
- 3.5.4 Threat of Substitutes
- 3.5.5 Competitive Rivalry – Intensity Assessment
- 3.6 Flying Cars Value Chain Analysis
- 3.6.1 Upstream – Raw Material/Input Suppliers
- 3.6.1.1 Raw Material/Input 1
- 3.6.1.2 Raw Material/Input 2
- 3.6.1.3 Raw Material/Input 3
- 3.6.2 Midstream – Production/Manufacturing/Service Delivery
- 3.6.2.1 Production/Process Overview
- 3.6.2.2 Key Facility Locations & Capacity by Manufacturer
- 3.6.3 Downstream – Distribution & End Consumer
- 3.6.3.1 Primary Channel – B2B/OEM
- 3.6.3.2 Secondary Channels – Dealer, Retail, Online, Direct
- 3.6.4 Value Chain Profitability Analysis
- 3.6.1 Upstream – Raw Material/Input Suppliers
- 3.7 PESTEL Analysis
- 3.7.1 Political Factors
- 3.7.2 Economic Factors
- 3.7.3 Social Factors
- 3.7.4 Technological Factors
- 3.7.5 Environmental Factors
- 3.7.6 Legal Factors
- 3.8 Flying Cars Supply Chain Analysis
- 3.8.1 Raw Material/Input Supply Risk Assessment
- 3.8.2 Manufacturing Concentration Risk (Geographic Exposure)
- 3.8.3 Trade Disruption Impact Analysis
- 3.9 Regulatory & Policy Landscape
Note: The regulatory and policy landscape section covers regulations based on their applicability to the market, Flying Cars category, geography, and scope of the study. Only regulatory frameworks with a material impact on operations, compliance, trade, sustainability, or market access are analyzed in detail.
Chapter 4. Key Investment Pockets & Opportunity Analysis
- 4.1 Flying Cars Market Attractiveness Analysis
- 4.1.1 By Region – Investment Attractiveness Matrix (Volume × CAGR)
- 4.2 Absolute Revenue Growth Opportunity
- 4.2.1 By Region – Absolute USD Growth Through 2032
- 4.3 Incremental Volume Opportunity
- 4.3.1 By Region – Incremental Volume Through 2032
- 4.3.2 Segment – Incremental Volume
- 4.4 Emerging Submarket Opportunity Deep Dive (Subject to Applicability)
- 4.5 Emerging Market Opportunity Scorecards
- 4.5.1 United States
- 4.5.2 Europe
- 4.5.3 Asia
- 4.5.4 Middle East & Africa
Note: Emerging Market Opportunity Scorecards will be included based on relevance and strategic importance. Regions listed are indicative and may vary depending on data availability and market dynamics.
Chapter 5. Flying Cars Import-Export Analysis & Trade Flows
- 5.1 Global Trade Overview
- 5.1.1 Global Export Value by Country (2024)
- 5.1.2 Global Export Volume by Country (2024)
- 5.1.3 Global Import Value by Country (2024)
- 5.1.4 Global Import Volume by Country (2024)
- 5.1.5 Net Trade Balance by Country (2024)
- 5.2 Export Analysis – Segment
- 5.2.1 Type 1 (HS Code)
- 5.2.2 Type 2 (HS Code)
- 5.2.3 Type 3 (HS Code)
- 5.2.4 Type 4 (HS Code)
- 5.2.5 Type 5 (HS Code)
- 5.3 Import Analysis – Segment
- 5.3.1 Type 1 (HS Code)
- 5.3.2 Type 2 (HS Code)
- 5.3.3 Type 3 (HS Code)
- 5.3.4 Type 4 (HS Code)
- 5.3.5 Type 5 (HS Code)
- 5.4 Average Unit Trade Prices
- 5.4.1 Average Export Price – Segment & Country
- 5.4.2 Average Import Price – Segment & Source Country
- 5.4.3 Price Trends (2024)
- 5.5 Key Trade Route Analysis
- 5.5.1 Trade Route 1
- 5.5.2 Trade Route 2
- 5.5.3 Trade Route 3
- 5.5.4 Trade Route 4
- 5.5.5 Trade Route 5
- 5.6 Trade Policy Impact Assessment
- 5.6.1 US Anti-Dumping & Section 301 Tariffs
- 5.6.2 EU Customs Union Impact
- 5.6.3 Major Free Trade Agreements
- 5.6.4 USMCA Rules of Origin
Note: Trade policy analysis will be included only where relevant to the Flying Cars market.
Chapter 6. Competitive Landscape & Company Benchmarking
- 6.1 Flying Cars Market Concentration & Structure
- 6.1.1 Herfindahl-Hirschman Index (HHI) – vs. 2024
- 6.1.2 Tier 1, Tier 2 & Tier 3 Market Structure
- 6.1.3 Global, Regional & Local Player Dynamics
- 6.2 Flying Cars Market Share Analysis – 2024
- 6.2.1 Global Revenue Share by Company
- 6.2.2 Global Volume Share by Company
- 6.2.3 Regional Revenue Share
- 6.2.4 Market Share Evolution ( vs. 2024)
- 6.2.5 OEM Segment Share by Company
- 6.2.6 Replacement Segment Share by Company
- 6.3 Production/Delivery Capacity & Facility Analysis
- 6.3.1 Global Installed Capacity
- 6.3.2 Capacity Utilization Rates
- 6.3.3 Production/Output Volume
- 6.3.4 Facility Locations & Capacity Map
- 6.3.5 Planned Capacity Additions
- 6.4 Flying Cars Competitive Benchmarking Matrix
- 6.4.1 Revenue, Volume, CAGR & Profitability Comparison
- 6.4.2 Channel Revenue Mix
- 6.4.3 Geographic Revenue Exposure
- 6.4.4 R&D Intensity
- 6.4.5 Sustainability Maturity
- 6.5 Strategic Developments in Flying Cars (Last 24 Months)
- 6.5.1 Mergers, Acquisitions & Divestments
- 6.5.2 New Flying Cars Launches
- 6.5.3 Facility Expansions
- 6.5.4 Strategic Alliances, Joint Ventures & Partnerships
- 6.5.5 Distribution Expansion & Market Entry
- 6.5.6 Sustainability & ESG Initiatives
- 6.6 Competitive Strategy Mapping
- 6.6.1 Leader, Challenger, Follower & Niche Classification
- 6.6.2 Pricing Strategy Comparison
- 6.6.3 Channel Strategy Matrix
Note: Strategic developments are included based on their materiality and the availability of reliable information.
Chapter 7. Global Flying Cars Market – By Distribution Channel
- 7.1 Segment Overview
- 7.1.1 Volume & Revenue Split by Channel (2024 & 2032)
- 7.1.2 Channel Mix Evolution (2024-2032)
Chapter 8. Regional Market Analysis – Global Overview
- 8.1 Global Regional Overview
- 8.1.1 Regional Volume Share
- 8.1.2 Regional Revenue Share
- 8.1.3 Regional Volume by Region
- 8.1.4 Regional Revenue by Region
- 8.1.5 Regional Forecast Through 2032
- 8.2 Cross-Regional Segment Analysis
- 8.2.1 By Distribution Channel
- 8.2.2 By Brand/Price Tier
Chapter 9. North America Flying Cars Market
- 9.1 United States
- 9.2 Canada
- 9.3 Mexico
Chapter 10. Europe Flying Cars Market
- 10.1 Germany
- 10.2 France
- 10.3 Italy
- 10.4 United Kingdom
- 10.5 Spain
- 10.6 Poland
- 10.7 Russia
- 10.8 Netherlands
- 10.9 Belgium
- 10.10 Sweden
- 10.11 Denmark
- 10.12 Norway
- 10.13 Rest of Europe
Chapter 11. Asia Pacific Flying Cars Market
- 11.1 China
- 11.2 India
- 11.3 Japan
- 11.4 South Korea
- 11.5 Thailand
- 11.6 Indonesia
- 11.7 Vietnam
- 11.8 Malaysia
- 11.9 Australia
- 11.10 Rest of Asia Pacific
Chapter 12. Latin America Flying Cars Market
- 12.1 Brazil
- 12.2 Argentina
- 12.3 Colombia
- 12.4 Chile
- 12.5 Rest of Latin America
Chapter 13. Middle East Flying Cars Market
- 13.1 Saudi Arabia
- 13.2 United Arab Emirates
- 13.3 Turkey
- 13.4 Israel
- 13.5 Iran
- 13.6 Rest of the Middle East
Chapter 14. Africa Flying Cars Market
- 14.1 South Africa
- 14.2 Egypt
- 14.3 Nigeria
- 14.4 Morocco
- 14.5 Rest of Africa
Chapter 15. Flying Cars Company Profiles
- 15.1 [Company 01]
- 15.1.1 Company Overview
- 15.1.2 Key Management Personnel
- 15.1.3 Products & Services Portfolio
- 15.1.4 Financial Performance
- 15.1.5 Key Market Focus & Geographic Presence
- 15.1.6 Recent Developments & Strategic Initiatives
Note: The company profile list is preliminary and may change based on research findings, market developments, data availability, and client requirements.
Chapter 16. Appendices
- Appendix A – List of Abbreviations & Acronyms
- Appendix B – Industry Classification Code Reference – Full Series
- Appendix C – Production & Capacity Data Tables
- Appendix D – End-Use & Demand Base Tables
- Appendix E – Consumption & Replacement Rate Assumptions
- Appendix F – ASP Reference Tables
- Appendix G – Manufacturing & Facility Database
- Appendix H – Import-Export Data Tables
- Appendix I – Regulatory Summary Tables
- Appendix J – Primary Research Participant List (Anonymized)
- Appendix K – Primary Research Questionnaire Framework
- Appendix L – Data Sources & Bibliography
- Appendix M – Market Size Divergence & Source Comparison
Chapter 17. Research Methodology
- 17.1 Research Framework & Philosophy
- 17.2 Secondary Research – Sources, Hierarchy & Data Extraction
- 17.3 Data Modeling – Bottom-Up & Top-Down Market Sizing
- 17.4 Primary Research – Stakeholder Framework, LOI & Sample Sizes
- 17.5 Forecast Methodology – Regression, Scenario & Sensitivity Analysis
- 17.6 Quality Control – Four-Layer Validation Framework
- 17.7 Limitations & Standard Assumptions
- 17.8 Disclaimer
