
Antiplatelet drugs market grows on procedures, not price
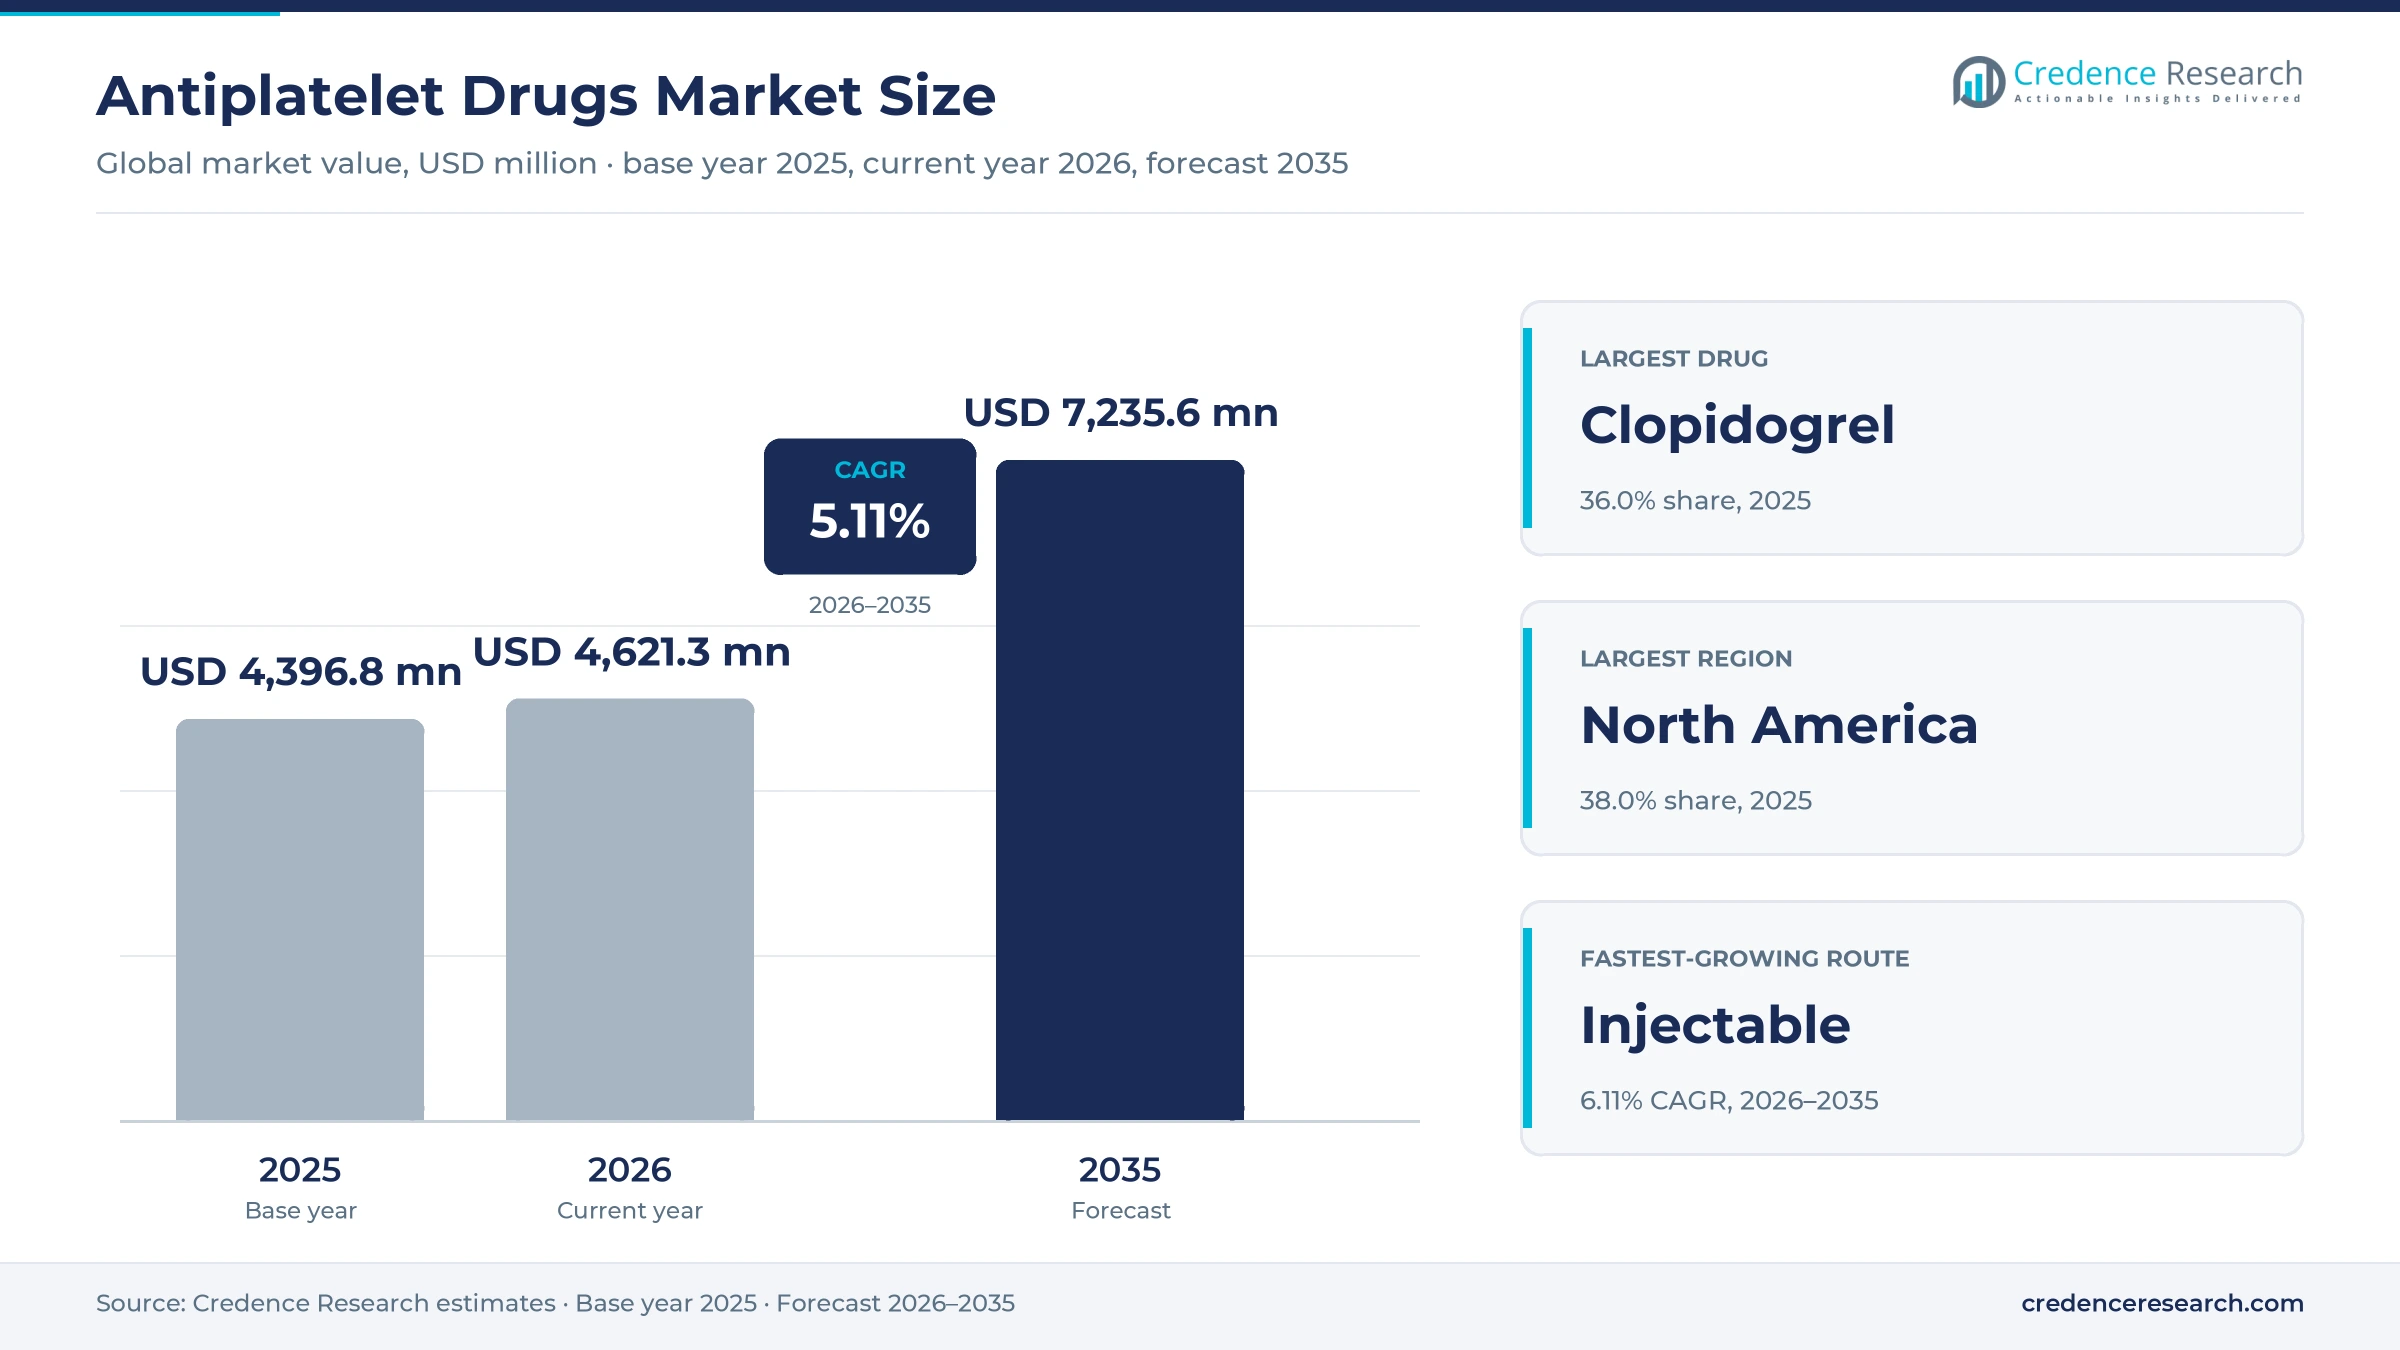
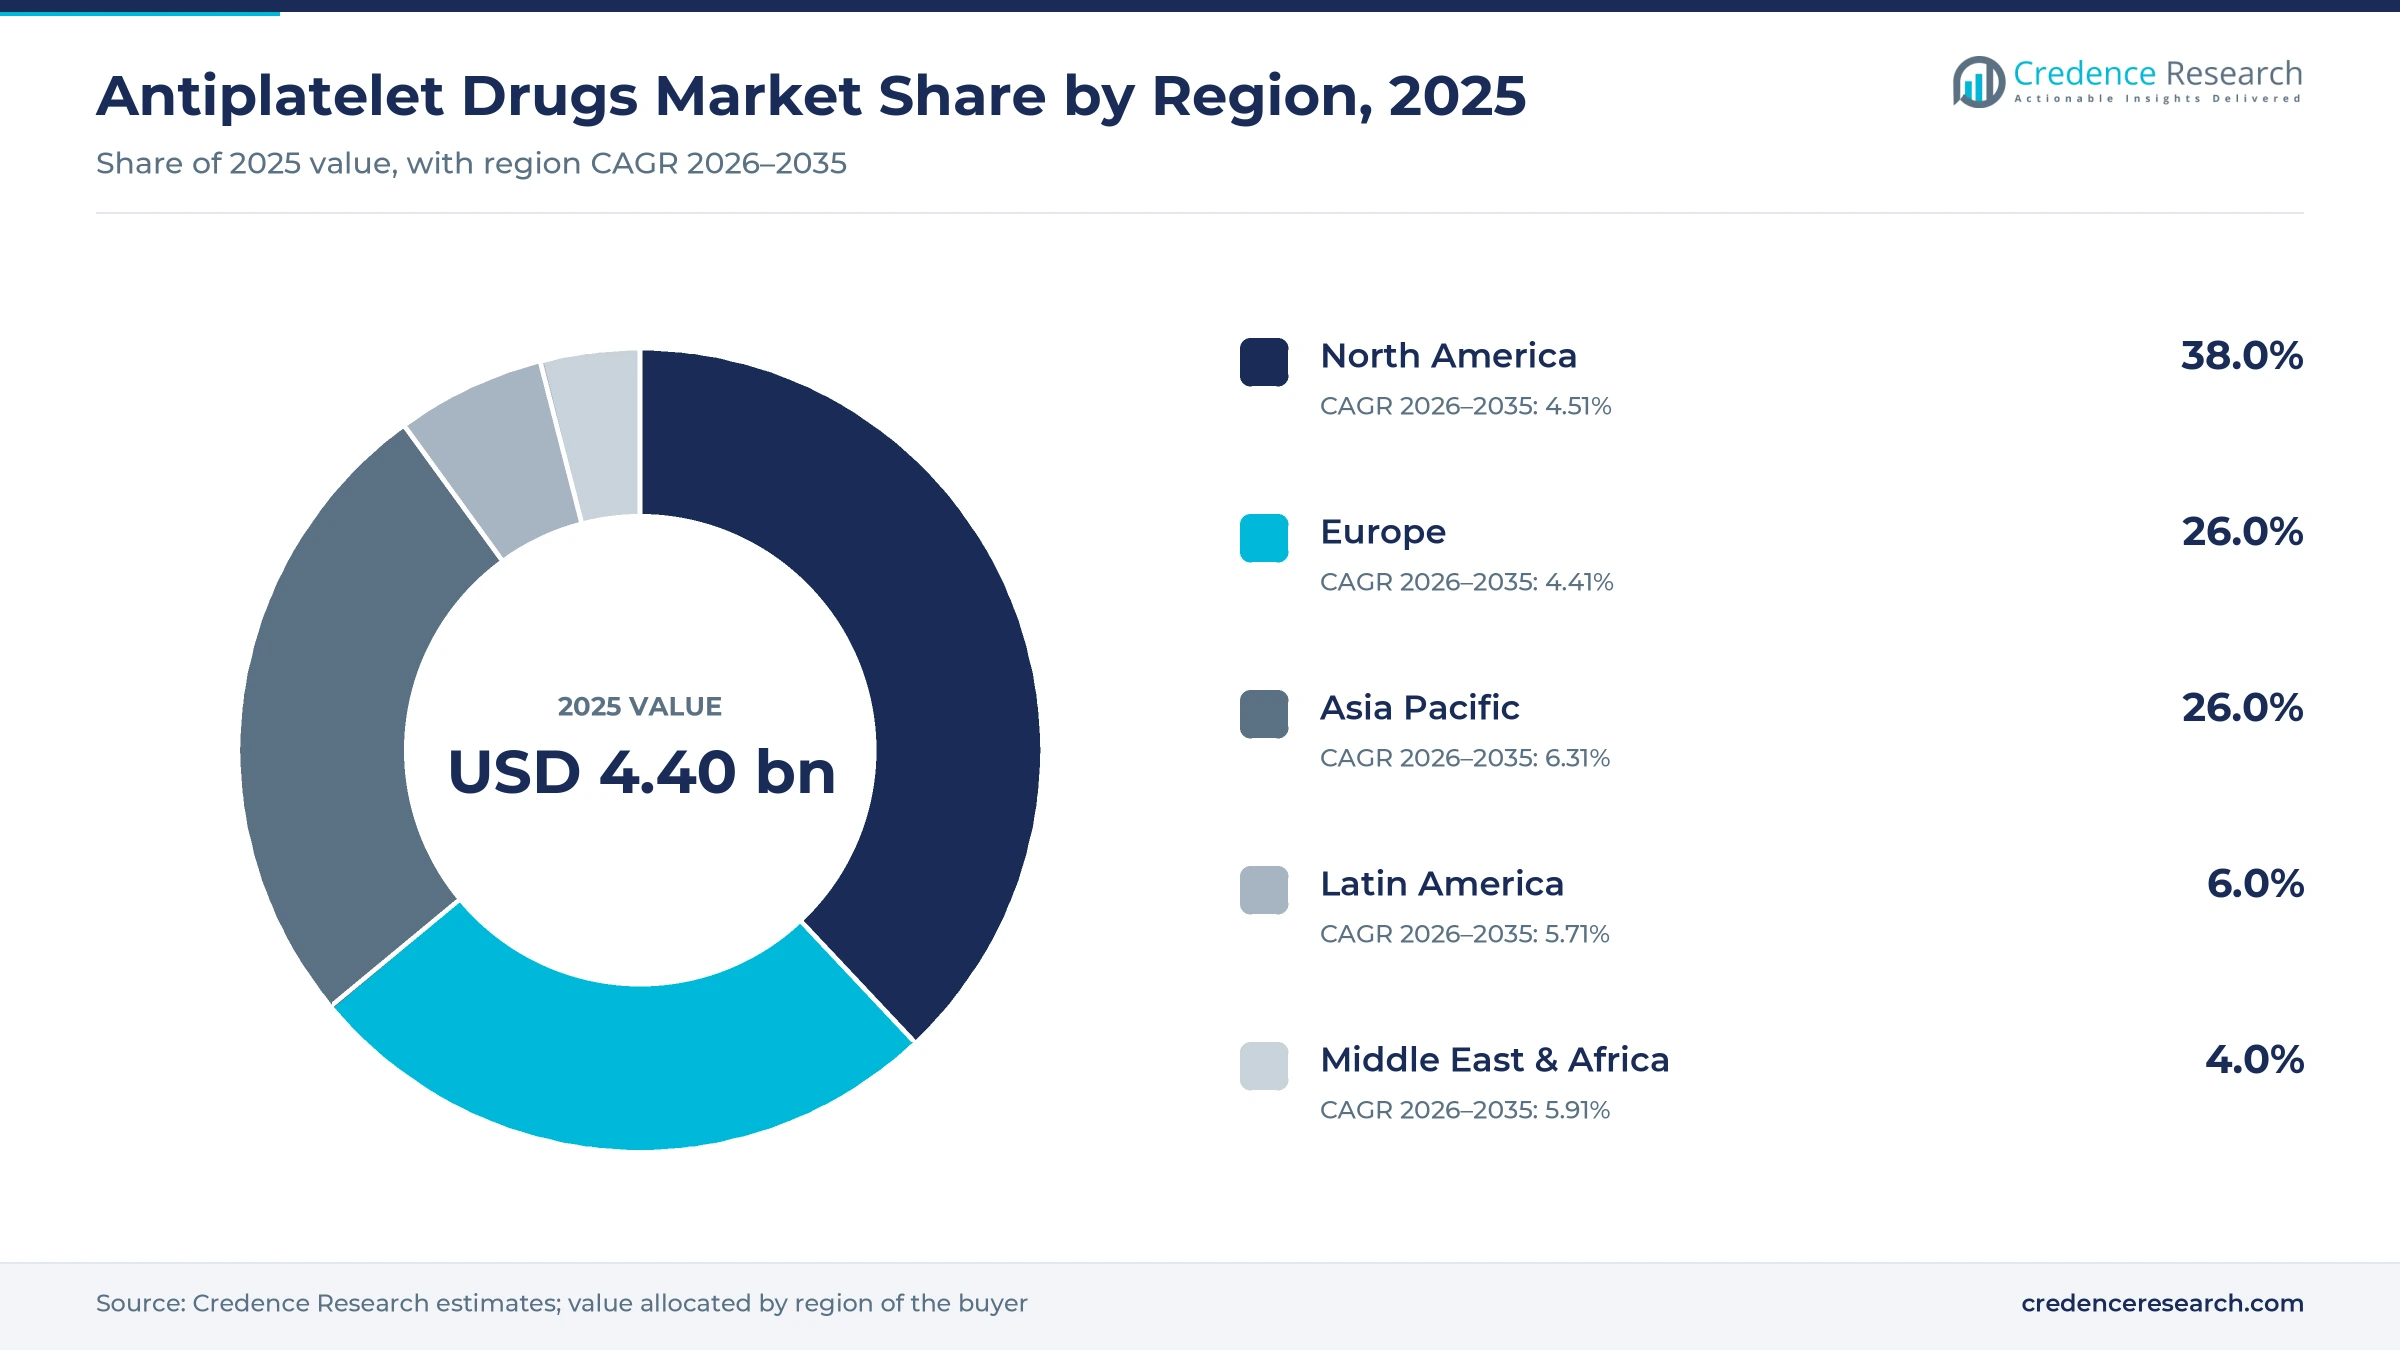
The global antiplatelet drugs market was valued at USD 4.40 billion in 2025 and is projected to increase from USD 4.62 billion in 2026 to USD 7.24 billion by 2035, registering a CAGR of 5.11% during 2026–2035. Demand comes from patients with acute coronary syndromes, those who receive coronary stents and those with peripheral or cerebrovascular arterial disease, most of whom take dual therapy for a year or longer. North America held the largest regional share, 38.0% in 2025, because branded P2Y12 inhibitors and high procedure volumes lift spending per patient. Asia Pacific is the fastest-growing region at 6.31% a year, as China and India expand stent procedures and insurance coverage. The commercial picture shifted in May 2025, when generic ticagrelor reached U.S. pharmacies and cut the price of the highest-spending branded agent in the class. As a result, volume keeps rising while value growth depends on new injectable and self-administered agents.
Which therapies and patients does this analysis cover?
The analysis counts oral and injectable platelet inhibitors, including low-dose aspirin used for cardiovascular prevention, P2Y12 inhibitors such as clopidogrel, ticagrelor and prasugrel, and glycoprotein IIb/IIIa inhibitors, valued at manufacturer selling prices. Hospitals buy injectable agents for use in the catheterization laboratory, while retail and online pharmacies dispense oral tablets that patients take for months or years after discharge.
Anticoagulants such as warfarin and direct oral anticoagulants, thrombolytics and stent devices sit outside the scope of this analysis. The value chain runs from active ingredient producers in India and China through originator and generic manufacturers to wholesalers, pharmacy benefit managers and hospital formularies.
Antiplatelet Drugs Market Insights
- The antiplatelet drugs market grows from USD 4.40 billion in 2025 to USD 7.24 billion by 2035, a 5.11% CAGR driven by coronary procedures and aging cardiac patients.
- North America held 38.0% of global antiplatelet value in 2025, supported by high stent volumes and branded P2Y12 inhibitor use before generic entry.
- Clopidogrel led drug types with 36.0% of 2025 value, while injectable agents grow fastest among routes at 6.11% a year.
- In May 2025, Teva and several other makers launched generic ticagrelor in the United States, ending exclusivity for the highest-spending branded antiplatelet agent.
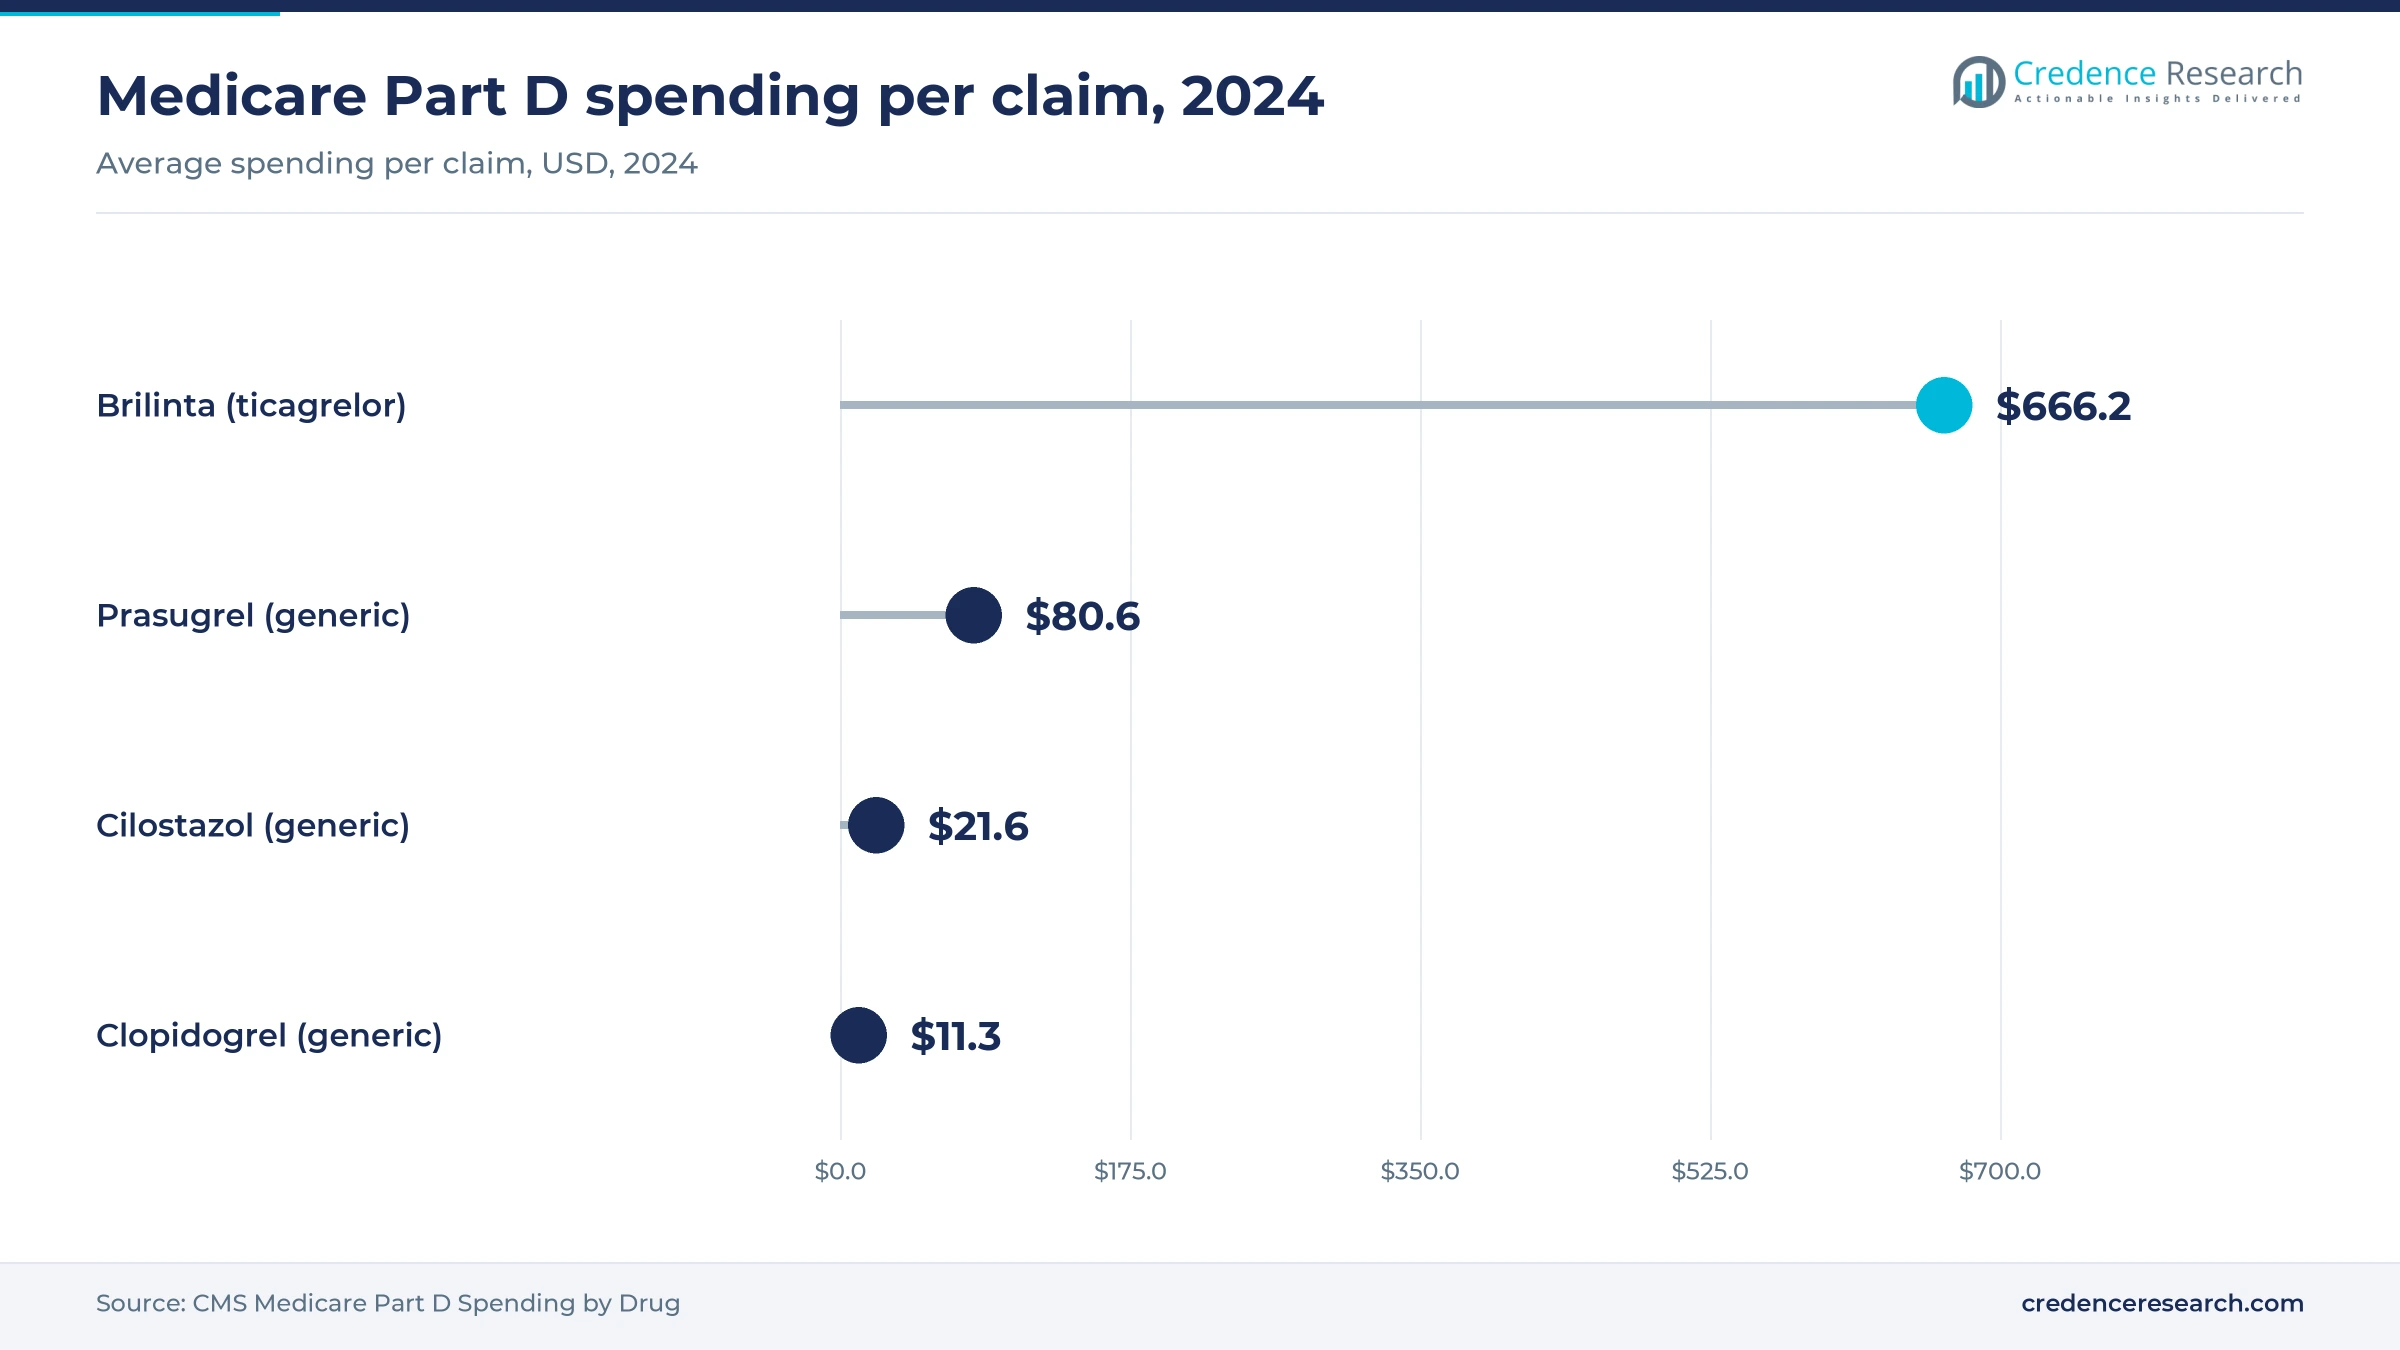
- Medicare Part D paid about USD 666 per Brilinta claim in 2024 versus about USD 11 for generic clopidogrel, a price gap that generics now close.
Clopidogrel leads as injectable agents gain pace
Why does clopidogrel still lead despite newer P2Y12 inhibitors?
Based on drug, the market is categorized into aspirin, clopidogrel, ticagrelor, prasugrel and others. Clopidogrel led with a 36.0% share of 2025 value, because it remains the most widely prescribed P2Y12 inhibitor across Asia, Europe and Latin America. Other agents, including injectable glycoprotein IIb/IIIa inhibitors and cangrelor, grow fastest at 6.22% a year as procedural and pre-hospital use expands. Ticagrelor keeps a large share, although U.S. generic entry in 2025 lowers its price per tablet.
Which cardiac events account for most prescriptions?
Based on indication, the market is categorized into myocardial infarction, percutaneous coronary interventions, arterial thrombosis and others. Myocardial Infarction led with a 39.0% share of 2025 value, because patients usually take dual therapy for at least a year after a heart attack. Percutaneous Coronary Interventions grow fastest at 5.44% a year, as hospitals in China, India and Southeast Asia implant more coronary stents. Arterial thrombosis demand comes mainly from peripheral artery disease and stroke prevention.
Can injectable agents move treatment before hospital arrival?
Based on route of administration, the market is categorized into oral and injectable products. Oral products led with a 91.0% share of 2025 value, because maintenance therapy after a heart attack or stent relies on daily tablets taken for months or years. Injectable products grow fastest at 6.11% a year, helped by catheterization laboratory use and new subcutaneous agents designed for first responders. This shift is still small in value, but it opens a premium niche.
Where do patients fill long-term prescriptions?
Based on distribution channel, the market is categorized into hospital pharmacy, retail pharmacy, online pharmacy and others. Retail Pharmacy led with a 49.0% share of 2025 value, because most patients refill oral P2Y12 inhibitors and aspirin at community pharmacies after discharge. Online Pharmacy grows fastest at 7.09% a year, as mail-order refills of long-term cardiac medicines gain ground. Hospital pharmacies handle loading doses and injectable agents during procedures.
| Segment Group | Leading Sub-segment | Share, 2025 | Fastest-growing Sub-segment | CAGR, 2026–2035 |
|---|---|---|---|---|
| By Drug | Clopidogrel | 36.0% | Others | 6.22% |
| By Indication | Myocardial Infarction | 39.0% | Percutaneous Coronary Interventions | 5.44% |
| By Route of Administration | Oral | 91.0% | Injectable | 6.11% |
| By Distribution Channel | Retail Pharmacy | 49.0% | Online Pharmacy | 7.09% |
Request a Free Sample
Fill in your details and we'll send you a free sample report.
- Sample data tables & charts
- Research methodology
Heart disease and dual-therapy guidelines lift demand
How does the global burden of heart disease sustain demand?
Cardiovascular disease remains the largest source of demand, because most heart attacks and ischemic strokes are treated or prevented with antithrombotic therapy built around platelet inhibition. The World Health Organization estimates that 19.8 million people died from cardiovascular diseases in 2022, about 32% of all global deaths. Heart attack and stroke caused 85% of these deaths, and survivors usually start long-term preventive therapy. As a result, each new acute event adds a patient who stays on treatment for a year or longer.
Why do guidelines lock in dual therapy after acute coronary syndromes?
Clinical guidelines keep volumes high, because they make dual therapy the default after an acute coronary syndrome. In February 2025, the American College of Cardiology and American Heart Association issued a new acute coronary syndromes guideline that recommends aspirin plus a P2Y12 inhibitor for at least 12 months in patients with low bleeding risk. This guidance supports steady refills in North America and shapes practice in many other countries. In turn, every stent or heart attack generates a predictable course of treatment.
How are rising stent procedures in Asia lifting volumes?
Procedure growth in Asia adds the most new patients, because every coronary stent requires a course of dual therapy to prevent stent thrombosis. China and India are expanding catheterization laboratory capacity and insurance coverage for cardiac procedures, which brings treatment to patients who were previously managed with medicines alone. Generic clopidogrel and ticagrelor keep the cost per patient low in these countries. As a result, Asia Pacific contributes the largest volume gains, even though value per tablet is lower than in the United States.
Why does an aging population keep the patient pool growing?
Aging populations widen the patient pool, because the risk of heart attack, stroke and peripheral artery disease rises sharply after age 65. Older patients often live for many years after a first event and remain on single or dual therapy throughout that time. This demand is concentrated in Japan, Western Europe and North America, where survival after heart attack has improved. In turn, the number of long-term users grows even when the rate of new events stabilizes.
Generic ticagrelor and pre-hospital agents reshape pricing
How is generic ticagrelor shifting value in the United States?
Generic entry is the largest pricing shift in the U.S. market, because ticagrelor was the highest-spending branded agent in its class. In May 2025, Teva launched a generic version of the 60 milligram tablet, while Dr. Reddy's, Apotex and several other makers launched the 90 milligram strength. According to Medicare Part D spending by drug data, Brilinta cost USD 666.17 per claim in 2024, compared with USD 11.33 for generic clopidogrel. As a result, ticagrelor use can expand while revenue per prescription falls.
Is platelet inhibition moving before hospital arrival?
Treatment is shifting earlier in the care pathway, because faster platelet inhibition can limit heart damage during a heart attack. In November 2025, CeleCor Therapeutics announced that its Phase 3 CeleBrate trial of zalunfiban, a subcutaneous glycoprotein IIb/IIIa inhibitor given at first medical contact, met its efficacy and safety endpoints. The trial enrolled 2,467 patients with presumed ST-elevation heart attacks across 45 sites. In turn, emergency medical services could become a new buying channel for injectable agents later in the decade.
Can self-administered agents open a new prevention niche?
Self-administered rescue therapy is a clear opening for companies with novel agents, because patients often wait hours before reaching a hospital. In February 2024, Viatris entered a global collaboration with Idorsia that added selatogrel, a self-administered P2Y12 inhibitor for patients with a history of heart attack, to its portfolio. Selatogrel is designed for use at the first sign of symptoms, before emergency care arrives. If late-stage trials succeed, this approach could create a premium category beyond maintenance tablets.
Where can generic makers win share in emerging markets?
Generic manufacturers have room to grow in Asia, Latin America and Africa, where most patients pay out of pocket and price decides brand choice. Indian producers such as Sun Pharmaceutical, Cipla and USV already sell clopidogrel, aspirin and ticagrelor products at low cost across these regions. Fixed-dose combinations of aspirin with clopidogrel simplify adherence and reduce pill counts for long-term users. As a result, companies with local manufacturing and wide pharmacy networks can capture volume as procedure rates rise.
Bleeding risk and generic tenders cap value growth
Why does bleeding risk limit more potent therapy?
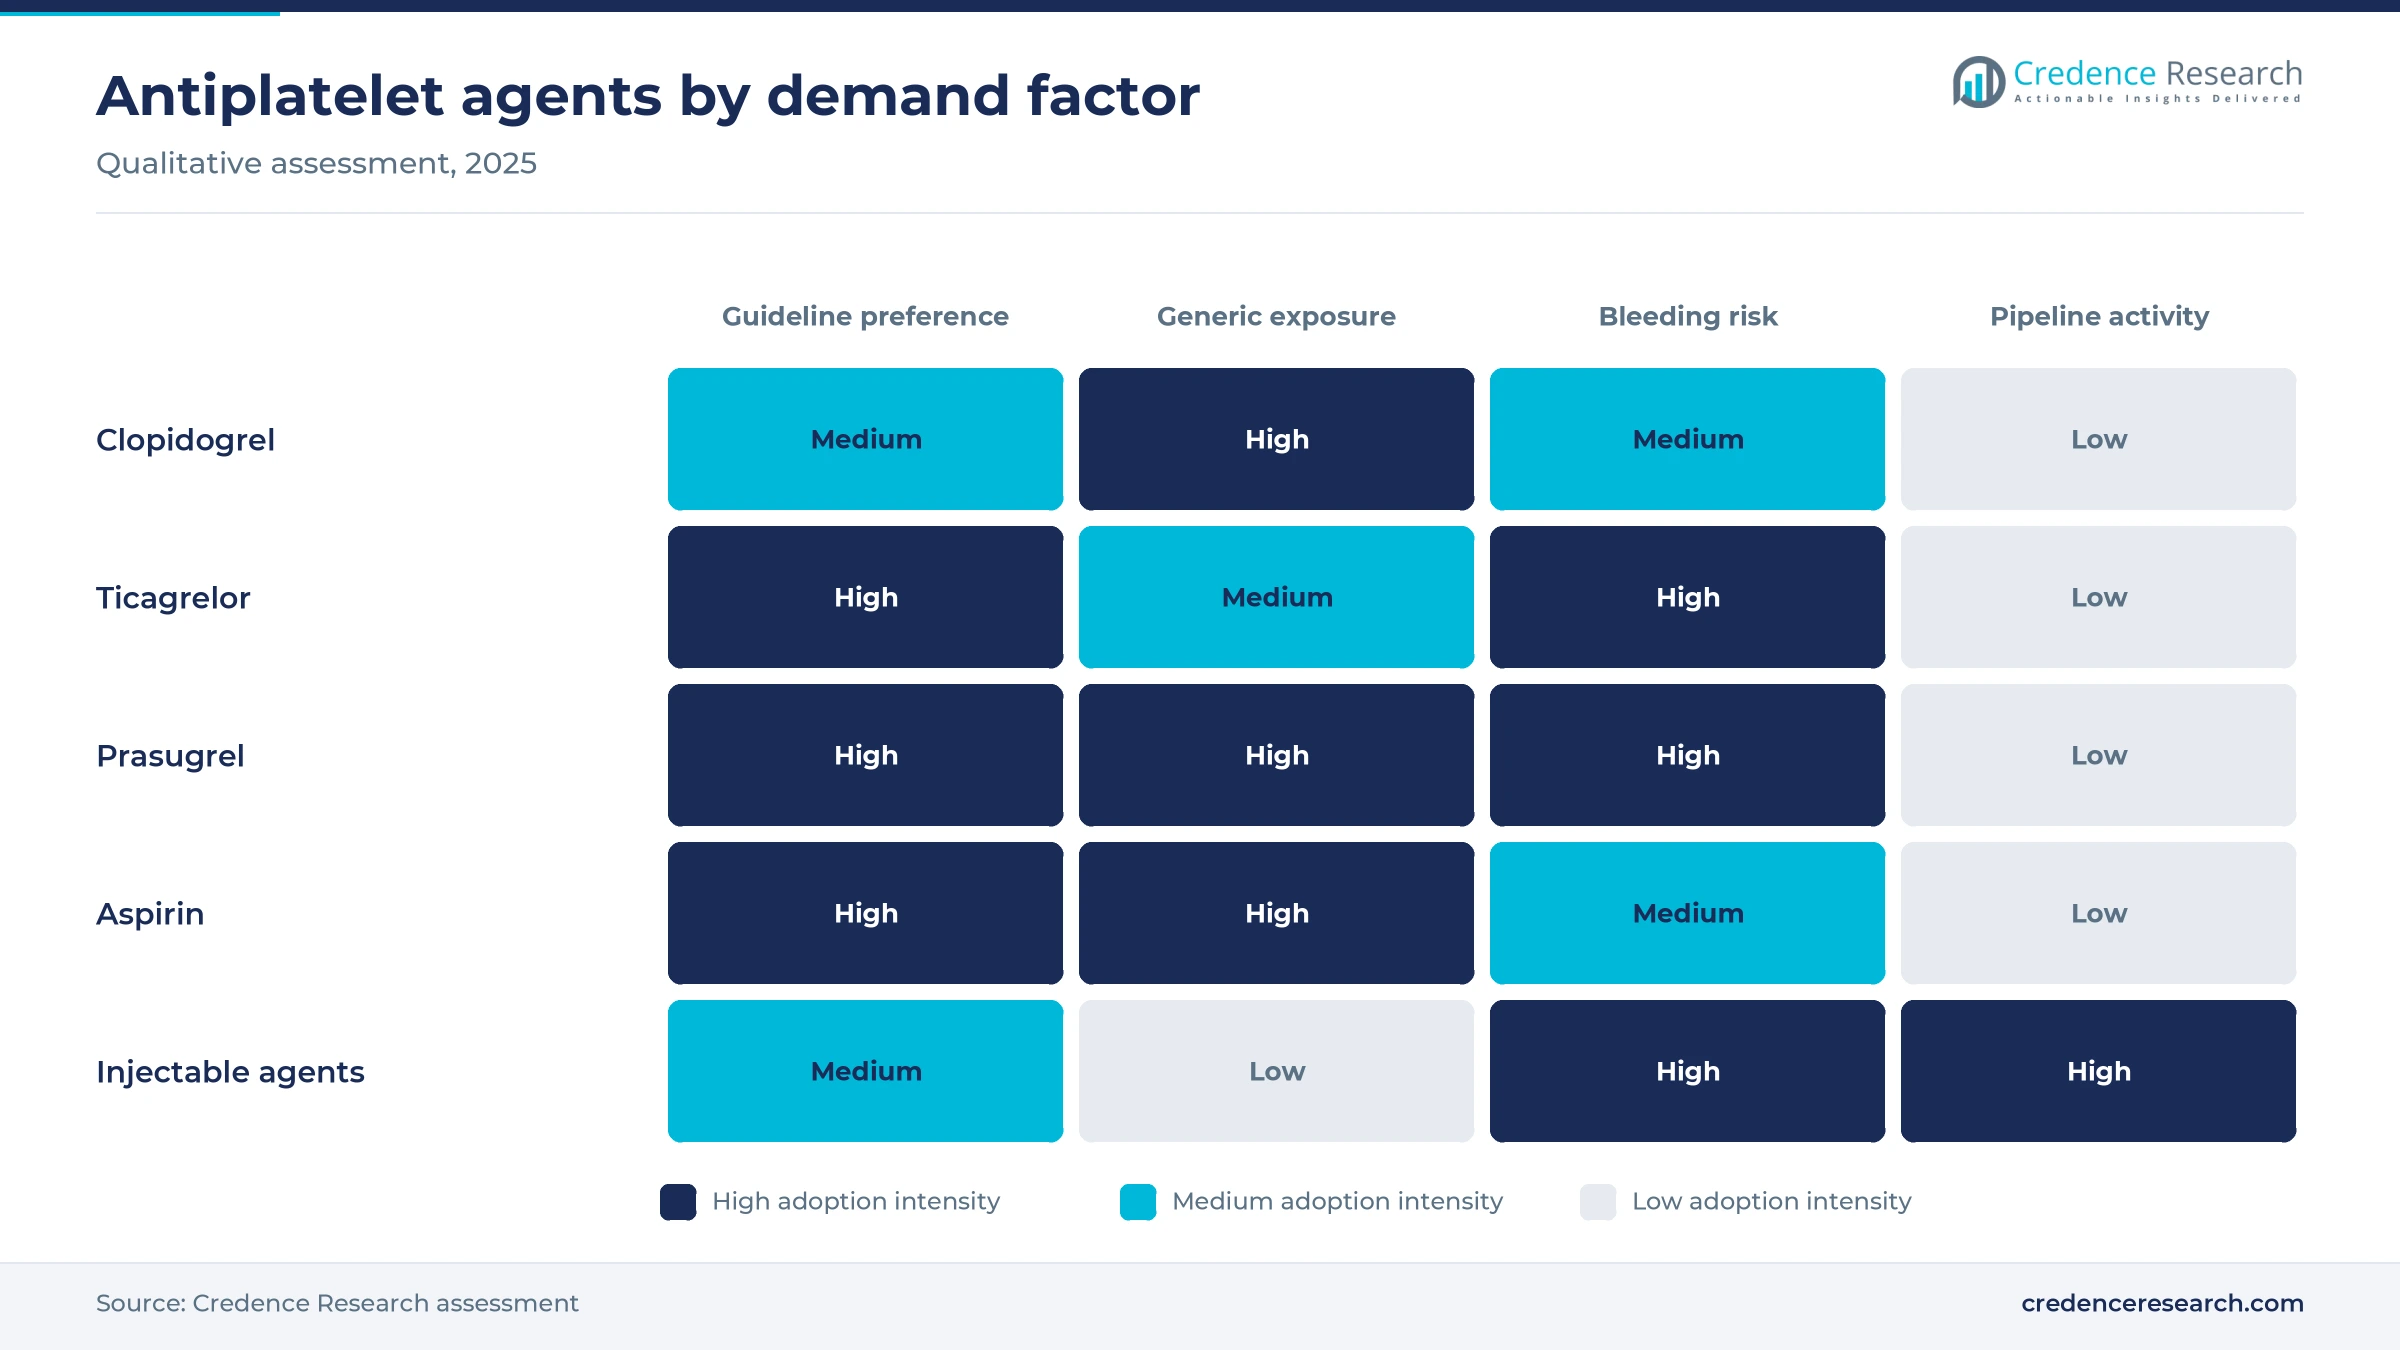
Bleeding risk is the main clinical constraint, because stronger platelet inhibition prevents clots but raises the chance of serious bleeding. Physicians therefore shorten dual therapy or switch to less potent agents in older patients, those with prior bleeding and those who also take anticoagulants for atrial fibrillation. The 2025 guideline from the American College of Cardiology and American Heart Association lists several strategies for patients with higher bleeding risk. This caution limits uptake of potent agents such as prasugrel and ticagrelor, and it caps treatment duration for a growing share of elderly patients.
How does generic price erosion cap value growth?
Generic price erosion caps value growth, because clopidogrel, prasugrel and now ticagrelor are all available from multiple manufacturers. Medicare Part D data show that 23 manufacturers supplied generic clopidogrel in 2024, which pushed spending per claim to the lowest level in the class. Similar competition exists in Europe and Asia, where tenders award contracts mainly on price. As a result, rising prescription volumes translate into much slower value growth, and branded originators lose most of their remaining share.
Why is aspirin use for primary prevention falling?
Aspirin demand for primary prevention is declining, because recent evidence shows that bleeding risk often outweighs the benefit in older adults without heart disease. In April 2022, the U.S. Preventive Services Task Force recommended against starting low-dose aspirin for primary prevention in adults 60 years or older. Similar caution appears in European guidance for people without established cardiovascular disease. In turn, aspirin volumes now depend mostly on secondary prevention after a heart attack, stroke or stent.
Do adherence gaps reduce long-term prescriptions?
Adherence gaps reduce realized demand, because many patients stop dual therapy early once they feel well after discharge. Side effects such as bleeding, bruising and, with ticagrelor, shortness of breath lead some patients to switch or discontinue treatment. Cost also matters in countries where patients pay out of pocket for branded agents. As a result, prescribed treatment courses do not always convert into dispensed tablets, which limits volume growth in low- and middle-income countries.
North America leads as Asia Pacific adds stent patients
| Region | Value, 2025 (USD billion) | Share, 2025 | CAGR, 2026–2035 |
|---|---|---|---|
| North America | 1.67 | 38.0% | 4.51% |
| Europe | 1.14 | 26.0% | 4.41% |
| Asia Pacific | 1.14 | 26.0% | 6.31% |
| Latin America | 0.26 | 6.0% | 5.71% |
| Middle East & Africa | 0.18 | 4.0% | 5.91% |
Why does North America hold the largest regional share?
North America held a 38.0% share of 2025 value and grows at 4.51% a year through 2035. The United States drives this position, and Medicare Part D alone covered 3.41 million clopidogrel users and 242,931 Brilinta users in 2024. Generic ticagrelor entry in 2025 lowers prices, which keeps regional value growth below the global rate. However, new injectable agents for pre-hospital care are likely to reach this region first.
How fast is Asia Pacific adding patients?
Asia Pacific held a 26.0% share of 2025 value and is the fastest-growing region at 6.31% a year. China, India and Southeast Asia are expanding coronary intervention capacity, which adds large numbers of new patients on dual therapy each year. Japan contributes high-value demand, where Daiichi Sankyo markets prasugrel at doses adapted for local patients. Generic makers such as Sun Pharmaceutical, Cipla and USV keep prices low across India and nearby export markets.
What shapes demand across Europe?
Europe held a 26.0% share of 2025 value and grows at 4.41% a year, the slowest pace of the five regions. Generic clopidogrel and prasugrel dominate tenders in Germany, France, the United Kingdom, Italy and Spain, which holds down prices. European guidelines also allow shorter dual therapy for patients with high bleeding risk, which limits treatment duration. However, an aging population and better survival after heart attack keep the number of long-term users growing.
Where is Latin America adding demand?
Latin America held a 6.0% share of 2025 value and grows at 5.71% a year through 2035. Brazil and Mexico lead regional demand, where public health systems buy generic clopidogrel and aspirin in large tenders. Rising access to coronary stents in private hospitals is lifting use of ticagrelor and prasugrel among insured patients.
What limits growth in the Middle East and Africa?
The Middle East and Africa held a 4.0% share of 2025 value and grows at 5.91% a year through 2035. Gulf states add higher-value demand from modern cardiac centers that use branded and injectable agents. Sub-Saharan Africa remains a small market, because access to catheterization laboratories is still limited outside major cities.
Generics, guidelines and pipeline milestones since 2024
| Development | Status and market relevance |
|---|---|
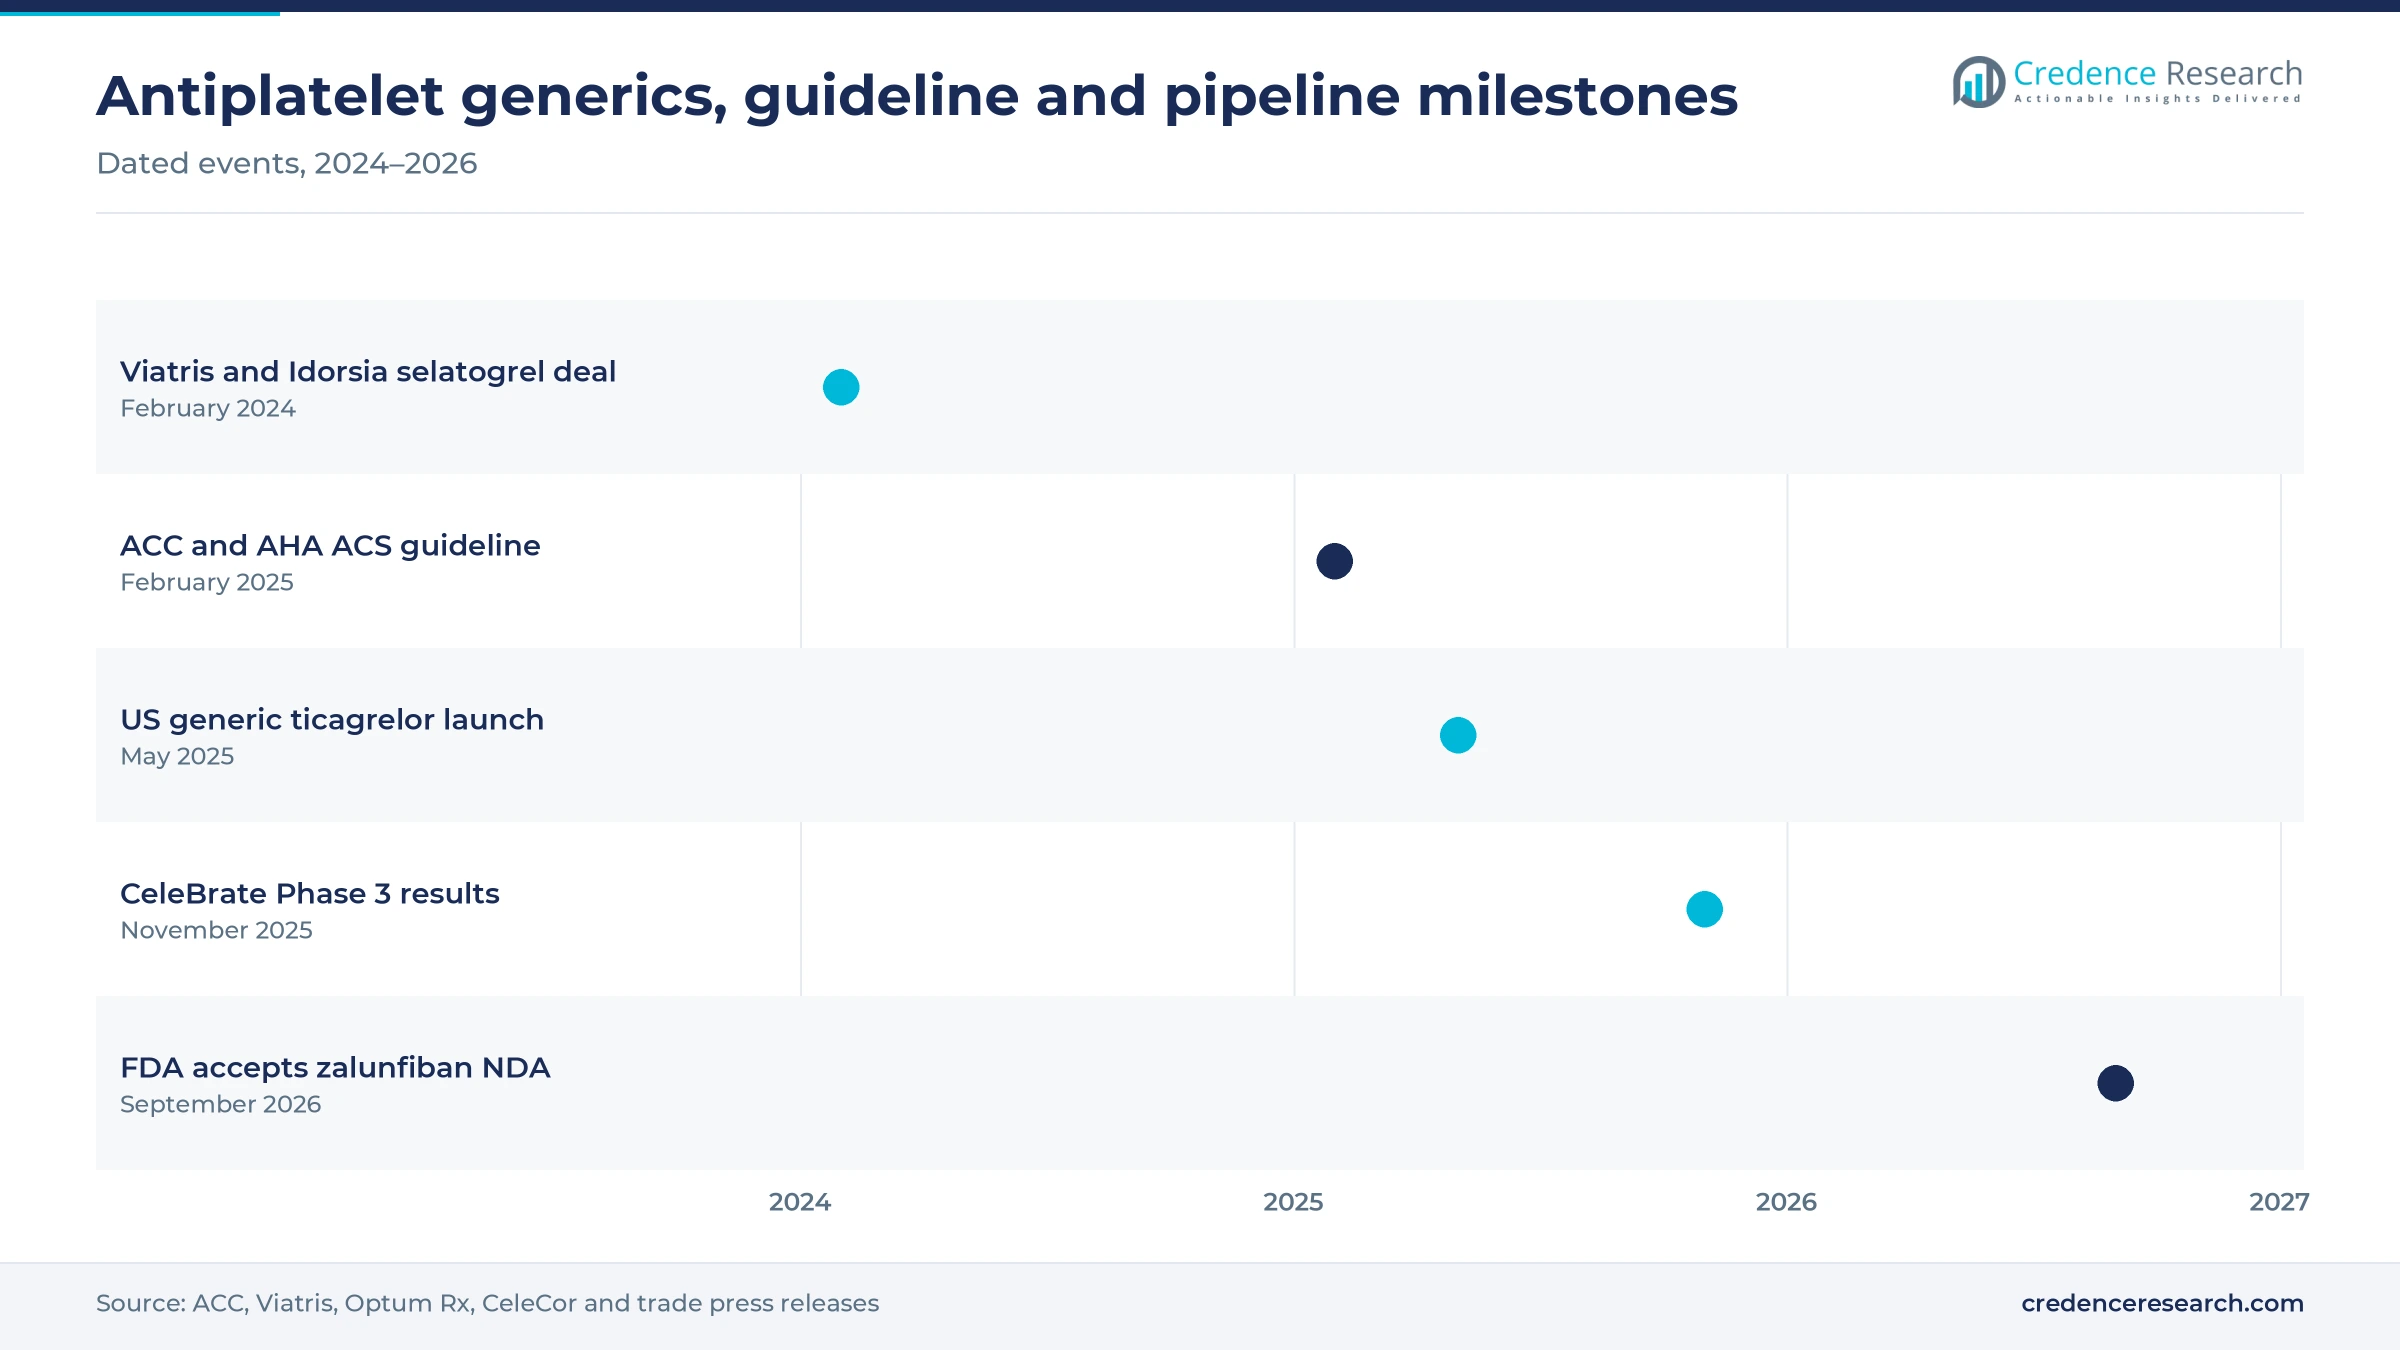
| In February 2024, Viatris and Idorsia announced a global research and development collaboration covering selatogrel, a self-administered P2Y12 inhibitor in Phase 3. | Collaboration active; targets pre-hospital treatment of recurrent heart attack |
| In February 2025, the American College of Cardiology and American Heart Association announced a new acute coronary syndromes guideline. | Published; keeps aspirin plus a P2Y12 inhibitor as standard care for at least one year in low bleeding risk patients |
| In May 2025, Teva and several other manufacturers launched generic ticagrelor tablets in the United States. | On market; lowers prices for the highest-spending branded agent in the class |
| In November 2025, CeleCor Therapeutics announced that its Phase 3 CeleBrate trial of subcutaneous zalunfiban met its efficacy and safety endpoints. | Positive Phase 3; supports first-responder use in ST-elevation heart attack |
| In September 2026, CeleCor Therapeutics announced U.S. Food and Drug Administration acceptance of its new drug application for zalunfiban. | Under FDA review; target action date of June 2027 |
First-responder and self-injected agents lead the pipeline
- Subcutaneous glycoprotein IIb/IIIa inhibitors such as zalunfiban are designed for a single injection at first medical contact, which moves platelet inhibition ahead of hospital arrival.
- Self-administered P2Y12 inhibitors such as selatogrel aim to let patients with a prior heart attack treat themselves at the first sign of symptoms.
- Platelet function and genetic testing helps clinicians identify poor responders to clopidogrel, which guides switching to ticagrelor or prasugrel.
- Fixed-dose combinations of aspirin with clopidogrel or statins reduce pill burden, which supports adherence in long-term secondary prevention.
Need a Custom Version of This Report?
Tailor the scope, geography, or segments to your exact requirements.
- Custom geography or segment scope
- Direct access to our analyst team
Originators face generic rivals across every oral agent
Competition splits between originators with branded P2Y12 inhibitors and a large group of generic manufacturers that now supply most volume. AstraZeneca built ticagrelor, sold as Brilinta, into the highest-spending brand in its class in Medicare, but U.S. generic entry in 2025 now erodes its price. Sanofi and Bristol-Myers Squibb still market clopidogrel under the Plavix brand, and Daiichi Sankyo co-developed prasugrel, which remains widely used in Japan. Bayer remains a major supplier of low-dose aspirin for cardiovascular prevention. Teva Pharmaceutical Industries, Sun Pharmaceutical, Cipla and USV compete on price in generic clopidogrel, ticagrelor and aspirin products across North America, Europe and Asia. The nine companies profiled below span originators and generic specialists. However, generic tenders limit pricing power for every established molecule.
Companies profiled and their roles in this market
| Company | Type | Role in the market |
|---|---|---|
| AstraZeneca | Originator | Ticagrelor (Brilinta), now facing U.S. generic competition |
| Sanofi | Originator | Clopidogrel (Plavix) outside and inside the United States |
| Bristol-Myers Squibb | Originator | Clopidogrel (Plavix) partner in the United States |
| Daiichi Sankyo | Originator | Prasugrel, with strong use in Japan |
| Bayer | Originator | Low-dose aspirin for cardiovascular prevention |
| Teva Pharmaceutical Industries Ltd | Generics | Generic ticagrelor 60 milligram launch in 2025 and generic clopidogrel |
| Sun Pharmaceutical Limited | Generics | Generic P2Y12 inhibitors and combinations in India and export markets |
| Cipla Limited | Generics | Generic clopidogrel, ticagrelor and aspirin combinations |
| USV | Generics | Low-dose aspirin and cardiac combinations in India |
Volume outpaces value as generics cover oral P2Y12 agents
Credence Research's view is that value in antiplatelet drugs will grow more slowly than prescription volume through 2035, because generic competition now covers every major oral agent. The overall market still grows at 5.11% a year, supported by rising procedure rates in Asia and an aging patient base in high-income countries. The best value opportunities sit in injectable and self-administered agents that move treatment ahead of hospital arrival. Companies that pair low-cost generics with wide pharmacy reach will hold volume, while innovators need strong outcomes data to justify premium prices.
How Credence Research sized platelet inhibitor spending
The report uses 2025 as the base year and 2026 to 2035 as the forecast period. Market values come from the Credence Research model, which builds spending by drug, indication, route of administration and distribution channel. Regional and segment splits are Credence Research estimates informed by Medicare Part D spending data, World Health Organization statistics, clinical guidelines, regulator decisions and company press releases. No primary interviews or surveys were used in preparing this edition of the report.
Platelet inhibitor spending outlook to 2035
By 2035, the antiplatelet drugs market is projected to reach USD 7.24 billion, with growth led by procedure volumes in Asia Pacific and by new injectable agents. Oral P2Y12 inhibitors will remain the core of therapy, but generic prices will keep value per prescription low in most countries. Pre-hospital treatment could become a meaningful niche if regulators approve the subcutaneous agents now under review. North America keeps the highest value per patient, while Asia Pacific adds the most new users. As a result, advantage will depend on outcomes data, manufacturing cost and pharmacy reach.
Frequently Asked Questions
How big is the global antiplatelet drugs market?
Which drug leads the antiplatelet drugs market?
Which region leads antiplatelet spending?
How has generic ticagrelor changed the market?
Which indication accounts for the most spending?
What new antiplatelet therapies are in development?
Who are the leading antiplatelet drug companies?
What restrains growth in antiplatelet drugs?
Table of Content
Chapter 1 Market Segmentation
- 1.1 Segmentation Framework
- 1.1.1 Product and Service Classification
- 1.1.2 Application and End-Use Classification
- 1.1.3 Technology and Solution Classification
- 1.1.4 Customer and Distribution Channel Classification
- 1.1.5 Geographic Segmentation
- 1.1.6 Market Segment Definitions and Boundaries
- 1.2 By Drug
- 1.2.1 Clopidogrel
- 1.2.2 Ticagrelor
- 1.2.3 Aspirin
- 1.2.4 Prasugrel
- 1.2.5 Others
- 1.3 By Indication
- 1.3.1 Myocardial Infarction
- 1.3.2 Percutaneous Coronary Interventions
- 1.3.3 Arterial Thrombosis
- 1.3.4 Others
- 1.4 By Route of Administration
- 1.4.1 Oral
- 1.4.2 Injectable
Chapter 2 Introduction
- 2.1 Report Objectives and Scope
- 2.2 Product Definition and Industry Terminology
- 2.3 Market Inclusions and Exclusions
- 2.4 Research Process
- 2.4.1 Primary Research and Expert Interviews
- 2.4.2 Secondary Research and Source Review
- 2.4.3 Top-Down and Bottom-Up Estimation
- 2.4.4 Data Triangulation and Verification
- 2.5 Market Size Measurement Basis
- 2.5.1 2025: USD 4.40 billion → 2035: USD 7.24 billion
- 2.6 Historical and Forecast Reference Periods
- 2.6.1 Historical Period: 2018-2025
- 2.6.2 Base Year: 2025
- 2.6.3 Forecast Period: 2025-2035
- 2.7 Research Assumptions and Limitations
Chapter 3 Executive Summary
- 3.1 Market Snapshot and Key Findings
- 3.2 Base-Year Market Size, 2025
- 3.3 Forecast Market Size, 2035
- 3.4 Revenue and Volume Growth Outlook
- 3.5 Key Demand and Supply Indicators
- 3.6 Leading Market Segments
- 3.7 Fastest-Growing Market Opportunities
- 3.8 Regional Performance Highlights
- 3.9 Technology and Industry Transformation
- 3.10 Competitive Landscape Summary
- 3.11 Analyst View and Strategic Implications
Chapter 4 Global Antiplatelet Drugs Market Trends and Developments
- 4.1 Historical Industry Development, 2018-2025
- 4.2 Recent Market Trends and Developments
- 4.3 Demand and Customer Behavior Trends
- 4.4 Technology and Product Innovation
- 4.5 Artificial Intelligence, Automation and Digitalization
- 4.6 Local Manufacturing and Supply Chain Realignment
- 4.7 Industry Partnerships, Mergers and Acquisitions
- 4.8 Sustainability and Circular Economy Developments
- 4.9 Government and Private Sector Investment Trends
- 4.10 Emerging Business Models and Commercialization
- 4.11 Industry Developments and Announcements
Chapter 5 Global Antiplatelet Drugs Market Production, Supply and Demand Analysis
- 5.1 Demand Trend and Consumption Analysis, 2018-2025
- 5.2 Demand Forecast, 2025-2035
- 5.3 Production and Output Trend, 2018-2025
- 5.4 Production and Output Forecast, 2025-2035
- 5.5 Installed Capacity and Capacity Utilization
- 5.6 Company-Wise Production Plants and Statistics
- 5.6.1 Installed Production Capacity
- 5.6.2 Actual Production
- 5.6.3 Planned Capacity and Expansion Targets
- 5.7 Supply Chain Structure and Procurement Trends
- 5.8 Supply-Demand Gap and Bottlenecks
- 5.9 Import Dependence and Sourcing Structure
- 5.10 Contract Manufacturing and Outsourcing
- 5.11 Regional Supply and Demand Concentration
Chapter 6 Global Antiplatelet Drugs Market Pricing Analysis
- 6.1 Pricing Structure and Measurement
- 6.2 Historical Pricing Trends, 2018-2025
- 6.3 Pricing Outlook, 2025-2035
- 6.4 Average Selling Price and Unit Economics
- 6.5 Pricing by Product and Market Segment
- 6.6 Geographic Pricing Differences
- 6.7 Key Input, Energy, Labor and Logistics Costs
- 6.8 Contract Pricing and Purchasing Models
- 6.9 Pricing Sensitivity and Competitive Positioning
- 6.10 Price, Margin and Profitability Implications
Chapter 7 Global Antiplatelet Drugs Market Dynamics
- 7.1 Market Growth Drivers
- 7.1.1 Demand-Side Drivers
- 7.1.2 Technology and Innovation Drivers
- 7.1.3 Infrastructure and Investment Drivers
- 7.1.4 Regulatory and Policy Drivers
- 7.2 Market Restraints
- 7.2.1 Cost and Affordability Constraints
- 7.2.2 Technology and Adoption Barriers
- 7.2.3 Supply Chain and Operational Constraints
- 7.3 Market Challenges
- 7.3.1 Competitive Pressure and Margin Erosion
- 7.3.2 Skills, Infrastructure and Implementation Gaps
- 7.4 Emerging Market Opportunities
- 7.5 Market Dynamics Impact and Time-Horizon Assessment
Chapter 8 Global Antiplatelet Drugs Value Chain Analysis
- 8.1 Industry Value Chain Overview
- 8.2 Upstream Suppliers and Critical Inputs
- 8.3 Technology and Component Providers
- 8.4 Manufacturing or Service Delivery
- 8.5 Distribution, Channel Partners and Integrators
- 8.6 Downstream Applications and End Users
- 8.7 Value Addition and Profit Pools
- 8.8 Vertical Integration and Outsourcing
- 8.9 Supplier Concentration and Risk
- 8.10 Supply Chain Localization and Resilience
Chapter 9 Global Antiplatelet Drugs Market Regulations and Policies
- 9.1 Relevant Laws, Standards and Compliance Frameworks
- 9.2 Product, Service, Safety and Quality Requirements
- 9.3 Government Policies, Incentives and Subsidies
- 9.4 Imports, Exports and Trade Barriers
- 9.5 Public Procurement and Local Content Requirements
- 9.6 Environmental and Sustainability Compliance
- 9.7 Upcoming Policy Changes and Market Implications
Chapter 10 Global Antiplatelet Drugs Market Hotspots and Opportunities
- 10.1 Market Opportunity Mapping and Growth Hotspots
- 10.2 High-Growth Applications and Customer Groups
- 10.3 Underserved Markets and White-Space Opportunities
- 10.4 Emerging Technology and Product Opportunities
- 10.5 New Capacity and Investment Hotspots
- 10.6 Market Entry and Expansion Opportunities
- 10.7 Distribution and Partnership Opportunities
- 10.8 Near-Term and Long-Term Commercial Potential
- 10.9 Opportunity Attractiveness and Execution Risks
Chapter 11 Global Antiplatelet Drugs Market Outlook, 2025-2035
- 11.1 Market Size and Analysis
- 11.1.1 Revenue (Market Measurement: 2025: USD 4.40 billion → 2035: USD 7.24 billion)
- 11.1.2 Market Volume and Quantity Sold
- 11.1.3 Historical Market Size, 2018-2025
- 11.1.4 Base-Year Market Size, 2025
- 11.2 Market Forecast, 2025-2035
- 11.2.1 Revenue Forecast to 2035
- 11.2.2 Volume Forecast to 2035
- 11.2.3 CAGR and Year-on-Year Growth
- 11.2.4 Incremental Revenue Opportunity
- 11.3 Forecast Assumptions and Scenario Analysis
- 11.3.1 Base-Case Forecast
- 11.3.2 Optimistic and Conservative Scenarios
- 11.3.3 Technology, Pricing and Policy Sensitivities
- 11.4 Market Attractiveness and Growth Outlook
Chapter 12 Global Antiplatelet Drugs Market Segmentation and Outlook
- 12.1 Segmentation Summary and Market Shares, 2025
- 12.2 Largest and Fastest-Growing Segments
- 12.3 By Drug - Market Size and Forecast, 2025-2035
- 12.3.1 Segment Definition and Scope
- 12.3.2 Historical Market Size, 2018-2025
- 12.3.3 Revenue Forecast, 2025-2035
- 12.3.4 Volume Forecast, 2025-2035
- 12.3.5 Base-Year Market Share, 2025
- 12.3.6 Segment CAGR and Growth Drivers
- 12.3.7 Subsegment Market Size and Forecast
- 12.3.7.1 Clopidogrel
- 12.3.7.2 Ticagrelor
- 12.3.7.3 Aspirin
- 12.3.7.4 Prasugrel
- 12.3.7.5 Others
- 12.3.8 Subsegment Pricing and Adoption Trends
- 12.3.9 Leading Suppliers and Competition
- 12.3.10 Regional Demand and Opportunities
- 12.4 By Indication - Market Size and Forecast, 2025-2035
- 12.4.1 Segment Definition and Scope
- 12.4.2 Historical Market Size, 2018-2025
- 12.4.3 Revenue Forecast, 2025-2035
- 12.4.4 Volume Forecast, 2025-2035
- 12.4.5 Base-Year Market Share, 2025
- 12.4.6 Segment CAGR and Growth Drivers
- 12.4.7 Subsegment Market Size and Forecast
- 12.4.7.1 Myocardial Infarction
- 12.4.7.2 Percutaneous Coronary Interventions
- 12.4.7.3 Arterial Thrombosis
- 12.4.7.4 Others
- 12.4.8 Subsegment Pricing and Adoption Trends
- 12.4.9 Leading Suppliers and Competition
- 12.4.10 Regional Demand and Opportunities
- 12.5 By Route of Administration - Market Size and Forecast, 2025-2035
- 12.5.1 Segment Definition and Scope
- 12.5.2 Historical Market Size, 2018-2025
- 12.5.3 Revenue Forecast, 2025-2035
- 12.5.4 Volume Forecast, 2025-2035
- 12.5.5 Base-Year Market Share, 2025
- 12.5.6 Segment CAGR and Growth Drivers
- 12.5.7 Subsegment Market Size and Forecast
- 12.5.7.1 Oral
- 12.5.7.2 Injectable
- 12.5.8 Subsegment Pricing and Adoption Trends
- 12.5.9 Leading Suppliers and Competition
- 12.5.10 Regional Demand and Opportunities
- 12.6 Segment Growth Comparison
- 12.7 Segment Attractiveness and Priority Matrix
Chapter 13 Global Antiplatelet Drugs Geographic Market Outlook, 2025-2035
- 13.1 Regional Market Size and Share, 2025
- 13.2 Regional Market Forecast, 2025-2035
- 13.3 Regional Pricing, Production and Demand Differences
- 13.4 North America
- 13.4.1 United States
- 13.4.2 Canada
- 13.4.3 Mexico
- 13.5 Europe
- 13.5.1 Germany
- 13.5.2 France
- 13.5.3 Italy
- 13.5.4 United Kingdom
- 13.5.5 Spain
- 13.5.6 Poland
- 13.5.7 Russia
- 13.5.8 Netherlands
- 13.5.9 Belgium
- 13.5.10 Sweden
- 13.5.11 Denmark
- 13.5.12 Norway
- 13.5.13 Rest of Europe
- 13.6 Asia Pacific
- 13.6.1 China
- 13.6.2 India
- 13.6.3 Japan
- 13.6.4 South Korea
- 13.6.5 Thailand
- 13.6.6 Indonesia
- 13.6.7 Vietnam
- 13.6.8 Malaysia
- 13.6.9 Australia
- 13.6.10 Rest of Asia Pacific
- 13.7 Latin America
- 13.7.1 Brazil
- 13.7.2 Argentina
- 13.7.3 Colombia
- 13.7.4 Chile
- 13.7.5 Rest of Latin America
- 13.8 Middle East
- 13.8.1 Saudi Arabia
- 13.8.2 United Arab Emirates
- 13.8.3 Turkey
- 13.8.4 Israel
- 13.8.5 Iran
- 13.8.6 Rest of the Middle East
- 13.9 Africa
- 13.9.1 South Africa
- 13.9.2 Egypt
- 13.9.3 Nigeria
- 13.9.4 Morocco
- 13.9.5 Rest of Africa
- 13.10 Regional Investment, Policy and Supply Chain Differences
- 13.11 Regional Competitive Landscape
- 13.12 Geographic Growth Hotspots
Chapter 14 Global Antiplatelet Drugs Technology, Innovation and Sustainability Outlook
- 14.1 Technology Landscape and Maturity
- 14.2 Product, Process and Service Innovation
- 14.3 AI, Automation and Digital Tools in the Industry
- 14.4 Technology Adoption and Performance Benchmarking
- 14.5 Innovation Pipeline and R&D Investment
- 14.6 Patent and Intellectual Property Trends
- 14.7 Energy Efficiency and Resource Management
- 14.8 Sustainability, Recycling and Circularity
- 14.9 Technology Roadmap, 2025-2035
- 14.10 Risks of Obsolescence and Technology Substitution
Chapter 15 Global Antiplatelet Drugs Market Key Strategic Imperatives
- 15.1 Growth and Market Entry Priorities
- 15.2 High-Return Products and Segments
- 15.3 Pricing, Profitability and Cost Optimization
- 15.4 Technology Investment and Product Differentiation
- 15.5 Supply Chain Localization and Resilience
- 15.6 Distribution and Customer Acquisition
- 15.7 Partnership, Acquisition and Capacity Strategy
- 15.8 Regional Expansion Priorities
- 15.9 Short-, Medium- and Long-Term Actions
Chapter 16 Competition Outlook
- 16.1 Industry Competition Characteristics
- 16.2 Market Structure and Concentration
- 16.3 Market Share and Competitive Positioning, 2025
- 16.4 Company-Wise Revenue and Product Benchmarking
- 16.5 Production and Service Capacity Benchmarking
- 16.6 Technology, Pricing and Differentiation
- 16.7 Regional Footprint and Distribution Strength
- 16.8 Mergers, Acquisitions and Strategic Alliances
- 16.9 New Entrants and Competitive Threats
- 16.10 Porter's Five Forces and Industry Attractiveness
- 16.11 Competitive Outlook, 2025-2035
Chapter 17 Company Profiles
- 17.1 Company Coverage and Selection Criteria
- 17.2 AstraZeneca
- 17.2.1 Business Description
- 17.2.2 Company Ownership and Geographic Presence
- 17.2.3 Product and Service Portfolio
- 17.2.4 Manufacturing and Operating Footprint
- 17.2.5 Production Capacity and Expansion Plans
- 17.2.6 Financial Performance and Investment
- 17.2.7 Market Share and Competitive Position
- 17.2.8 Technology and Innovation Capabilities
- 17.2.9 Strategic Alliances or Partnerships
- 17.2.10 Recent Developments
- 17.2.11 Growth Strategy and Outlook
- 17.3 Bayer
- 17.4 Sanofi
- 17.5 Bristol-Myers Squibb
- 17.6 Daiichi Sankyo
- 17.7 Sun Pharmaceutical Limited
- 17.8 Cipla Limited
- 17.9 USV
- 17.10 Teva Pharmaceutical Industries Ltd
- 17.11 Other Relevant Market Participants
Note: Every listed company is profiled on the structure shown under the first company. The company list is preliminary and may change based on research findings, market developments, data availability and client requirements.
Chapter 18 Disclaimer
- 18.1 Research and Forecast Disclaimer
- 18.2 Data Source and Estimation Limitations
Note: The depth of individual sections depends on data availability for this market. Volume, capacity, trade and other unit-based metrics are included where applicable.

