
Anti-allergy drugs move from tablets to targeted therapy
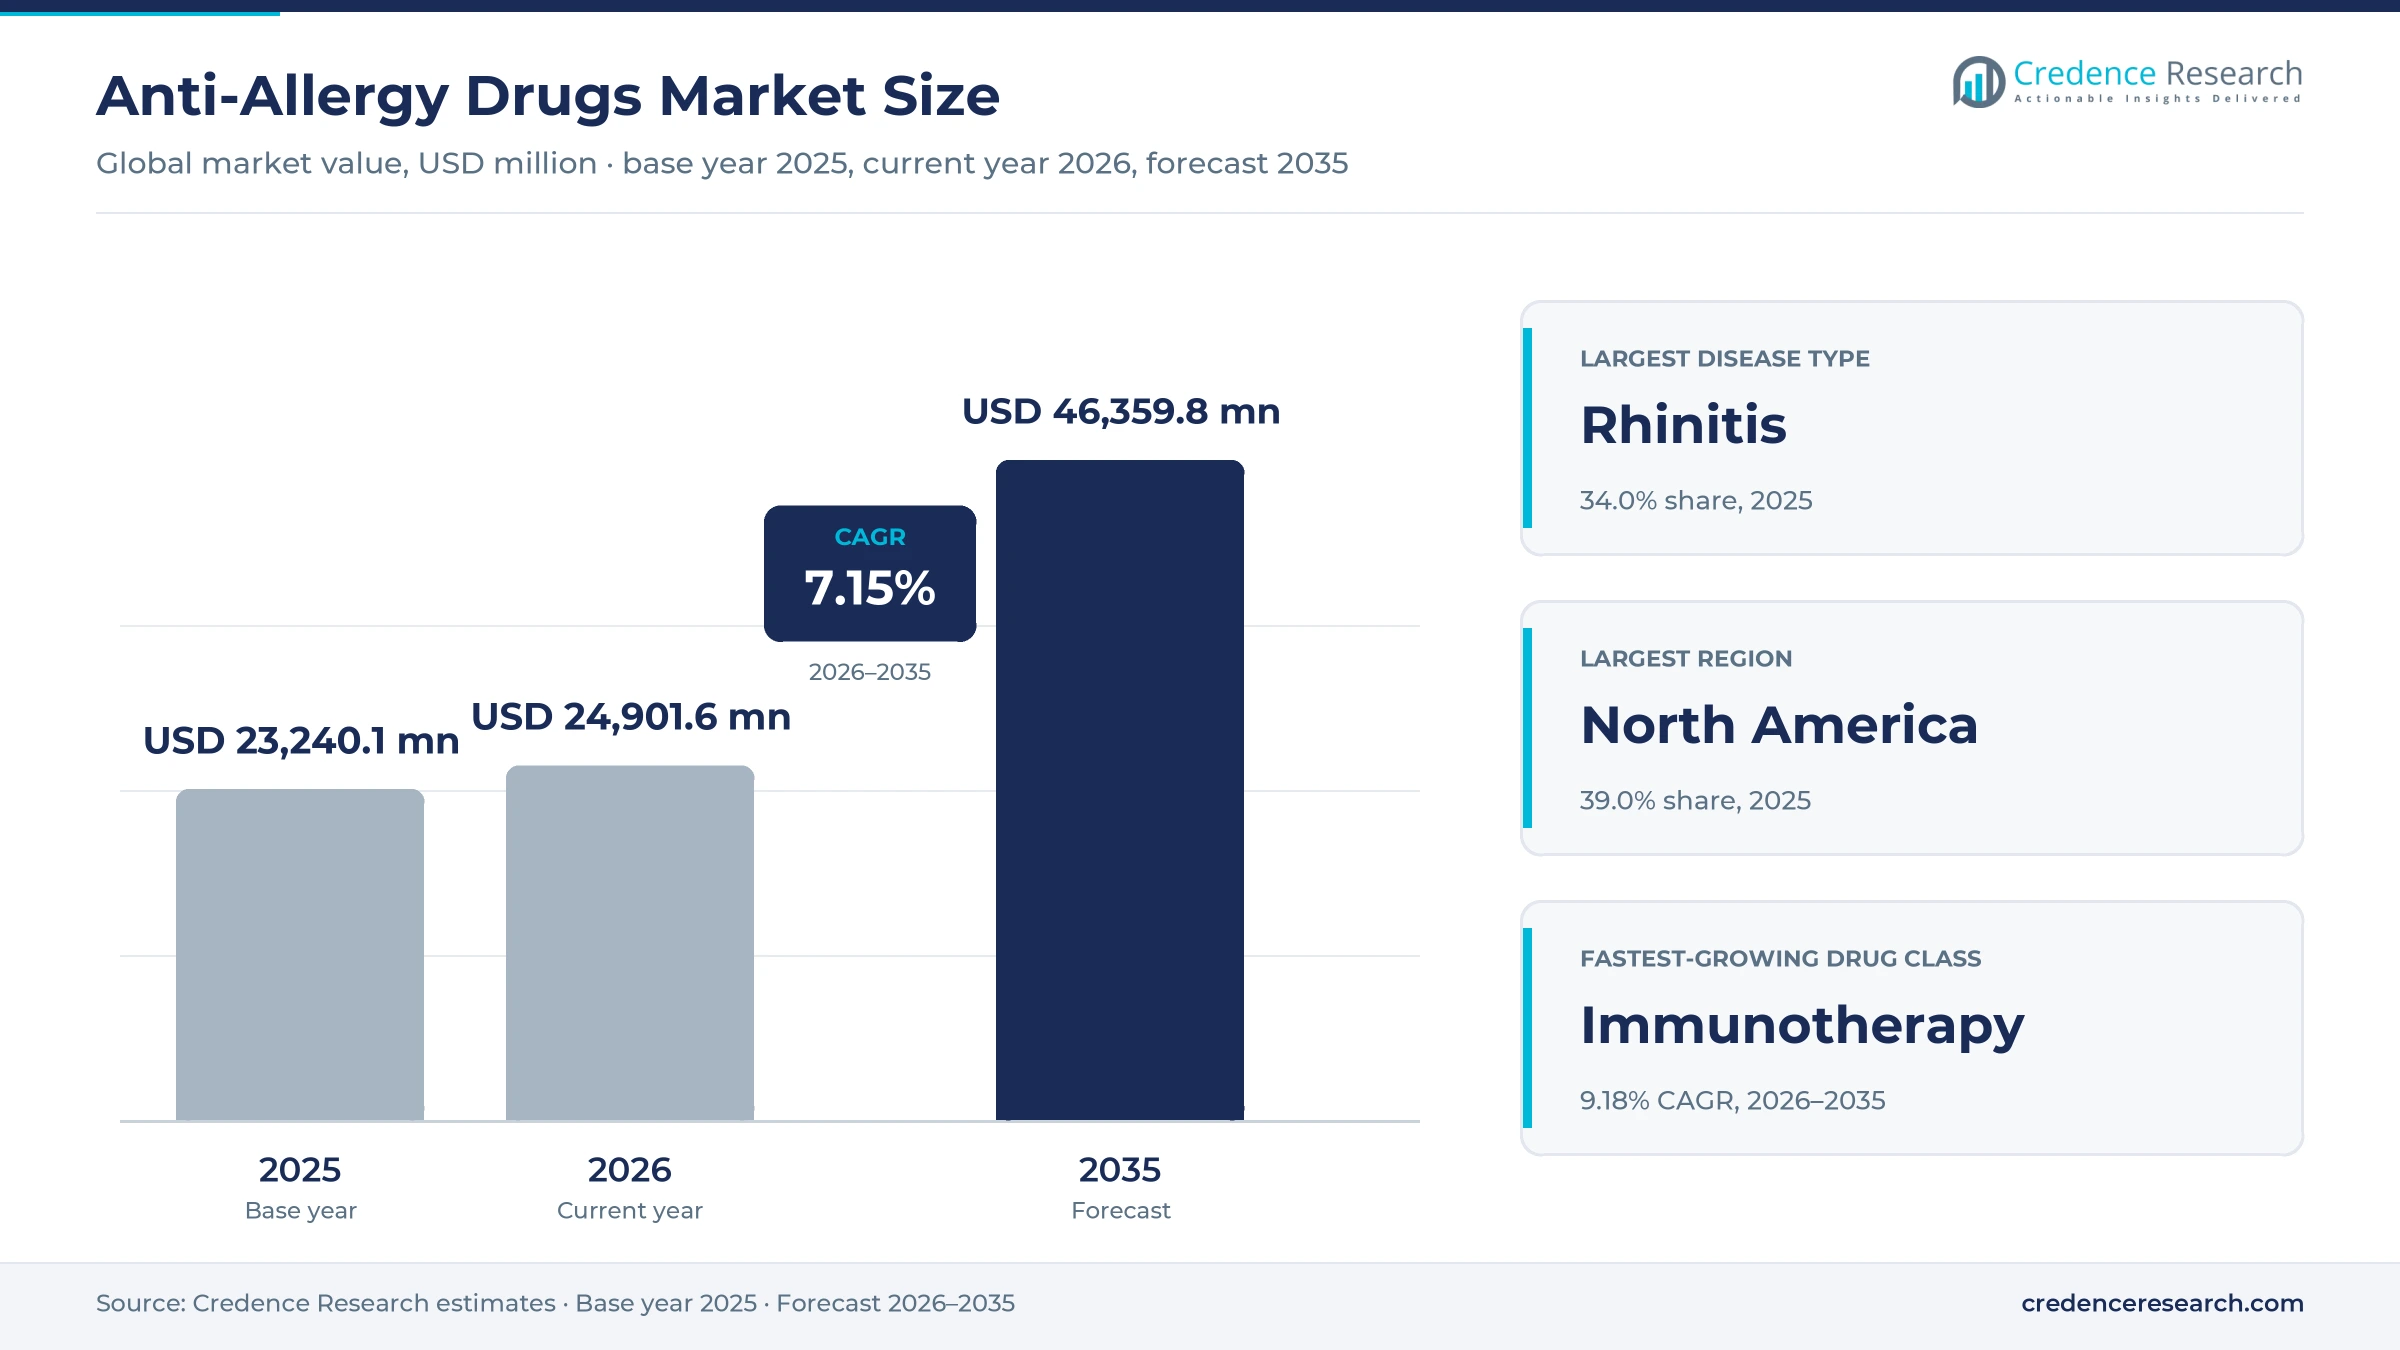
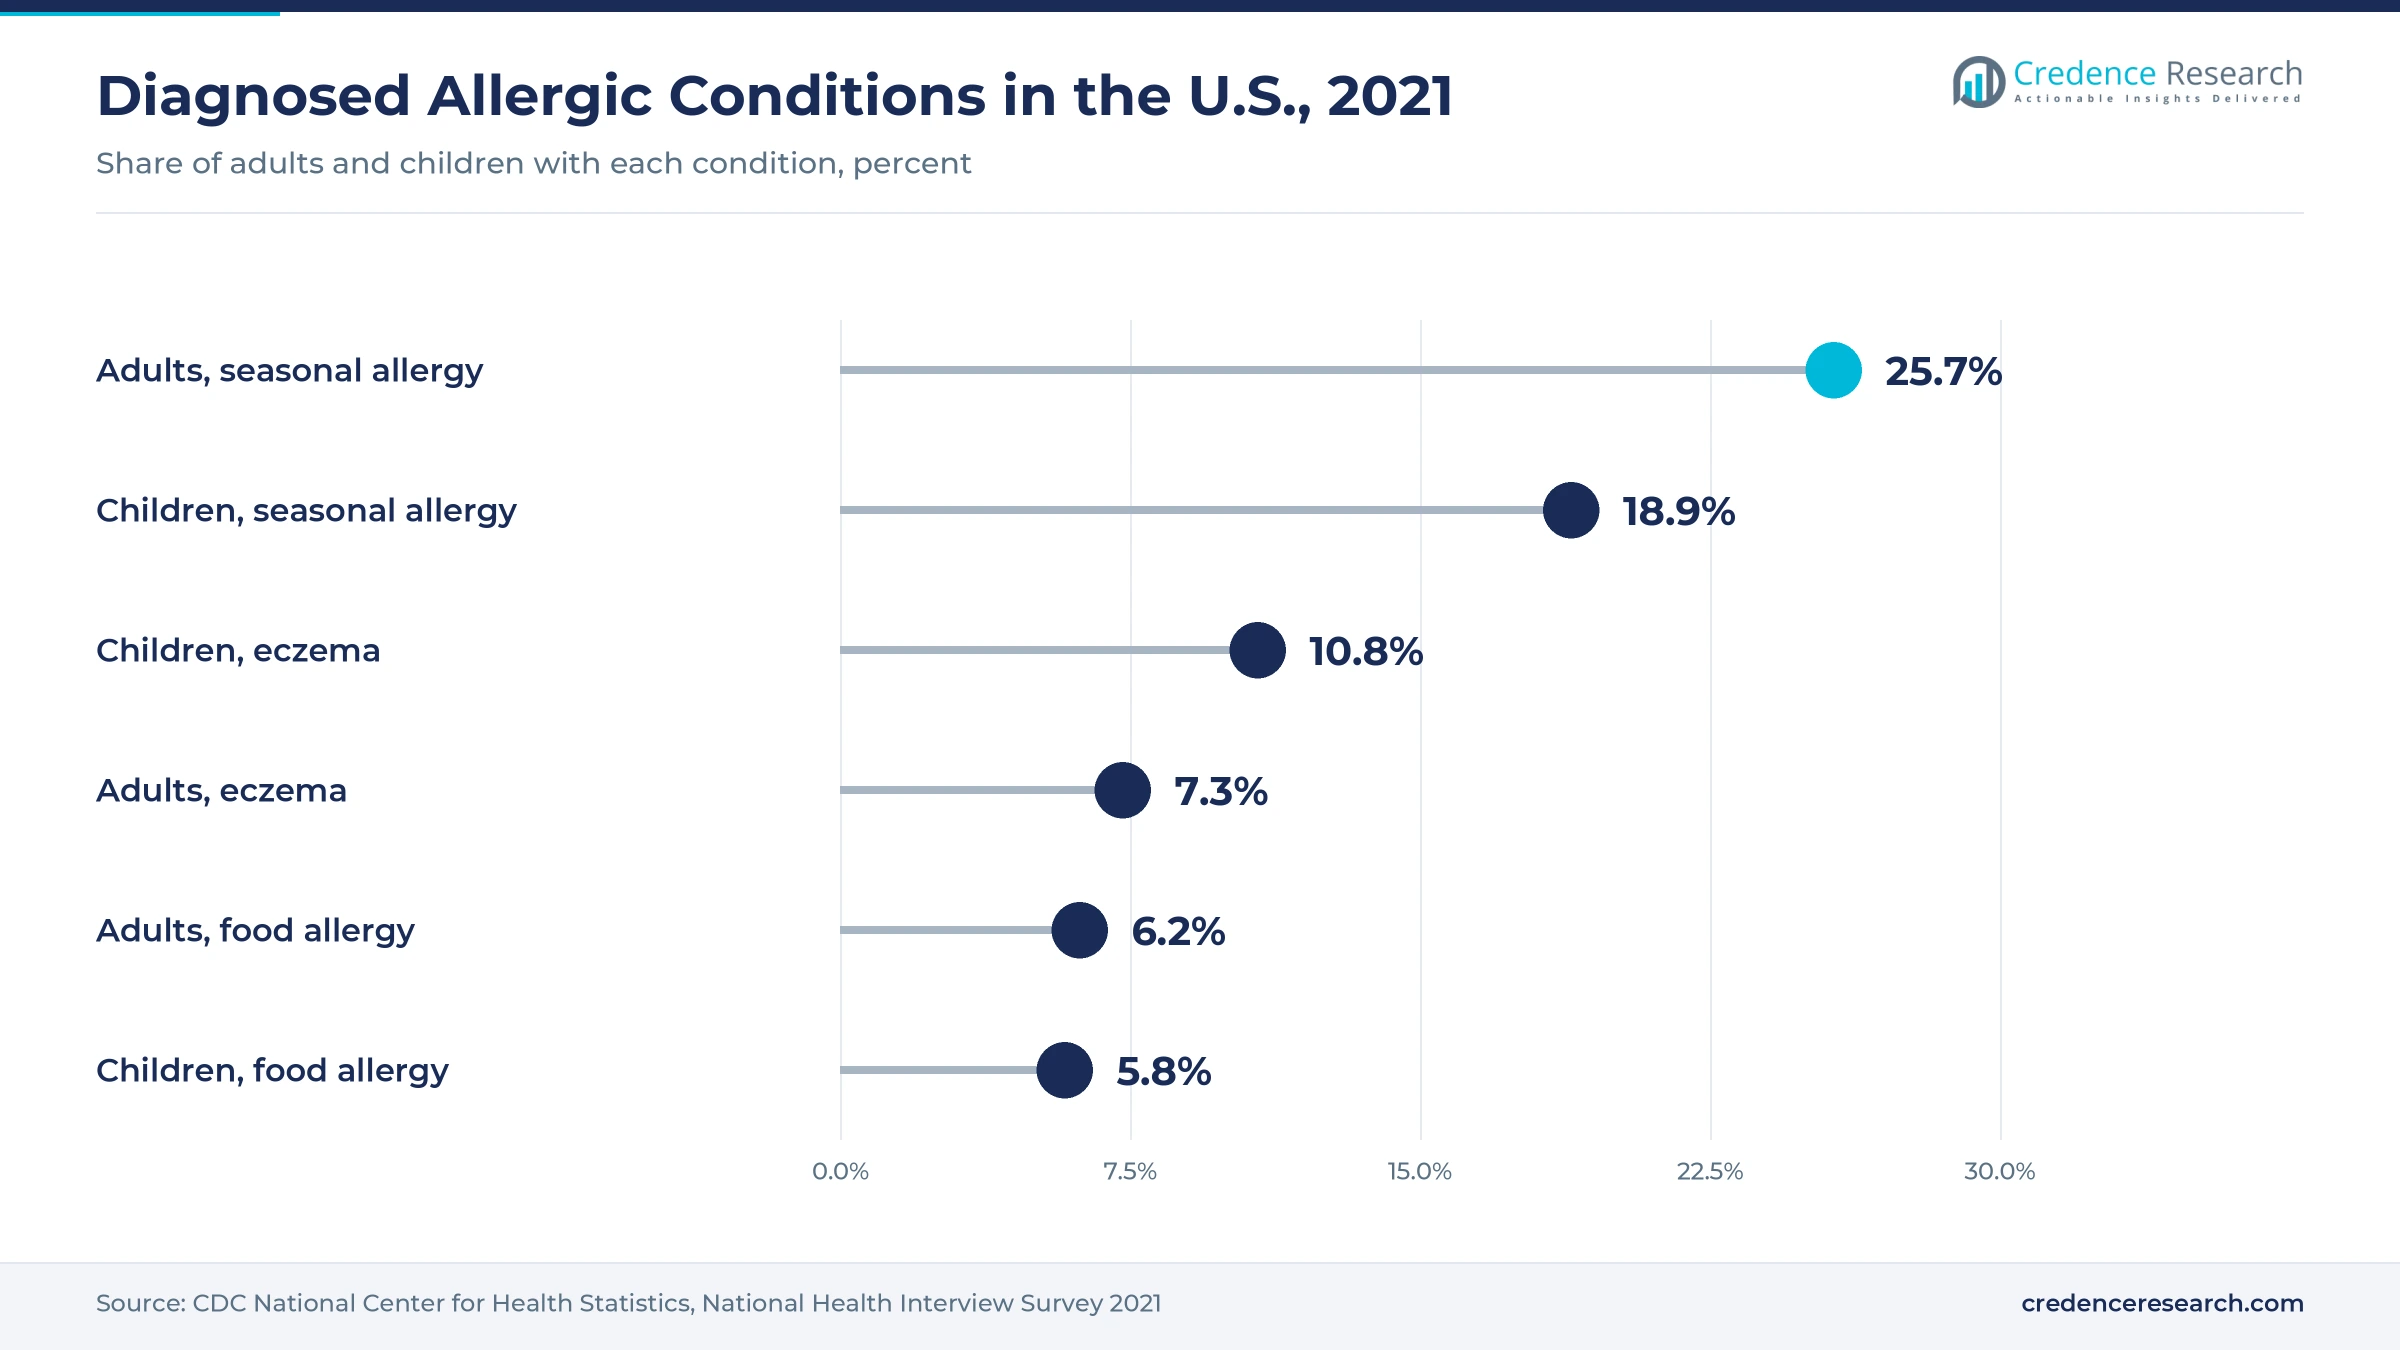
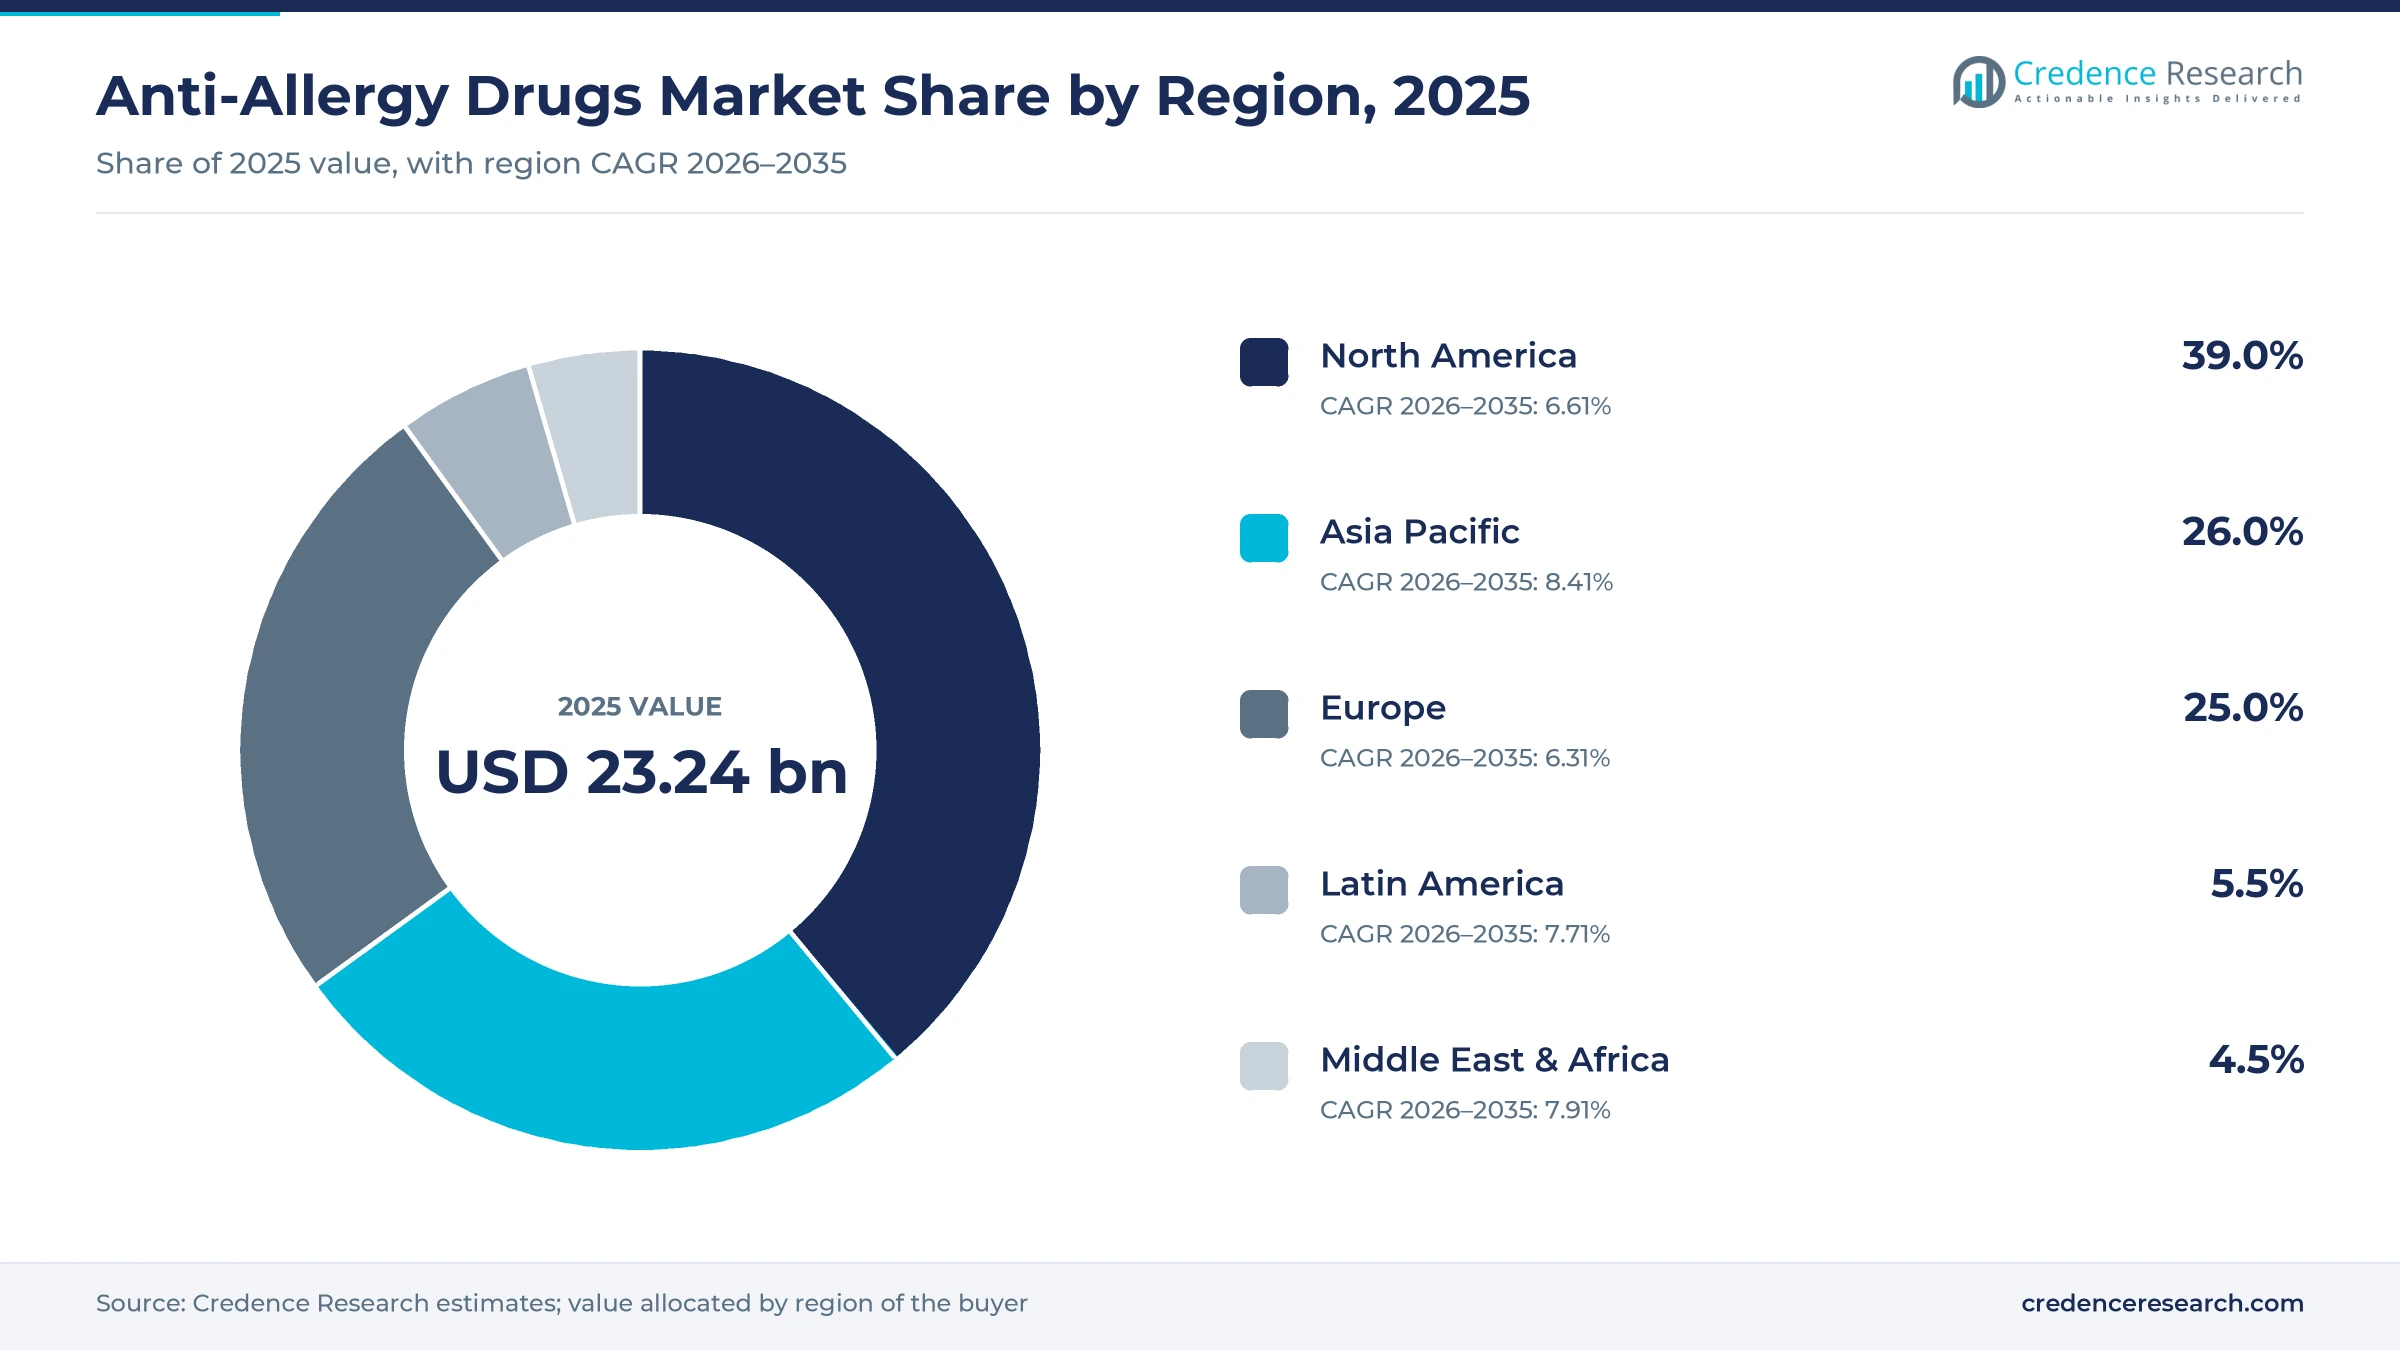
The global anti-allergy drugs market was valued at USD 23.24 billion in 2025 and is projected to increase from USD 24.90 billion in 2026 to USD 46.36 billion by 2035, registering a CAGR of 7.15% during 2026–2035. Demand comes from hay fever, allergic asthma, eye allergy, eczema, hives and food allergy, conditions that affect a large share of children and adults in every region. In the U.S., 25.7% of adults reported a diagnosed seasonal allergy in 2021, according to national health survey data. North America held the largest regional share, 39.0% in 2025, on high diagnosis rates, broad OTC access and early uptake of biologics. Asia Pacific is the fastest-growing region at 8.41% a year as urban pollution, rising diagnosis and wider insurance coverage expand treated populations in China and India. The main commercial change is the arrival of needle-free epinephrine and the first drug approved to reduce reactions across multiple food allergies.
What does the anti-allergy drugs market include and exclude?
The market counts manufacturer revenue from prescription and over-the-counter medicines used to prevent or relieve allergic disease. It covers oral, nasal and eye-drop antihistamines, intranasal and topical corticosteroids, allergen immunotherapy tablets, drops and injections, decongestants, fixed-dose combinations, anti-IgE antibodies used in allergic disease, and epinephrine for anaphylaxis. Buyers include retail and online pharmacies, hospital pharmacies, allergists and public health insurers.
The scope excludes allergy diagnostics such as skin-prick and specific IgE tests, air purifiers and other devices, and biologics prescribed mainly for non-allergic inflammatory disease. Cough and cold remedies sold without an allergy claim are also excluded from the market value.
Anti-Allergy Drugs Market Insights
- The anti-allergy drugs market grows from USD 23.24 billion in 2025 to USD 46.36 billion by 2035, a 7.15% CAGR over 2026–2035, as diagnosis rates and prescription innovation rise.
- North America held 39.0% of global anti-allergy drug value in 2025, backed by high diagnosis rates, wide OTC access and early adoption of biologics.
- Rhinitis led disease types with 34.0% of 2025 value, because hay fever affects large shares of children and adults and is treated every season.
- The FDA approved Xolair for IgE-mediated food allergy in February 2024 and neffy nasal epinephrine in August 2024, opening premium food allergy and anaphylaxis segments.
- ALK-Abello agreed in November 2024 to pay USD 145 million upfront for neffy rights outside the U.S., moving an allergen specialist into emergency treatment.
Rhinitis and antihistamines lead while immunotherapy climbs
Why does rhinitis hold the largest share?
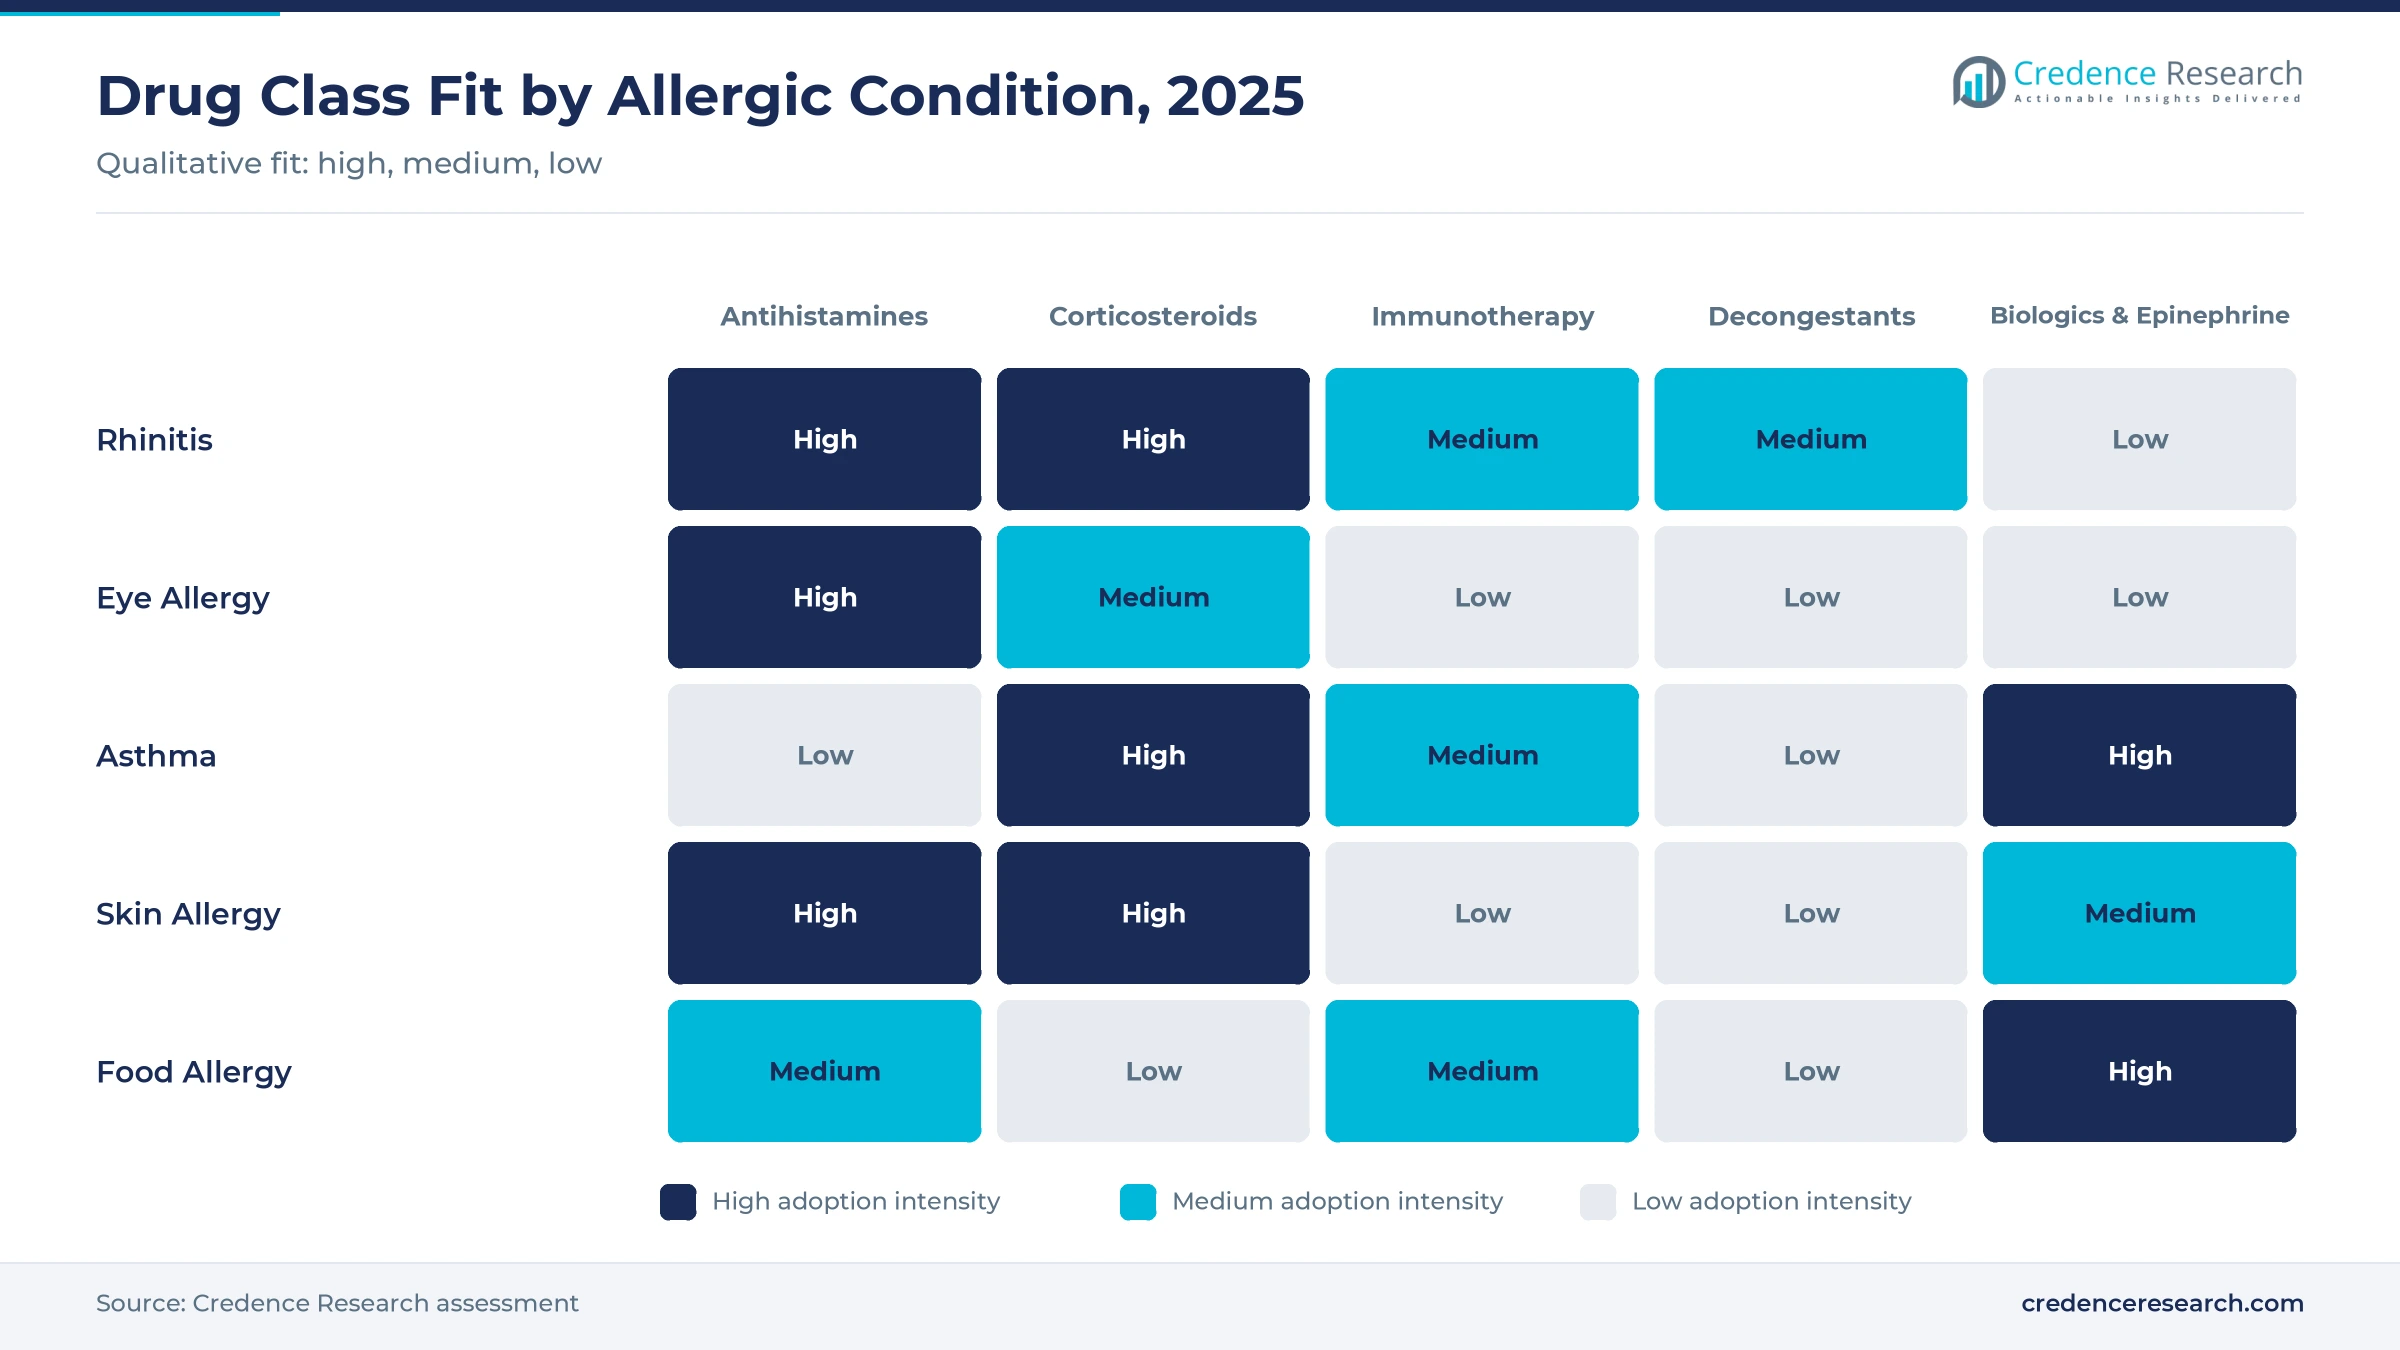
Based on disease type, the market is categorized into rhinitis, eye allergy, asthma, skin allergy and food allergy and others. Rhinitis led with a 34.0% share of 2025 value, because seasonal and perennial hay fever drives repeat purchases of tablets and nasal sprays every year. Food Allergy and Others grows fastest at 9.46% a year through 2035, as anti-IgE therapy for multiple food allergies and needle-free epinephrine widen treatment for families managing anaphylaxis risk.
Which drug class leads, and which grows fastest?
Based on drug class, the market is categorized into antihistamines, corticosteroids, immunotherapy, decongestants, combination therapy and other drugs, including anti-IgE antibodies and epinephrine. Antihistamines led with a 30.0% share of 2025 value, because cetirizine, loratadine and fexofenadine are the first choice for most allergy sufferers. Immunotherapy grows fastest at 9.18% a year, as sublingual immunotherapy tablets for grass, ragweed, tree pollen and house dust mite allergy gain coverage in Europe, North America and Japan.
How do prescription and OTC products divide the value?
Based on drug type, the market is categorized into prescription (Rx) and over-the-counter (OTC) products. Rx products led with a 62.0% share of 2025 value and also grow faster at 7.45% a year, because biologics, immunotherapy, epinephrine devices and newer combination sprays require a prescriber. OTC sales remain large in volume, yet generic antihistamines and steroid sprays sell at low prices and face store-brand competition in retail pharmacies.
Where do patients buy allergy medicines?
Based on distribution channel, the market is categorized into hospital pharmacy, retail pharmacy, online pharmacy and others. Retail Pharmacy led with a 58.0% share of 2025 value, because most allergy medicines are refilled each season at chain and independent drugstores, often without a prescription. Online Pharmacy grows fastest at 9.45% a year, as e-commerce platforms, mail-order prescription services and subscription refills make repeat allergy purchases easier in the U.S., China and India.
| Segment Group | Leading Sub-segment | Share, 2025 | Fastest-growing Sub-segment | CAGR, 2026–2035 |
|---|---|---|---|---|
| By Disease Type | Rhinitis | 34.0% | Food Allergy and Others | 9.46% |
| By Drug Class | Antihistamines | 30.0% | Immunotherapy | 9.18% |
| By Drug Type | Rx | 62.0% | Rx | 7.45% |
| By Distribution Channel | Retail Pharmacy | 58.0% | Online Pharmacy | 9.45% |
Request a Free Sample
Fill in your details and we'll send you a free sample report.
- Sample data tables & charts
- Research methodology
Rising allergy prevalence, new approvals and OTC access
How large is the treated allergy population?
Allergic disease is common enough that small changes in diagnosis move large volumes of medicine. In 2021, 25.7% of U.S. adults had a diagnosed seasonal allergy, while 7.3% had eczema and 6.2% had food allergy, according to the National Center for Health Statistics. Among children, 18.9% had seasonal allergy, 10.8% had eczema and 5.8% had food allergy in the same survey year. Because many of these patients treat symptoms every season, prevalence translates directly into recurring demand for antihistamines, nasal sprays and eye drops.
Why does allergic asthma add prescription value?
Asthma remains one of the largest chronic respiratory conditions, and allergic triggers drive a large share of cases. The WHO estimates that asthma affected 363 million people in 2023 and caused 442,000 deaths, with most deaths in low- and lower-middle-income countries. Allergic asthma is treated with inhaled corticosteroids, leukotriene modifiers and, in severe cases, anti-IgE antibodies such as omalizumab. As diagnosis improves in Asia Pacific, Latin America and Africa, more patients move onto maintenance therapy, which supports growth of the asthma segment through 2035.
How do new approvals widen food allergy treatment?
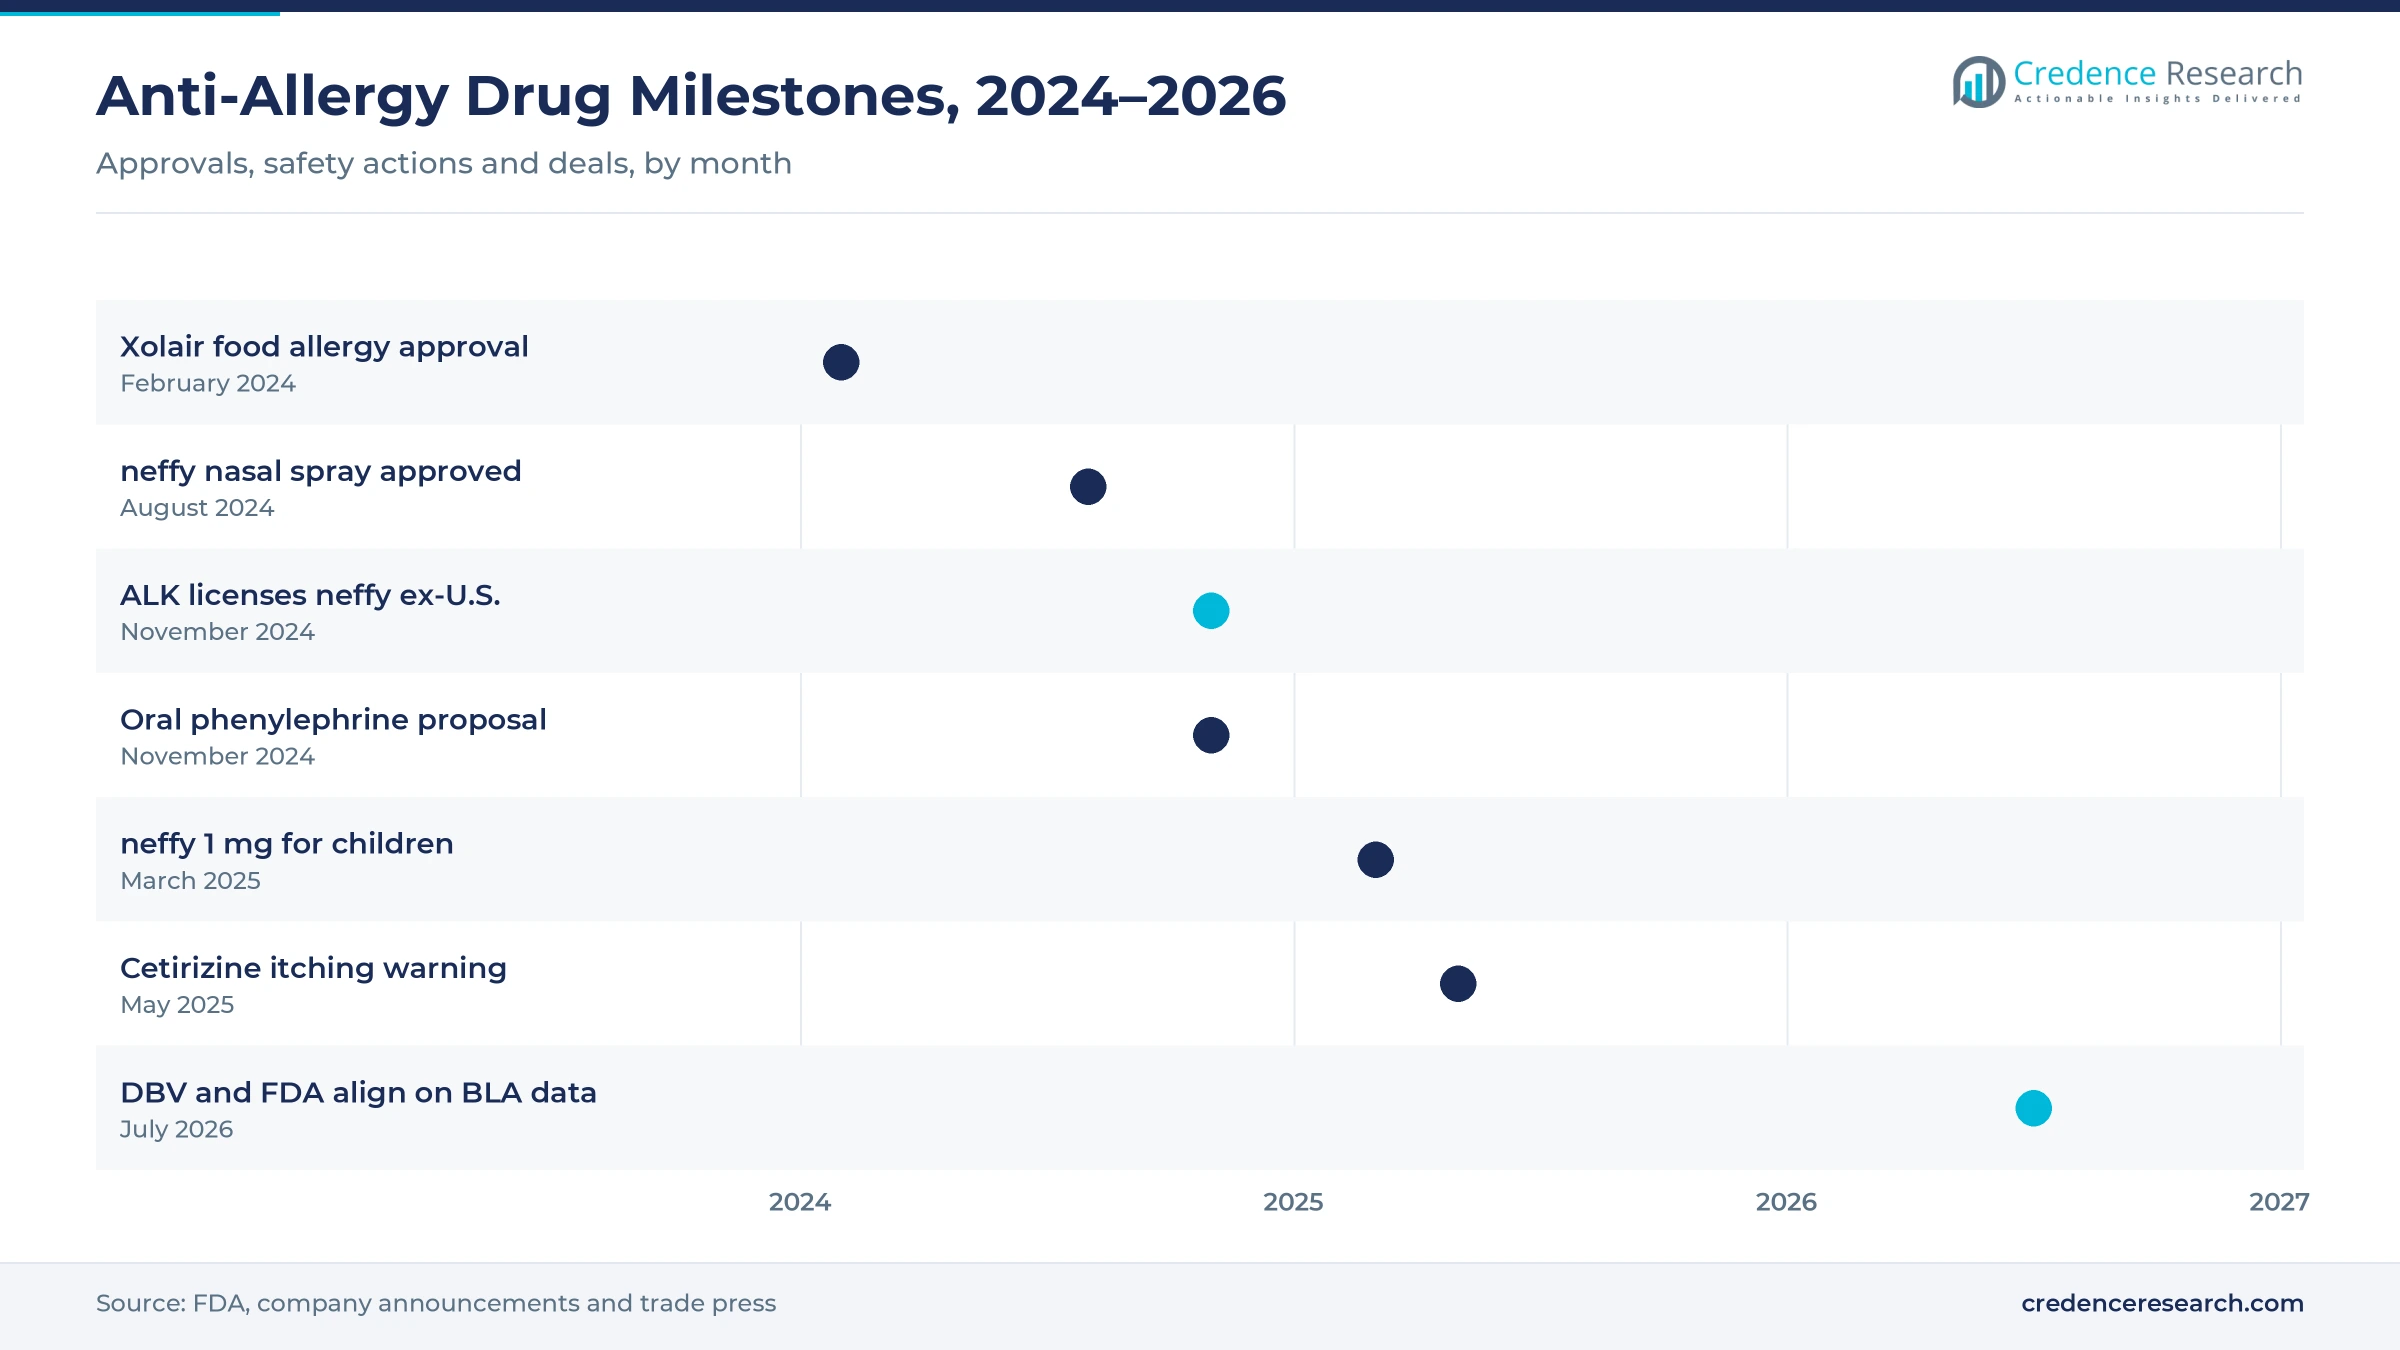
Food allergy had no approved drug to reduce reactions across several foods until recently, which left avoidance as the main defense. On Feb. 16, 2024, the FDA approved Xolair (omalizumab) for IgE-mediated food allergy in patients aged 1 year and older, to reduce allergic reactions after accidental exposure to one or more foods. Roche and Novartis market Xolair, which is given by injection every two or four weeks. As a result, allergists can offer a preventive biologic alongside avoidance and emergency epinephrine, which raises spending per food allergy patient.
Why does OTC access keep antihistamine volume high?
Most second-generation antihistamines and many intranasal steroids are sold without a prescription in the U.S., Europe and much of Asia. Self-care keeps volume high, because patients buy cetirizine, loratadine, fexofenadine and fluticasone sprays at drugstores, supermarkets and online stores each season. Switches from prescription to OTC status widen access but cut prices, so value grows more slowly than units. In turn, branded makers such as Bayer, which sells Claritin, rely on new formats, combination packs and pediatric products to defend shelf share.
Needle-free epinephrine, biologics and allergen tablets
Why is epinephrine moving to needle-free delivery?
Many patients and parents delay epinephrine injections because of needle fear, and needle-free options aim to close that gap. The FDA approved ARS Pharmaceuticals' neffy, the first epinephrine nasal spray for anaphylaxis, on Aug. 9, 2024, as a 2 mg dose for patients weighing at least 30 kilograms. In March 2025, a 1 mg dose followed for children weighing 15 to 30 kilograms, widening the pediatric reach of the product. This shift raises value per patient, because branded nasal devices are priced as premium products and are replaced when they expire.
How is allergen immunotherapy becoming easier to use?
Allergen immunotherapy is shifting from years of clinic injections to tablets and short courses that patients can manage with few visits. ALK-Abello sells sublingual tablets for grass, ragweed, tree pollen and house dust mite allergy in Europe, North America and Japan. In February 2025, Allergy Therapeutics reported a 20.3% reduction in combined symptom and medication scores versus placebo for its six-injection Grass MATA MPL course in a Phase III trial. These options make disease-modifying treatment more convenient, which supports the fastest growth among drug classes.
Where is the opening in peanut and multi-food allergy?
Peanut allergy remains a large unmet need, because strict avoidance is still the main defense for most affected children. In July 2026, DBV Technologies announced agreement with the FDA on the data package for its Viaskin Peanut patch, including six-month safety data from about 240 participants, and it plans to file a biologics license application in the fourth quarter of 2026. Approval would add an epicutaneous option for young children who cannot yet manage strict avoidance. Together with anti-IgE therapy and oral immunotherapy, such products create a growing prescription tier in food allergy.
Can online pharmacies and Asia Pacific widen access?
Online pharmacies and fast-growing middle-class markets offer an opening for both branded and generic suppliers of allergy medicines. In China and India, rising urban air pollution, more allergist clinics and wider insurance coverage are bringing undiagnosed patients into care. Cipla and Alembic Pharmaceuticals supply low-cost antihistamines, montelukast and nasal steroid generics across India and export markets, while e-pharmacies make repeat purchases easier. As a result, emerging markets offer volume growth even where prices stay low, especially for combination sprays and once-daily tablets.
Generic pricing, safety warnings and weak decongestants
How does generic competition hold down antihistamine prices?
Most leading antihistamines and intranasal corticosteroids lost patent protection years ago, and store brands now sit beside national brands on pharmacy shelves. Retail chains and online sellers compete hard on price, so revenue per pack keeps falling even as units grow. Branded makers must spend heavily on advertising to hold share, which limits margins for products such as Claritin and Zyrtec. This price pressure is the main reason antihistamines grow more slowly than the overall market through 2035.
Why did oral phenylephrine become a regulatory risk?
Decongestants face a regulatory challenge after the FDA concluded that oral phenylephrine does not work as a nasal decongestant at approved doses. On Nov. 7, 2024, the agency proposed removing oral phenylephrine from the OTC monograph, a step based on effectiveness rather than safety concerns. If the order is finalized, makers must reformulate or withdraw many multi-symptom allergy and cold products that rely on it. As a result, decongestants face the slowest growth among drug classes, while pseudoephedrine stays behind pharmacy counters in the U.S.
What do new safety warnings mean for long-term users?
Safety labeling can change how patients use common allergy drugs that many people take for years at a time. In May 2025, the FDA required a warning about rare but severe itching, or pruritus, after stopping long-term daily use of cetirizine or levocetirizine, on both prescribing information and OTC Drug Facts labels. The agency noted that cases occurred in patients who used these medicines daily for months or years. This risk may push some patients toward other antihistamines or nasal steroids, shifting share within the class rather than shrinking it.
Why do biologic costs restrain access?
Biologics for allergic asthma, hives and food allergy cost far more than tablets or sprays, and insurers often require prior authorization and step therapy. Public payers in Europe, Latin America and Asia limit coverage to severe cases, which keeps most allergy patients on generic drugs. Immunotherapy faces a similar barrier, because a full course usually lasts at least 36 months and needs consistent adherence. These cost and access hurdles restrain the pace at which premium therapies replace older treatment, especially in public health systems.
North America leads while Asia Pacific grows fastest
| Region | Value, 2025 (USD billion) | Share, 2025 | CAGR, 2026–2035 |
|---|---|---|---|
| North America | 9.06 | 39.0% | 6.61% |
| Asia Pacific | 6.04 | 26.0% | 8.41% |
| Europe | 5.81 | 25.0% | 6.31% |
| Latin America | 1.28 | 5.5% | 7.71% |
| Middle East & Africa | 1.05 | 4.5% | 7.91% |
North America leads on prescription innovation
North America held a 39.0% share of 2025 value and grows at 6.61% a year through 2035. The U.S. leads on spending per patient, with broad OTC access to antihistamines and nasal steroids and early use of biologics such as omalizumab. New products such as neffy nasal epinephrine and anti-IgE therapy for food allergy reached the U.S. market first, which keeps the region ahead on premium prescriptions. However, store brands and price competition at large drugstore chains limit value growth in OTC categories.
Europe anchors allergen immunotherapy
Europe held a 25.0% share of 2025 value and grows at 6.31% a year, the slowest pace among the five regions. Germany, France and the Nordic countries are core markets for allergen immunotherapy, where ALK-Abello and Allergy Therapeutics sell tablets and injections through allergists. In November 2024, ALK agreed to pay USD 145 million upfront, plus up to USD 320 million in milestones, for neffy rights in Europe, Canada and other markets outside the U.S. However, reference pricing and tender systems keep prices for generic antihistamines and steroid sprays low across the region.
Asia Pacific grows on diagnosis and urban demand
Asia Pacific held a 26.0% share of 2025 value and is the fastest-growing region at 8.41% a year. Japan has high rates of cedar pollen allergy and a mature market for sublingual immunotherapy prescribed by specialists. In China and India, urban air pollution, rising diagnosis and wider insurance coverage are bringing more patients into treatment. Local generic makers such as Cipla and Alembic supply low-cost antihistamines and montelukast, so unit growth runs ahead of value growth.
Latin America relies on pharmacy self-care
Latin America held a 5.5% share of 2025 value and grows at 7.71% a year through 2035. Brazil, Mexico and Argentina account for most regional demand, with high rates of house dust mite allergy and asthma in urban areas. Pharmacies sell many antihistamines and nasal sprays without a prescription, which supports steady volume. Currency swings and public budget limits slow the uptake of biologics and immunotherapy across the region.
Middle East and Africa start from a low base
The Middle East & Africa held a 4.5% share of 2025 value and grows at 7.91% a year. Gulf states such as Saudi Arabia and the United Arab Emirates see rising allergic rhinitis and asthma linked to dust, heat and urbanization, and their insurers cover a growing range of branded drugs. In sub-Saharan Africa, access remains limited to basic antihistamines and inhaled steroids in many public clinics. Multinational and Indian generic makers supply much of the region's volume.
Food allergy approvals and licensing deals since 2024
| Development | Status and market relevance |
|---|---|
| In February 2024, the FDA announced approval of Xolair (omalizumab) to reduce allergic reactions after accidental exposure to one or more foods. | Approved. The first drug for multiple food allergies, widening the biologic segment. |
| In November 2024, ARS Pharmaceuticals signed a license agreement with ALK-Abello for neffy in Europe, Canada and other markets outside the U.S. | Signed. Moves the leading allergen immunotherapy company into emergency treatment. |
| In March 2025, the FDA approved a 1 mg neffy dose, introduced by ARS Pharmaceuticals for children weighing 15 to 30 kilograms. | Approved. Extends needle-free epinephrine to younger children. |
| In May 2025, the FDA announced a required warning on rare severe itching after stopping long-term cetirizine or levocetirizine use. | In force. Adds a label caution to two of the most used antihistamines. |
| In July 2026, DBV Technologies announced agreement with the FDA on the data package for a Viaskin Peanut biologics license application. | Filing planned. Could add the first epicutaneous peanut allergy treatment in the U.S. |
Nasal epinephrine, anti-IgE antibodies and skin patches
- Nasal epinephrine delivers a rescue dose without a needle, which helps patients and caregivers act faster during anaphylaxis.
- Anti-IgE antibodies such as omalizumab bind circulating IgE and reduce reactions in allergic asthma, chronic hives and food allergy.
- Sublingual immunotherapy tablets dissolve under the tongue at home and treat the cause of grass, ragweed, tree and house dust mite allergy.
- Epicutaneous patches such as Viaskin Peanut deliver small amounts of allergen through the skin to build tolerance in young children.
- Fixed-dose nasal combinations pair an antihistamine with a corticosteroid in one spray, improving relief for moderate to severe rhinitis.
Need a Custom Version of This Report?
Tailor the scope, geography, or segments to your exact requirements.
- Custom geography or segment scope
- Direct access to our analyst team
OTC brands and allergen specialists compete differently
Competition in this market splits into three groups of companies with different economics. Consumer health companies such as Bayer, with Claritin, compete on brand, shelf space and advertising in OTC antihistamines and nasal sprays, where store brands set the price floor. Generic makers such as Cipla and Alembic Pharmaceuticals supply low-cost tablets, montelukast and steroid sprays across India, emerging markets and the U.S. Specialty companies hold the prescription tier, including Roche with Xolair, AstraZeneca in asthma and AbbVie and Bausch Health in allergy eye drops. Allergen immunotherapy is led by ALK-Abello, with Allergy Therapeutics in short-course injections, while ARS Pharmaceuticals, DBV Technologies and Angany bring needle-free epinephrine, skin patches and newer vaccine approaches. Because the prescription tier grows faster, partnerships and licensing deals now shape share more than OTC price cuts.
Companies profiled and their roles in this market
| Company | Type | Role in the market |
|---|---|---|
| AbbVie Inc. | Eye care and immunology | Allergy eye drops through its Allergan eye care unit |
| Alembic Pharmaceuticals Ltd. | Generics | Antihistamine and respiratory generics |
| ALK-Abello A/S | Allergen immunotherapy | Sublingual tablets and neffy rights outside the U.S. |
| Allergy Therapeutics plc | Allergen immunotherapy | Short-course injectable immunotherapy, Grass MATA MPL |
| Angany Inc. | Developer | Allergy vaccine candidates |
| ARS Pharmaceuticals | Specialty pharma | neffy epinephrine nasal spray |
| AstraZeneca plc | Respiratory | Asthma inhalers and biologics |
| Bausch Health Companies | Eye care | Allergy eye drops through Bausch + Lomb |
| Bayer AG | Consumer health | Claritin antihistamines |
| Cipla Ltd. | Generics | Antihistamines, montelukast and nasal sprays |
| DBV Technologies SA | Developer | Viaskin Peanut epicutaneous patch |
| F. Hoffmann-La Roche Ltd. | Biologics | Xolair (omalizumab), marketed with Novartis |
Food allergy and immunotherapy carry the growth premium
Credence Research's view is that food allergy, anaphylaxis and immunotherapy will carry most of the growth premium in anti-allergy drugs through 2035. Mature OTC antihistamines and steroid sprays still supply the volume base, but generic pricing keeps their value growth below the market average. Products that change the course of disease or replace needles, such as anti-IgE therapy, sublingual tablets and nasal epinephrine, command higher prices and longer treatment. Companies with allergist relationships and licensing reach, rather than shelf space alone, are best placed to gain share as these therapies spread beyond the U.S. and Europe.
How the 2025 baseline and forecast were built
The report uses 2025 as the base year and forecasts market value to 2035, with growth rates stated for 2026–2035. Market values come from the Credence Research market model, which combines treated patient numbers, typical therapy use by condition and average selling prices by region and channel. Splits by disease type, drug class, drug type, distribution channel and region are Credence Research estimates. Sources used include FDA approvals and safety communications, disease statistics from the WHO and the U.S. National Center for Health Statistics, and company press releases and filings. No primary interviews or surveys were used to build the estimates in this report.
Prescription innovation outpaces mature OTC antihistamines
By 2035, the market reaches USD 46.36 billion, with prescription products growing faster than OTC lines. Rhinitis remains the largest disease area, but food allergy and anaphylaxis gain share as anti-IgE therapy, nasal epinephrine and a possible peanut patch reach more patients. Immunotherapy tablets expand in Europe, Japan and North America, and online pharmacies take a larger part of repeat purchases. Generic antihistamines keep volumes high across Asia Pacific and Latin America at low prices. Decongestants lose ground if the FDA finalizes the end of oral phenylephrine, shifting sales toward nasal sprays and combinations.
Frequently Asked Questions
How big is the anti-allergy drugs market?
Which disease type leads the anti-allergy drugs market?
Which drug class grows fastest?
Which region holds the largest share?
How common are allergies in the U.S.?
What new treatments are changing the market?
Who are the leading companies?
What are the main challenges?
Table of Content
Chapter 1 Market Segmentation
- 1.1 Segmentation Framework
- 1.1.1 Product and Service Classification
- 1.1.2 Application and End-Use Classification
- 1.1.3 Technology and Solution Classification
- 1.1.4 Customer and Distribution Channel Classification
- 1.1.5 Geographic Segmentation
- 1.1.6 Market Segment Definitions and Boundaries
- 1.2 By Disease Type
- 1.2.1 Rhinitis
- 1.2.2 Asthma
- 1.2.3 Skin Allergy
- 1.2.4 Eye Allergy
- 1.2.5 Food Allergy and Others
- 1.3 By Drug Class
- 1.3.1 Antihistamines
- 1.3.2 Corticosteroids
- 1.3.3 Combination Therapy
- 1.3.4 Immunotherapy
- 1.3.5 Decongestants
- 1.3.6 Other
- 1.4 By Drug Type
- 1.4.1 Rx
- 1.4.2 OTC
Chapter 2 Introduction
- 2.1 Report Objectives and Scope
- 2.2 Product Definition and Industry Terminology
- 2.3 Market Inclusions and Exclusions
- 2.4 Research Process
- 2.4.1 Primary Research and Expert Interviews
- 2.4.2 Secondary Research and Source Review
- 2.4.3 Top-Down and Bottom-Up Estimation
- 2.4.4 Data Triangulation and Verification
- 2.5 Market Size Measurement Basis
- 2.5.1 2025: USD 23.24 billion → 2035: USD 46.36 billion
- 2.6 Historical and Forecast Reference Periods
- 2.6.1 Historical Period: 2018-2025
- 2.6.2 Base Year: 2025
- 2.6.3 Forecast Period: 2025-2035
- 2.7 Research Assumptions and Limitations
Chapter 3 Executive Summary
- 3.1 Market Snapshot and Key Findings
- 3.2 Base-Year Market Size, 2025
- 3.3 Forecast Market Size, 2035
- 3.4 Revenue and Volume Growth Outlook
- 3.5 Key Demand and Supply Indicators
- 3.6 Leading Market Segments
- 3.7 Fastest-Growing Market Opportunities
- 3.8 Regional Performance Highlights
- 3.9 Technology and Industry Transformation
- 3.10 Competitive Landscape Summary
- 3.11 Analyst View and Strategic Implications
Chapter 4 Global Anti-Allergy Drugs Market Trends and Developments
- 4.1 Historical Industry Development, 2018-2025
- 4.2 Recent Market Trends and Developments
- 4.3 Demand and Customer Behavior Trends
- 4.4 Technology and Product Innovation
- 4.5 Artificial Intelligence, Automation and Digitalization
- 4.6 Local Manufacturing and Supply Chain Realignment
- 4.7 Industry Partnerships, Mergers and Acquisitions
- 4.8 Sustainability and Circular Economy Developments
- 4.9 Government and Private Sector Investment Trends
- 4.10 Emerging Business Models and Commercialization
- 4.11 Industry Developments and Announcements
Chapter 5 Global Anti-Allergy Drugs Market Production, Supply and Demand Analysis
- 5.1 Demand Trend and Consumption Analysis, 2018-2025
- 5.2 Demand Forecast, 2025-2035
- 5.3 Production and Output Trend, 2018-2025
- 5.4 Production and Output Forecast, 2025-2035
- 5.5 Installed Capacity and Capacity Utilization
- 5.6 Company-Wise Production Plants and Statistics
- 5.6.1 Installed Production Capacity
- 5.6.2 Actual Production
- 5.6.3 Planned Capacity and Expansion Targets
- 5.7 Supply Chain Structure and Procurement Trends
- 5.8 Supply-Demand Gap and Bottlenecks
- 5.9 Import Dependence and Sourcing Structure
- 5.10 Contract Manufacturing and Outsourcing
- 5.11 Regional Supply and Demand Concentration
Chapter 6 Global Anti-Allergy Drugs Market Pricing Analysis
- 6.1 Pricing Structure and Measurement
- 6.2 Historical Pricing Trends, 2018-2025
- 6.3 Pricing Outlook, 2025-2035
- 6.4 Average Selling Price and Unit Economics
- 6.5 Pricing by Product and Market Segment
- 6.6 Geographic Pricing Differences
- 6.7 Key Input, Energy, Labor and Logistics Costs
- 6.8 Contract Pricing and Purchasing Models
- 6.9 Pricing Sensitivity and Competitive Positioning
- 6.10 Price, Margin and Profitability Implications
Chapter 7 Global Anti-Allergy Drugs Market Dynamics
- 7.1 Market Growth Drivers
- 7.1.1 Demand-Side Drivers
- 7.1.2 Technology and Innovation Drivers
- 7.1.3 Infrastructure and Investment Drivers
- 7.1.4 Regulatory and Policy Drivers
- 7.2 Market Restraints
- 7.2.1 Cost and Affordability Constraints
- 7.2.2 Technology and Adoption Barriers
- 7.2.3 Supply Chain and Operational Constraints
- 7.3 Market Challenges
- 7.3.1 Competitive Pressure and Margin Erosion
- 7.3.2 Skills, Infrastructure and Implementation Gaps
- 7.4 Emerging Market Opportunities
- 7.5 Market Dynamics Impact and Time-Horizon Assessment
Chapter 8 Global Anti-Allergy Drugs Value Chain Analysis
- 8.1 Industry Value Chain Overview
- 8.2 Upstream Suppliers and Critical Inputs
- 8.3 Technology and Component Providers
- 8.4 Manufacturing or Service Delivery
- 8.5 Distribution, Channel Partners and Integrators
- 8.6 Downstream Applications and End Users
- 8.7 Value Addition and Profit Pools
- 8.8 Vertical Integration and Outsourcing
- 8.9 Supplier Concentration and Risk
- 8.10 Supply Chain Localization and Resilience
Chapter 9 Global Anti-Allergy Drugs Market Regulations and Policies
- 9.1 Relevant Laws, Standards and Compliance Frameworks
- 9.2 Product, Service, Safety and Quality Requirements
- 9.3 Government Policies, Incentives and Subsidies
- 9.4 Imports, Exports and Trade Barriers
- 9.5 Public Procurement and Local Content Requirements
- 9.6 Environmental and Sustainability Compliance
- 9.7 Upcoming Policy Changes and Market Implications
Chapter 10 Global Anti-Allergy Drugs Market Hotspots and Opportunities
- 10.1 Market Opportunity Mapping and Growth Hotspots
- 10.2 High-Growth Applications and Customer Groups
- 10.3 Underserved Markets and White-Space Opportunities
- 10.4 Emerging Technology and Product Opportunities
- 10.5 New Capacity and Investment Hotspots
- 10.6 Market Entry and Expansion Opportunities
- 10.7 Distribution and Partnership Opportunities
- 10.8 Near-Term and Long-Term Commercial Potential
- 10.9 Opportunity Attractiveness and Execution Risks
Chapter 11 Global Anti-Allergy Drugs Market Outlook, 2025-2035
- 11.1 Market Size and Analysis
- 11.1.1 Revenue (Market Measurement: 2025: USD 23.24 billion → 2035: USD 46.36 billion)
- 11.1.2 Market Volume and Quantity Sold
- 11.1.3 Historical Market Size, 2018-2025
- 11.1.4 Base-Year Market Size, 2025
- 11.2 Market Forecast, 2025-2035
- 11.2.1 Revenue Forecast to 2035
- 11.2.2 Volume Forecast to 2035
- 11.2.3 CAGR and Year-on-Year Growth
- 11.2.4 Incremental Revenue Opportunity
- 11.3 Forecast Assumptions and Scenario Analysis
- 11.3.1 Base-Case Forecast
- 11.3.2 Optimistic and Conservative Scenarios
- 11.3.3 Technology, Pricing and Policy Sensitivities
- 11.4 Market Attractiveness and Growth Outlook
Chapter 12 Global Anti-Allergy Drugs Market Segmentation and Outlook
- 12.1 Segmentation Summary and Market Shares, 2025
- 12.2 Largest and Fastest-Growing Segments
- 12.3 By Disease Type - Market Size and Forecast, 2025-2035
- 12.3.1 Segment Definition and Scope
- 12.3.2 Historical Market Size, 2018-2025
- 12.3.3 Revenue Forecast, 2025-2035
- 12.3.4 Volume Forecast, 2025-2035
- 12.3.5 Base-Year Market Share, 2025
- 12.3.6 Segment CAGR and Growth Drivers
- 12.3.7 Subsegment Market Size and Forecast
- 12.3.7.1 Rhinitis
- 12.3.7.2 Asthma
- 12.3.7.3 Skin Allergy
- 12.3.7.4 Eye Allergy
- 12.3.7.5 Food Allergy and Others
- 12.3.8 Subsegment Pricing and Adoption Trends
- 12.3.9 Leading Suppliers and Competition
- 12.3.10 Regional Demand and Opportunities
- 12.4 By Drug Class - Market Size and Forecast, 2025-2035
- 12.4.1 Segment Definition and Scope
- 12.4.2 Historical Market Size, 2018-2025
- 12.4.3 Revenue Forecast, 2025-2035
- 12.4.4 Volume Forecast, 2025-2035
- 12.4.5 Base-Year Market Share, 2025
- 12.4.6 Segment CAGR and Growth Drivers
- 12.4.7 Subsegment Market Size and Forecast
- 12.4.7.1 Antihistamines
- 12.4.7.2 Corticosteroids
- 12.4.7.3 Combination Therapy
- 12.4.7.4 Immunotherapy
- 12.4.7.5 Decongestants
- 12.4.7.6 Other
- 12.4.8 Subsegment Pricing and Adoption Trends
- 12.4.9 Leading Suppliers and Competition
- 12.4.10 Regional Demand and Opportunities
- 12.5 By Drug Type - Market Size and Forecast, 2025-2035
- 12.5.1 Segment Definition and Scope
- 12.5.2 Historical Market Size, 2018-2025
- 12.5.3 Revenue Forecast, 2025-2035
- 12.5.4 Volume Forecast, 2025-2035
- 12.5.5 Base-Year Market Share, 2025
- 12.5.6 Segment CAGR and Growth Drivers
- 12.5.7 Subsegment Market Size and Forecast
- 12.5.7.1 Rx
- 12.5.7.2 OTC
- 12.5.8 Subsegment Pricing and Adoption Trends
- 12.5.9 Leading Suppliers and Competition
- 12.5.10 Regional Demand and Opportunities
- 12.6 Segment Growth Comparison
- 12.7 Segment Attractiveness and Priority Matrix
Chapter 13 Global Anti-Allergy Drugs Geographic Market Outlook, 2025-2035
- 13.1 Regional Market Size and Share, 2025
- 13.2 Regional Market Forecast, 2025-2035
- 13.3 Regional Pricing, Production and Demand Differences
- 13.4 North America
- 13.4.1 United States
- 13.4.2 Canada
- 13.4.3 Mexico
- 13.5 Europe
- 13.5.1 Germany
- 13.5.2 France
- 13.5.3 Italy
- 13.5.4 United Kingdom
- 13.5.5 Spain
- 13.5.6 Poland
- 13.5.7 Russia
- 13.5.8 Netherlands
- 13.5.9 Belgium
- 13.5.10 Sweden
- 13.5.11 Denmark
- 13.5.12 Norway
- 13.5.13 Rest of Europe
- 13.6 Asia Pacific
- 13.6.1 China
- 13.6.2 India
- 13.6.3 Japan
- 13.6.4 South Korea
- 13.6.5 Thailand
- 13.6.6 Indonesia
- 13.6.7 Vietnam
- 13.6.8 Malaysia
- 13.6.9 Australia
- 13.6.10 Rest of Asia Pacific
- 13.7 Latin America
- 13.7.1 Brazil
- 13.7.2 Argentina
- 13.7.3 Colombia
- 13.7.4 Chile
- 13.7.5 Rest of Latin America
- 13.8 Middle East
- 13.8.1 Saudi Arabia
- 13.8.2 United Arab Emirates
- 13.8.3 Turkey
- 13.8.4 Israel
- 13.8.5 Iran
- 13.8.6 Rest of the Middle East
- 13.9 Africa
- 13.9.1 South Africa
- 13.9.2 Egypt
- 13.9.3 Nigeria
- 13.9.4 Morocco
- 13.9.5 Rest of Africa
- 13.10 Regional Investment, Policy and Supply Chain Differences
- 13.11 Regional Competitive Landscape
- 13.12 Geographic Growth Hotspots
Chapter 14 Global Anti-Allergy Drugs Technology, Innovation and Sustainability Outlook
- 14.1 Technology Landscape and Maturity
- 14.2 Product, Process and Service Innovation
- 14.3 AI, Automation and Digital Tools in the Industry
- 14.4 Technology Adoption and Performance Benchmarking
- 14.5 Innovation Pipeline and R&D Investment
- 14.6 Patent and Intellectual Property Trends
- 14.7 Energy Efficiency and Resource Management
- 14.8 Sustainability, Recycling and Circularity
- 14.9 Technology Roadmap, 2025-2035
- 14.10 Risks of Obsolescence and Technology Substitution
Chapter 15 Global Anti-Allergy Drugs Market Key Strategic Imperatives
- 15.1 Growth and Market Entry Priorities
- 15.2 High-Return Products and Segments
- 15.3 Pricing, Profitability and Cost Optimization
- 15.4 Technology Investment and Product Differentiation
- 15.5 Supply Chain Localization and Resilience
- 15.6 Distribution and Customer Acquisition
- 15.7 Partnership, Acquisition and Capacity Strategy
- 15.8 Regional Expansion Priorities
- 15.9 Short-, Medium- and Long-Term Actions
Chapter 16 Competition Outlook
- 16.1 Industry Competition Characteristics
- 16.2 Market Structure and Concentration
- 16.3 Market Share and Competitive Positioning, 2025
- 16.4 Company-Wise Revenue and Product Benchmarking
- 16.5 Production and Service Capacity Benchmarking
- 16.6 Technology, Pricing and Differentiation
- 16.7 Regional Footprint and Distribution Strength
- 16.8 Mergers, Acquisitions and Strategic Alliances
- 16.9 New Entrants and Competitive Threats
- 16.10 Porter's Five Forces and Industry Attractiveness
- 16.11 Competitive Outlook, 2025-2035
Chapter 17 Company Profiles
- 17.1 Company Coverage and Selection Criteria
- 17.2 AbbVie Inc.
- 17.2.1 Business Description
- 17.2.2 Company Ownership and Geographic Presence
- 17.2.3 Product and Service Portfolio
- 17.2.4 Manufacturing and Operating Footprint
- 17.2.5 Production Capacity and Expansion Plans
- 17.2.6 Financial Performance and Investment
- 17.2.7 Market Share and Competitive Position
- 17.2.8 Technology and Innovation Capabilities
- 17.2.9 Strategic Alliances or Partnerships
- 17.2.10 Recent Developments
- 17.2.11 Growth Strategy and Outlook
- 17.3 Alembic Pharmaceuticals Ltd.
- 17.4 ALK-Abello A/S
- 17.5 Allergy Therapeutics plc
- 17.6 Angany Inc.
- 17.7 ARS Pharmaceuticals
- 17.8 AstraZeneca plc
- 17.9 Bausch Health Companies
- 17.10 Bayer AG
- 17.11 Cipla Ltd.
- 17.12 DBV Technologies SA
- 17.13 F. Hoffmann-La Roche Ltd.
- 17.14 Other Relevant Market Participants
Note: Every listed company is profiled on the structure shown under the first company. The company list is preliminary and may change based on research findings, market developments, data availability and client requirements.
Chapter 18 Disclaimer
- 18.1 Research and Forecast Disclaimer
- 18.2 Data Source and Estimation Limitations
Note: The depth of individual sections depends on data availability for this market. Volume, capacity, trade and other unit-based metrics are included where applicable.

