
Anti-amyloid antibodies reshape Alzheimer’s disease drugs
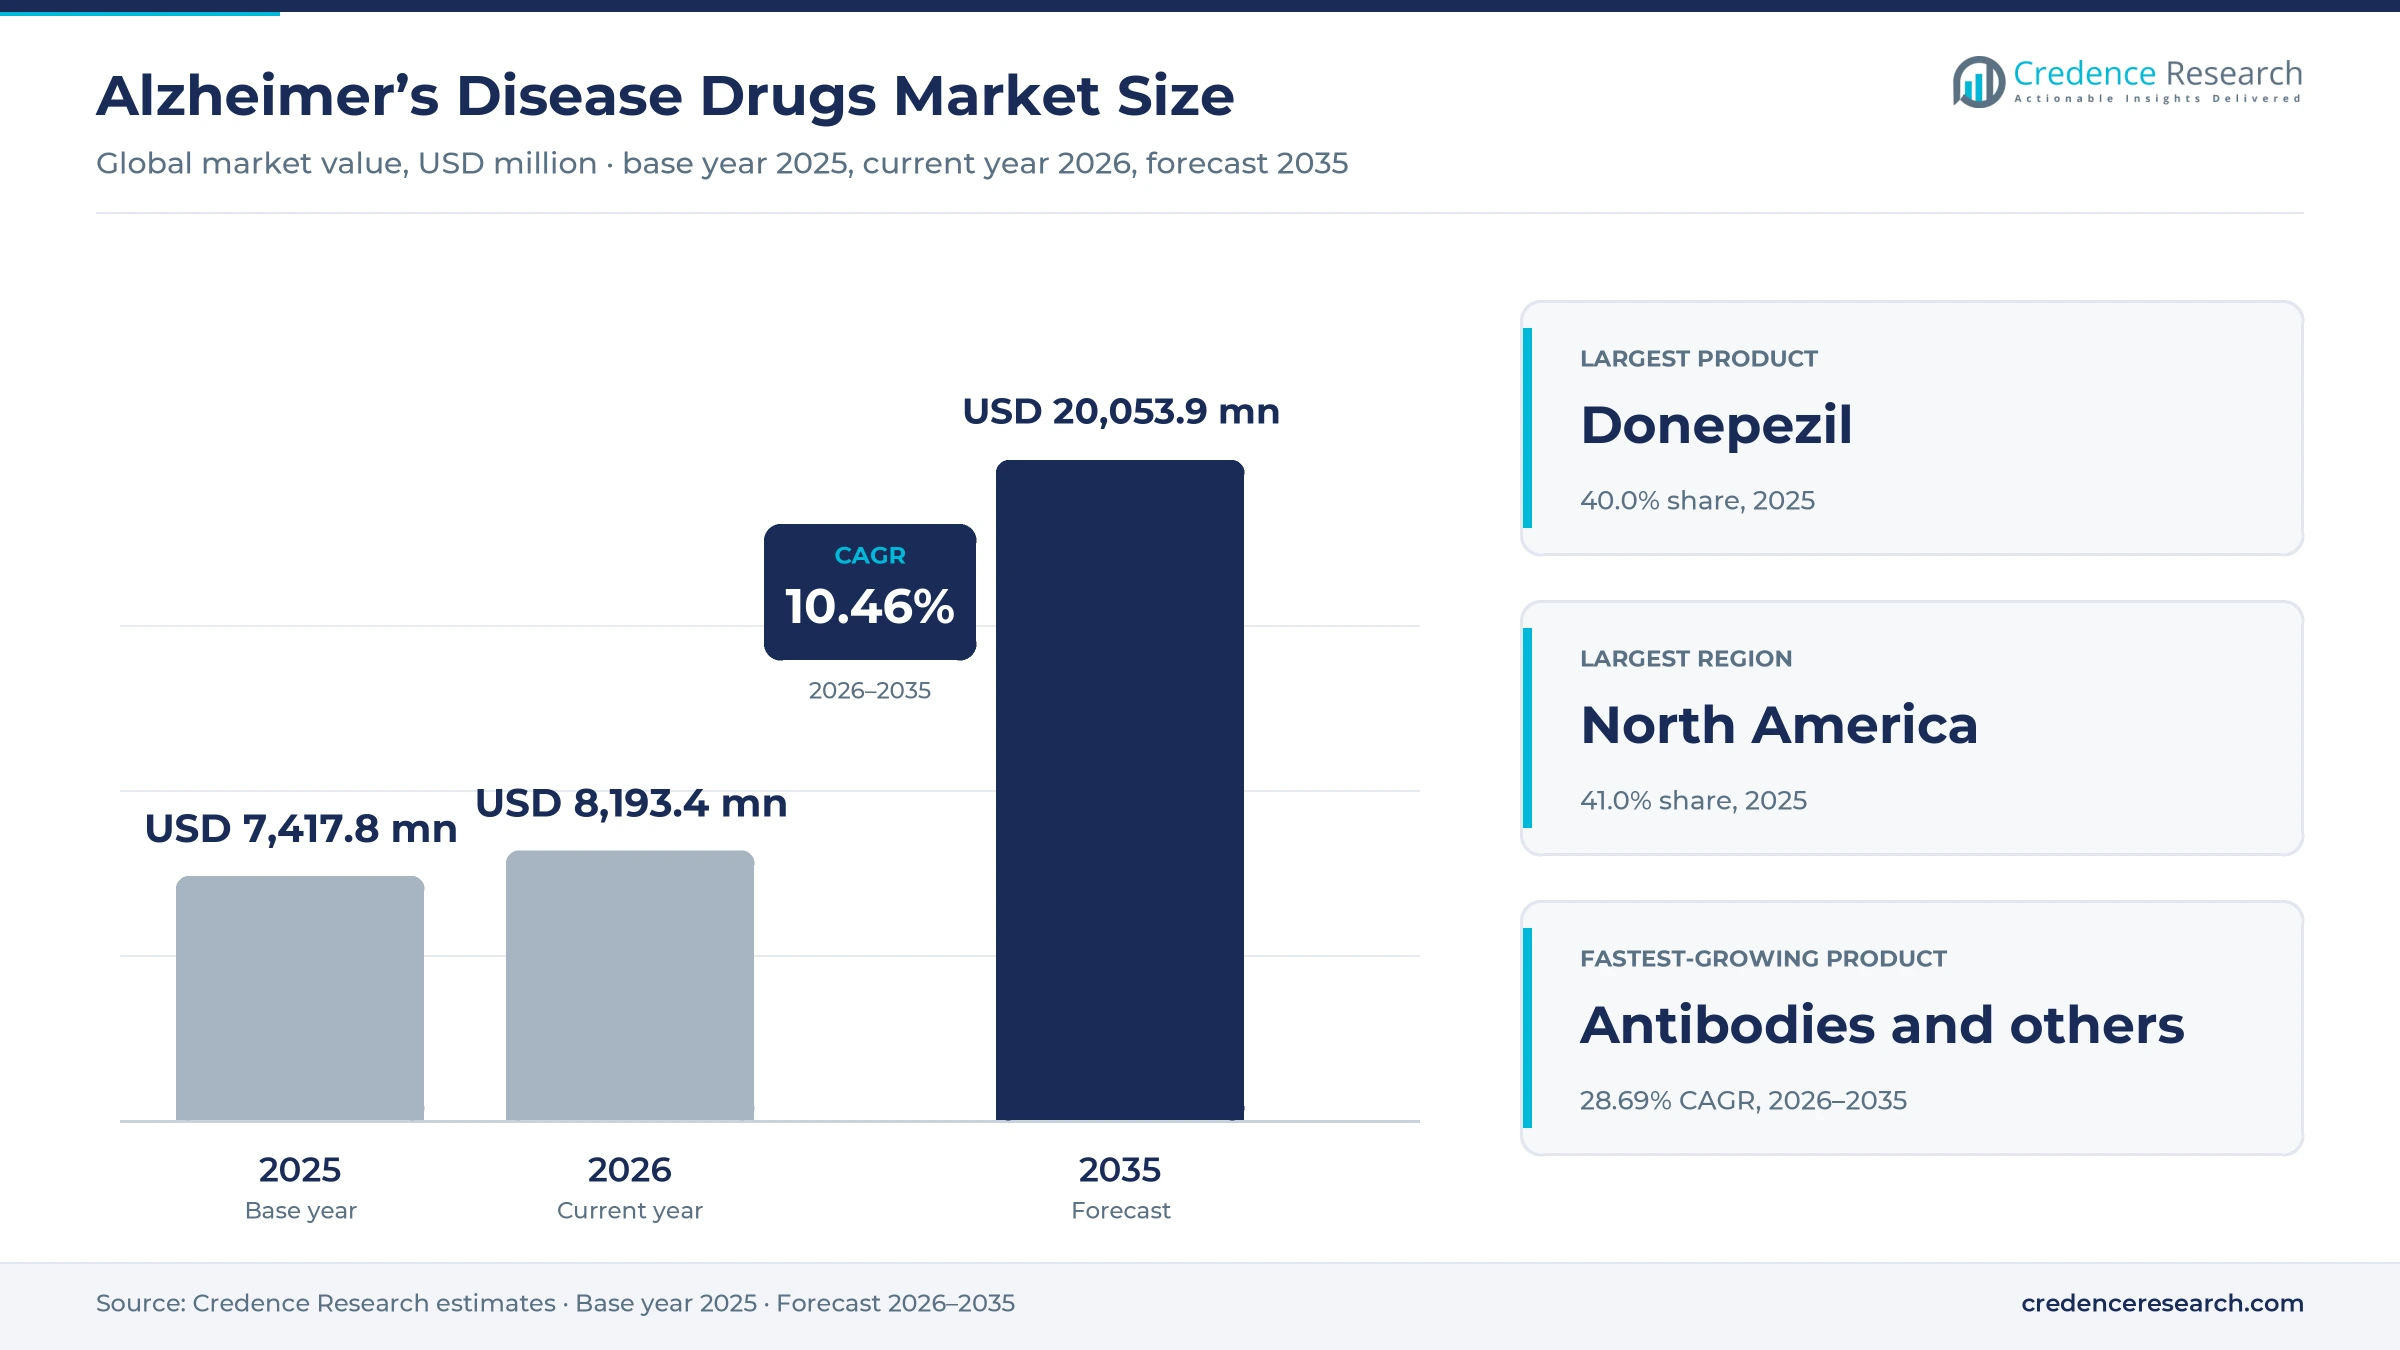
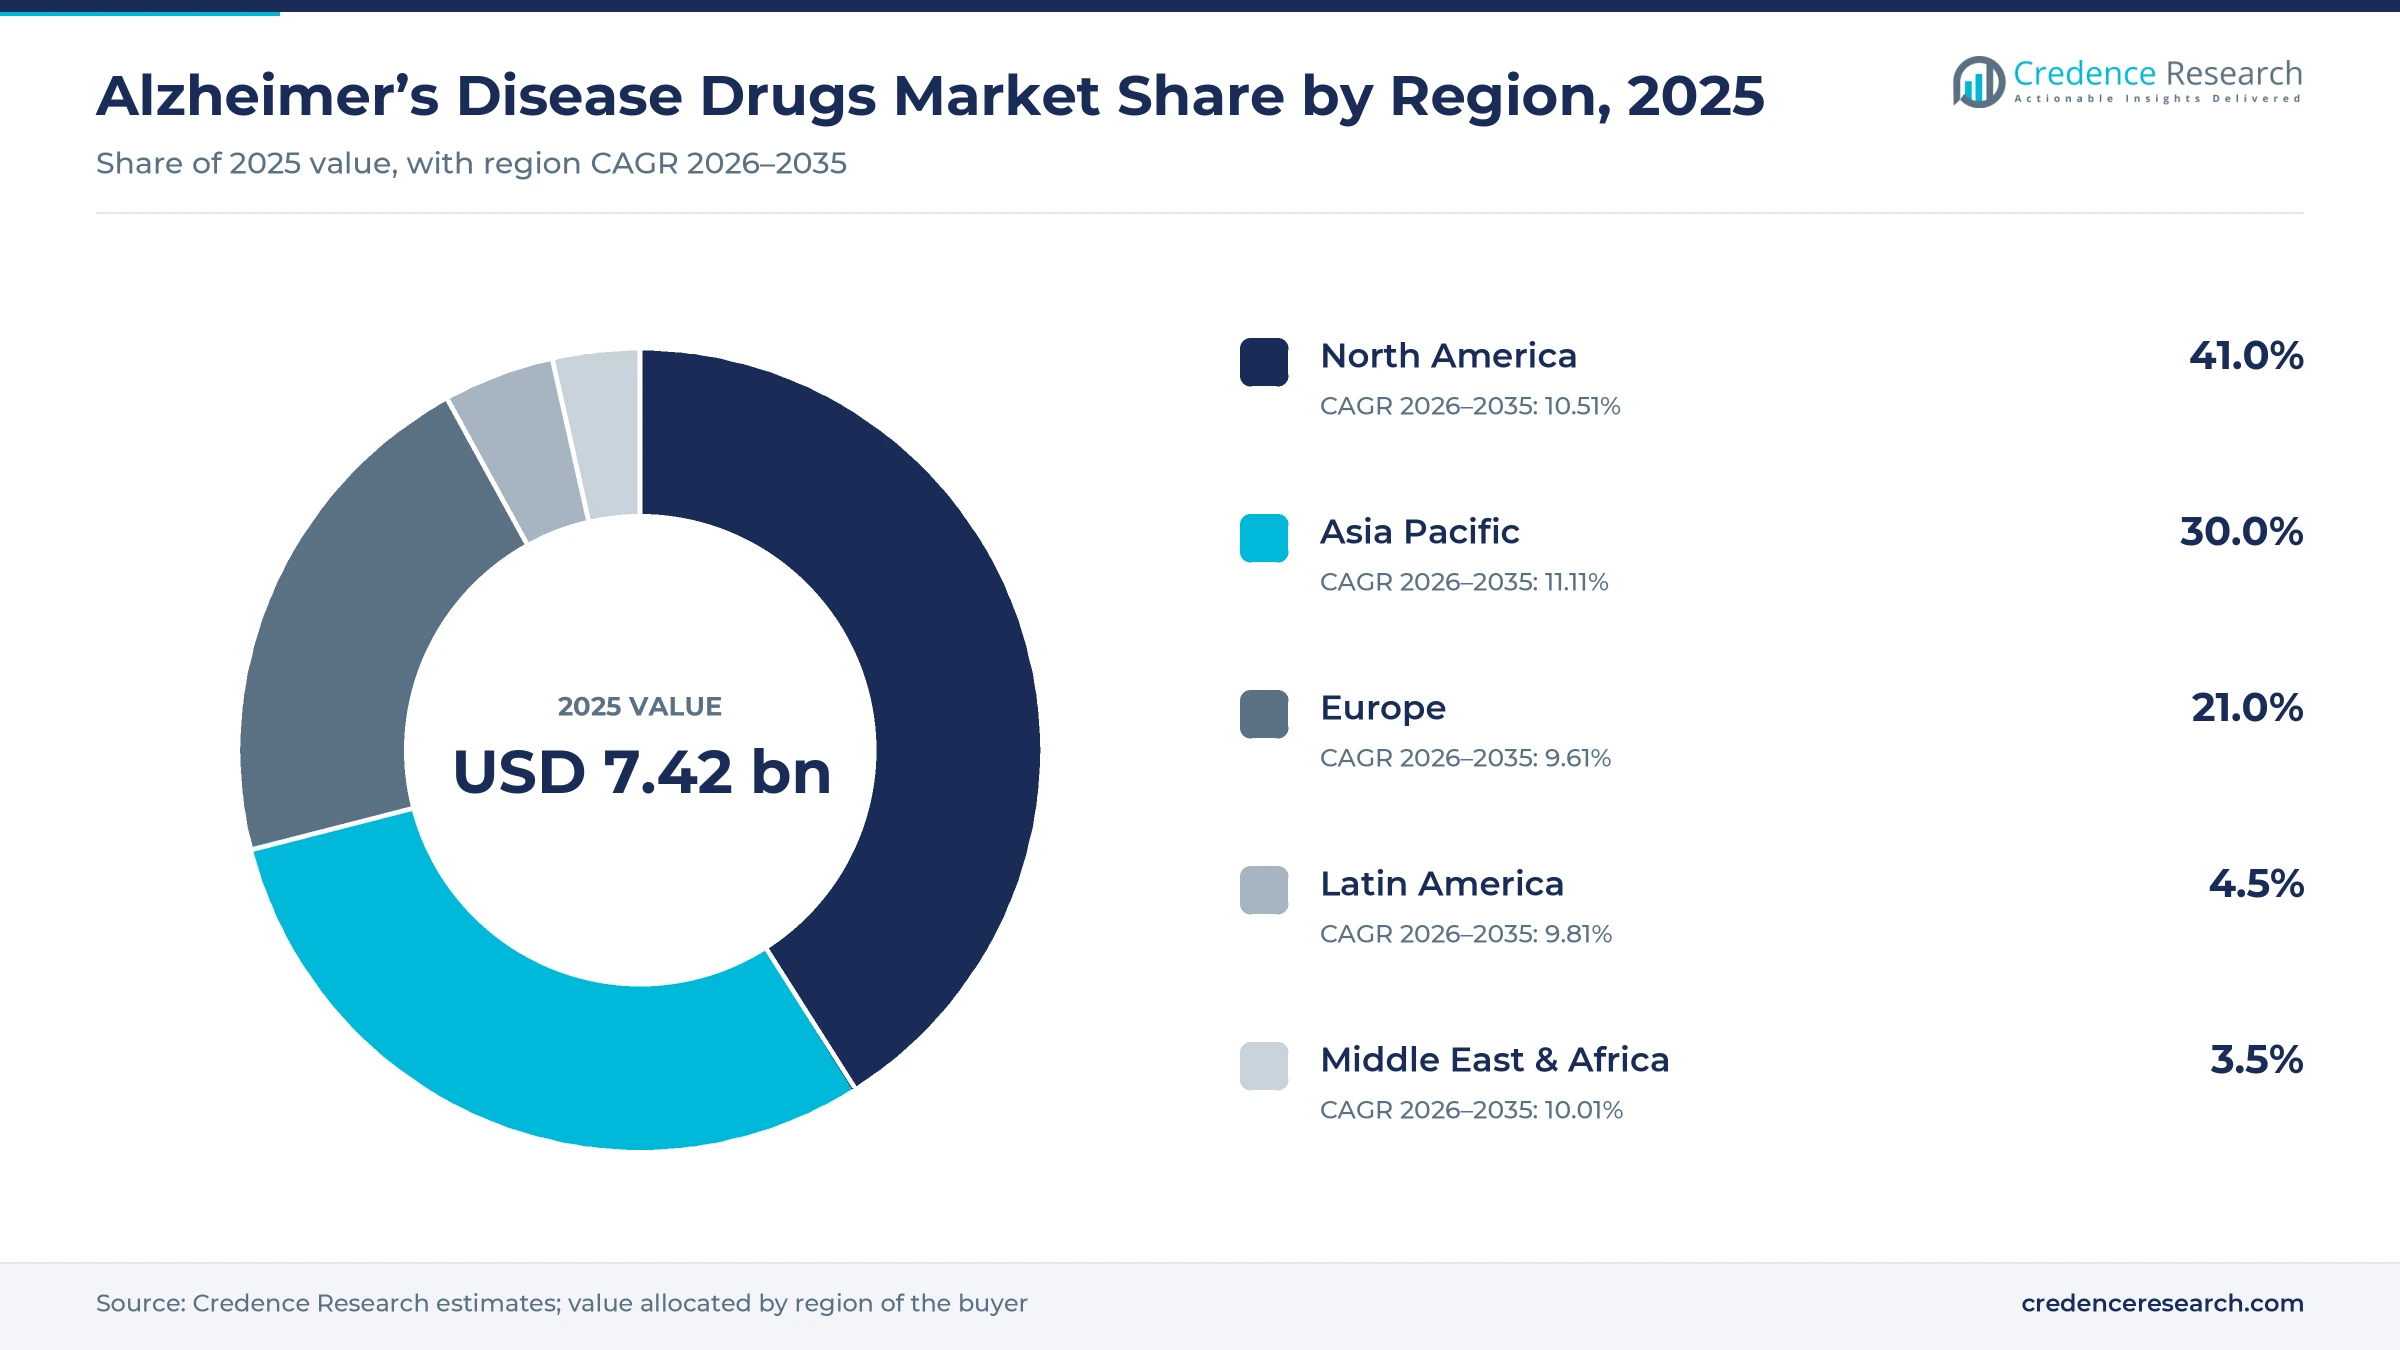
The global Alzheimer’s disease drugs market was valued at USD 7.42 billion in 2025 and is projected to increase from USD 8.19 billion in 2026 to USD 20.05 billion by 2035, registering a CAGR of 10.46% during 2026–2035. Demand comes from an aging population, earlier diagnosis and the arrival of disease-modifying antibodies that target amyloid plaques. North America held the largest regional share, 41.0% in 2025, because the United States leads in antibody infusions and pays the highest prices. Asia Pacific is the fastest-growing region at 11.11% a year, supported by lecanemab use in Japan and China and a large base of donepezil patients. Cholinesterase inhibitors and memantine, now mostly generic, still supply most prescriptions at low prices. In July 2026, the FDA approved an at-home subcutaneous starting dose of lecanemab, which lets patients begin therapy without infusion visits.
Which medicines and settings does this market cover?
The market counts manufacturer sales of prescription medicines used to treat the symptoms or slow the progression of Alzheimer’s disease. It covers donepezil, galantamine, rivastigmine, memantine and other NMDA receptor antagonists, fixed-dose combinations and anti-amyloid antibodies such as lecanemab and donanemab. Medicines reach patients through hospital pharmacies and infusion centers, retail pharmacies, online pharmacies and long-term care suppliers.
The scope excludes diagnostic tests, amyloid PET imaging, infusion and monitoring services, and medicines used mainly for other conditions. Value is measured at the manufacturer level, so the cost of MRI safety scans and infusion visits is not included in the totals. These services still matter, because they set how many patients can start antibody treatment in any given year.
Alzheimer’s Disease Drugs Market Insights
- The Alzheimer’s disease drugs market grows from USD 7.42 billion in 2025 to USD 20.05 billion by 2035, rising at a 10.46% CAGR as antibody treatment reaches more patients.
- North America held 41.0% of 2025 value, while Asia Pacific grows fastest at 11.11% a year through 2035 on lecanemab use and aging populations.
- Donepezil led products with 40.0% of 2025 value, but antibodies and other new agents grow fastest at 28.69% a year from a small base.
- In July 2026, the FDA approved an at-home subcutaneous starting dose of lecanemab, following its August 2025 approval of weekly subcutaneous maintenance dosing.
- Eisai, Biogen and Eli Lilly lead antibody competition, while the failure of Novo Nordisk’s semaglutide trials in November 2025 shows how hard new mechanisms remain.
Cholinesterase generics lead while antibodies climb
Why does donepezil still lead product value?
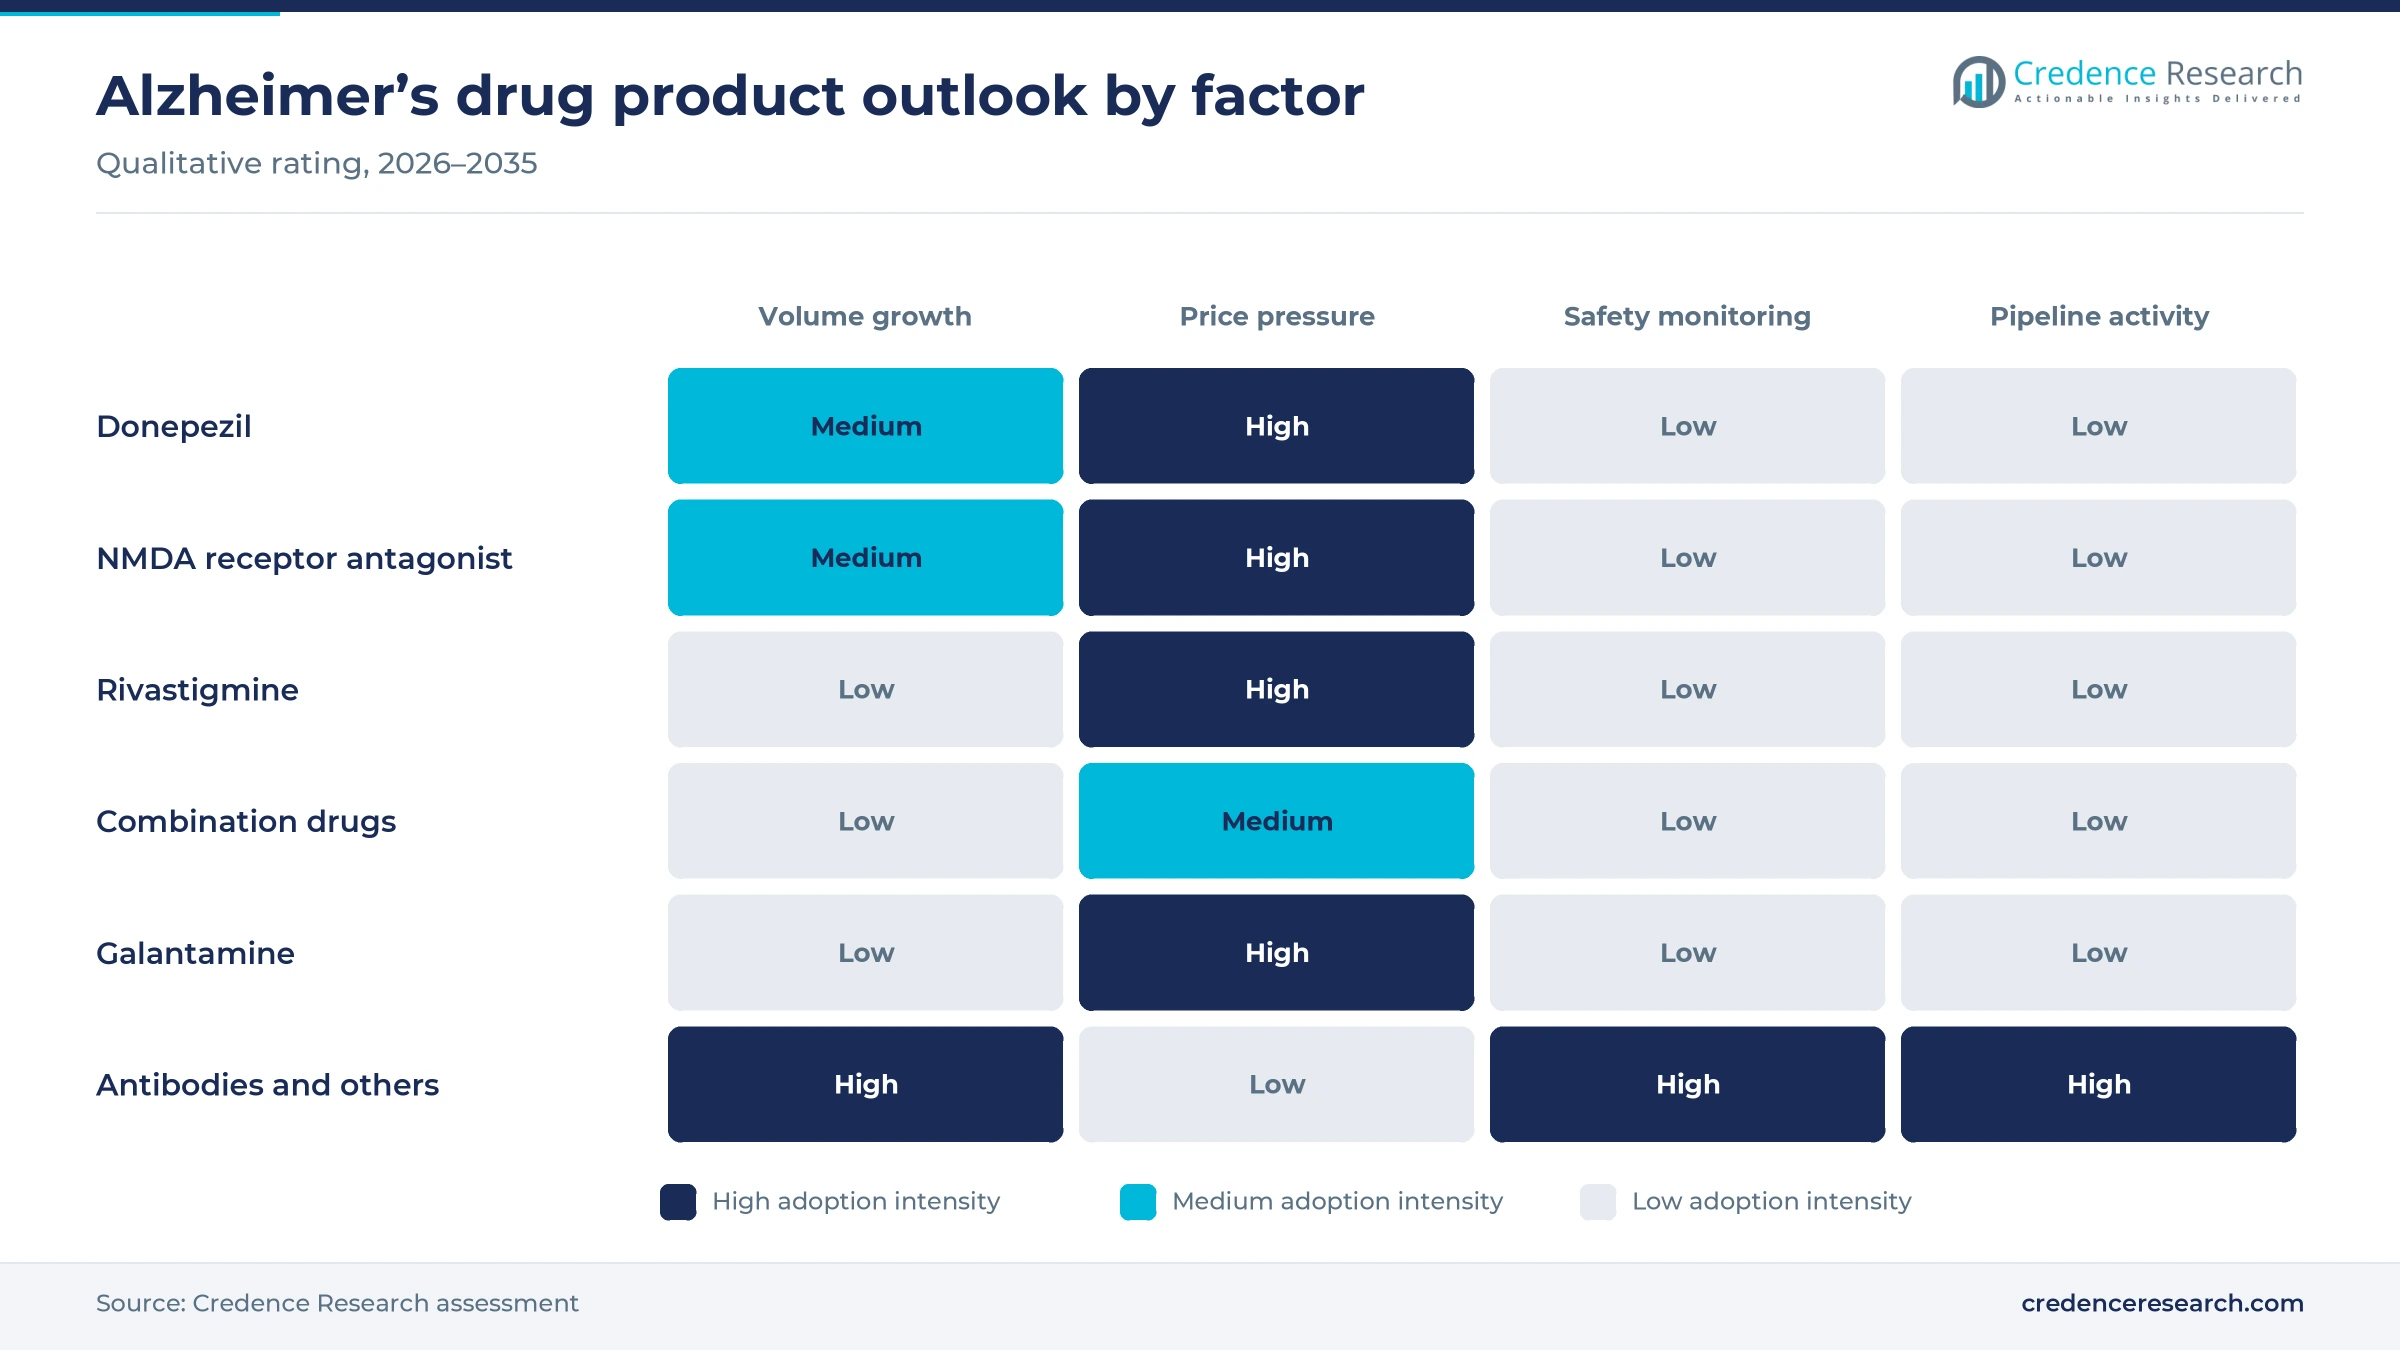
Based on product, the market is categorized into donepezil, galantamine, rivastigmine, NMDA receptor antagonists, combination drugs and anti-amyloid antibodies and others. Donepezil led with a 40.0% share of 2025 value because it is the most prescribed first-line treatment and is sold worldwide as a low-cost generic. Anti-amyloid antibodies and others grow fastest at 28.69% a year as lecanemab and donanemab reach more eligible patients with mild disease.
How does antibody infusion change channel shares?
Based on distribution channel, the market is categorized into hospital pharmacy, retail pharmacy, online pharmacy and others. Retail Pharmacy led with a 50.0% share of 2025 value because oral generics are refilled monthly at community pharmacies. Hospital pharmacy grows fastest at 12.23% a year as infused antibodies are dispensed through hospital and infusion center pharmacies, although at-home subcutaneous dosing may move some volume to specialty and retail channels.
| Segment Group | Leading Sub-segment | Share, 2025 | Fastest-growing Sub-segment | CAGR, 2026–2035 |
|---|---|---|---|---|
| By Product | Donepezil | 40.0% | Anti-amyloid Antibodies and Others | 28.69% |
| By Distribution Channel | Retail Pharmacy | 50.0% | Hospital Pharmacy | 12.23% |
Request a Free Sample
Fill in your details and we'll send you a free sample report.
- Sample data tables & charts
- Research methodology
Aging, blood tests and at-home dosing widen treatment
How does population aging enlarge the treated pool?
Population aging is the base driver because the risk of Alzheimer’s disease rises sharply after the age of 65. According to the WHO dementia fact sheet, 57 million people were living with dementia worldwide in 2021, and nearly 10 million new cases occur every year. Alzheimer’s disease may contribute to 60–70% of these cases, which makes it the largest single target for dementia medicines. As a result, prescription volume for symptomatic treatment keeps rising in every region through 2035.
Why are disease-modifying antibodies lifting value per patient?
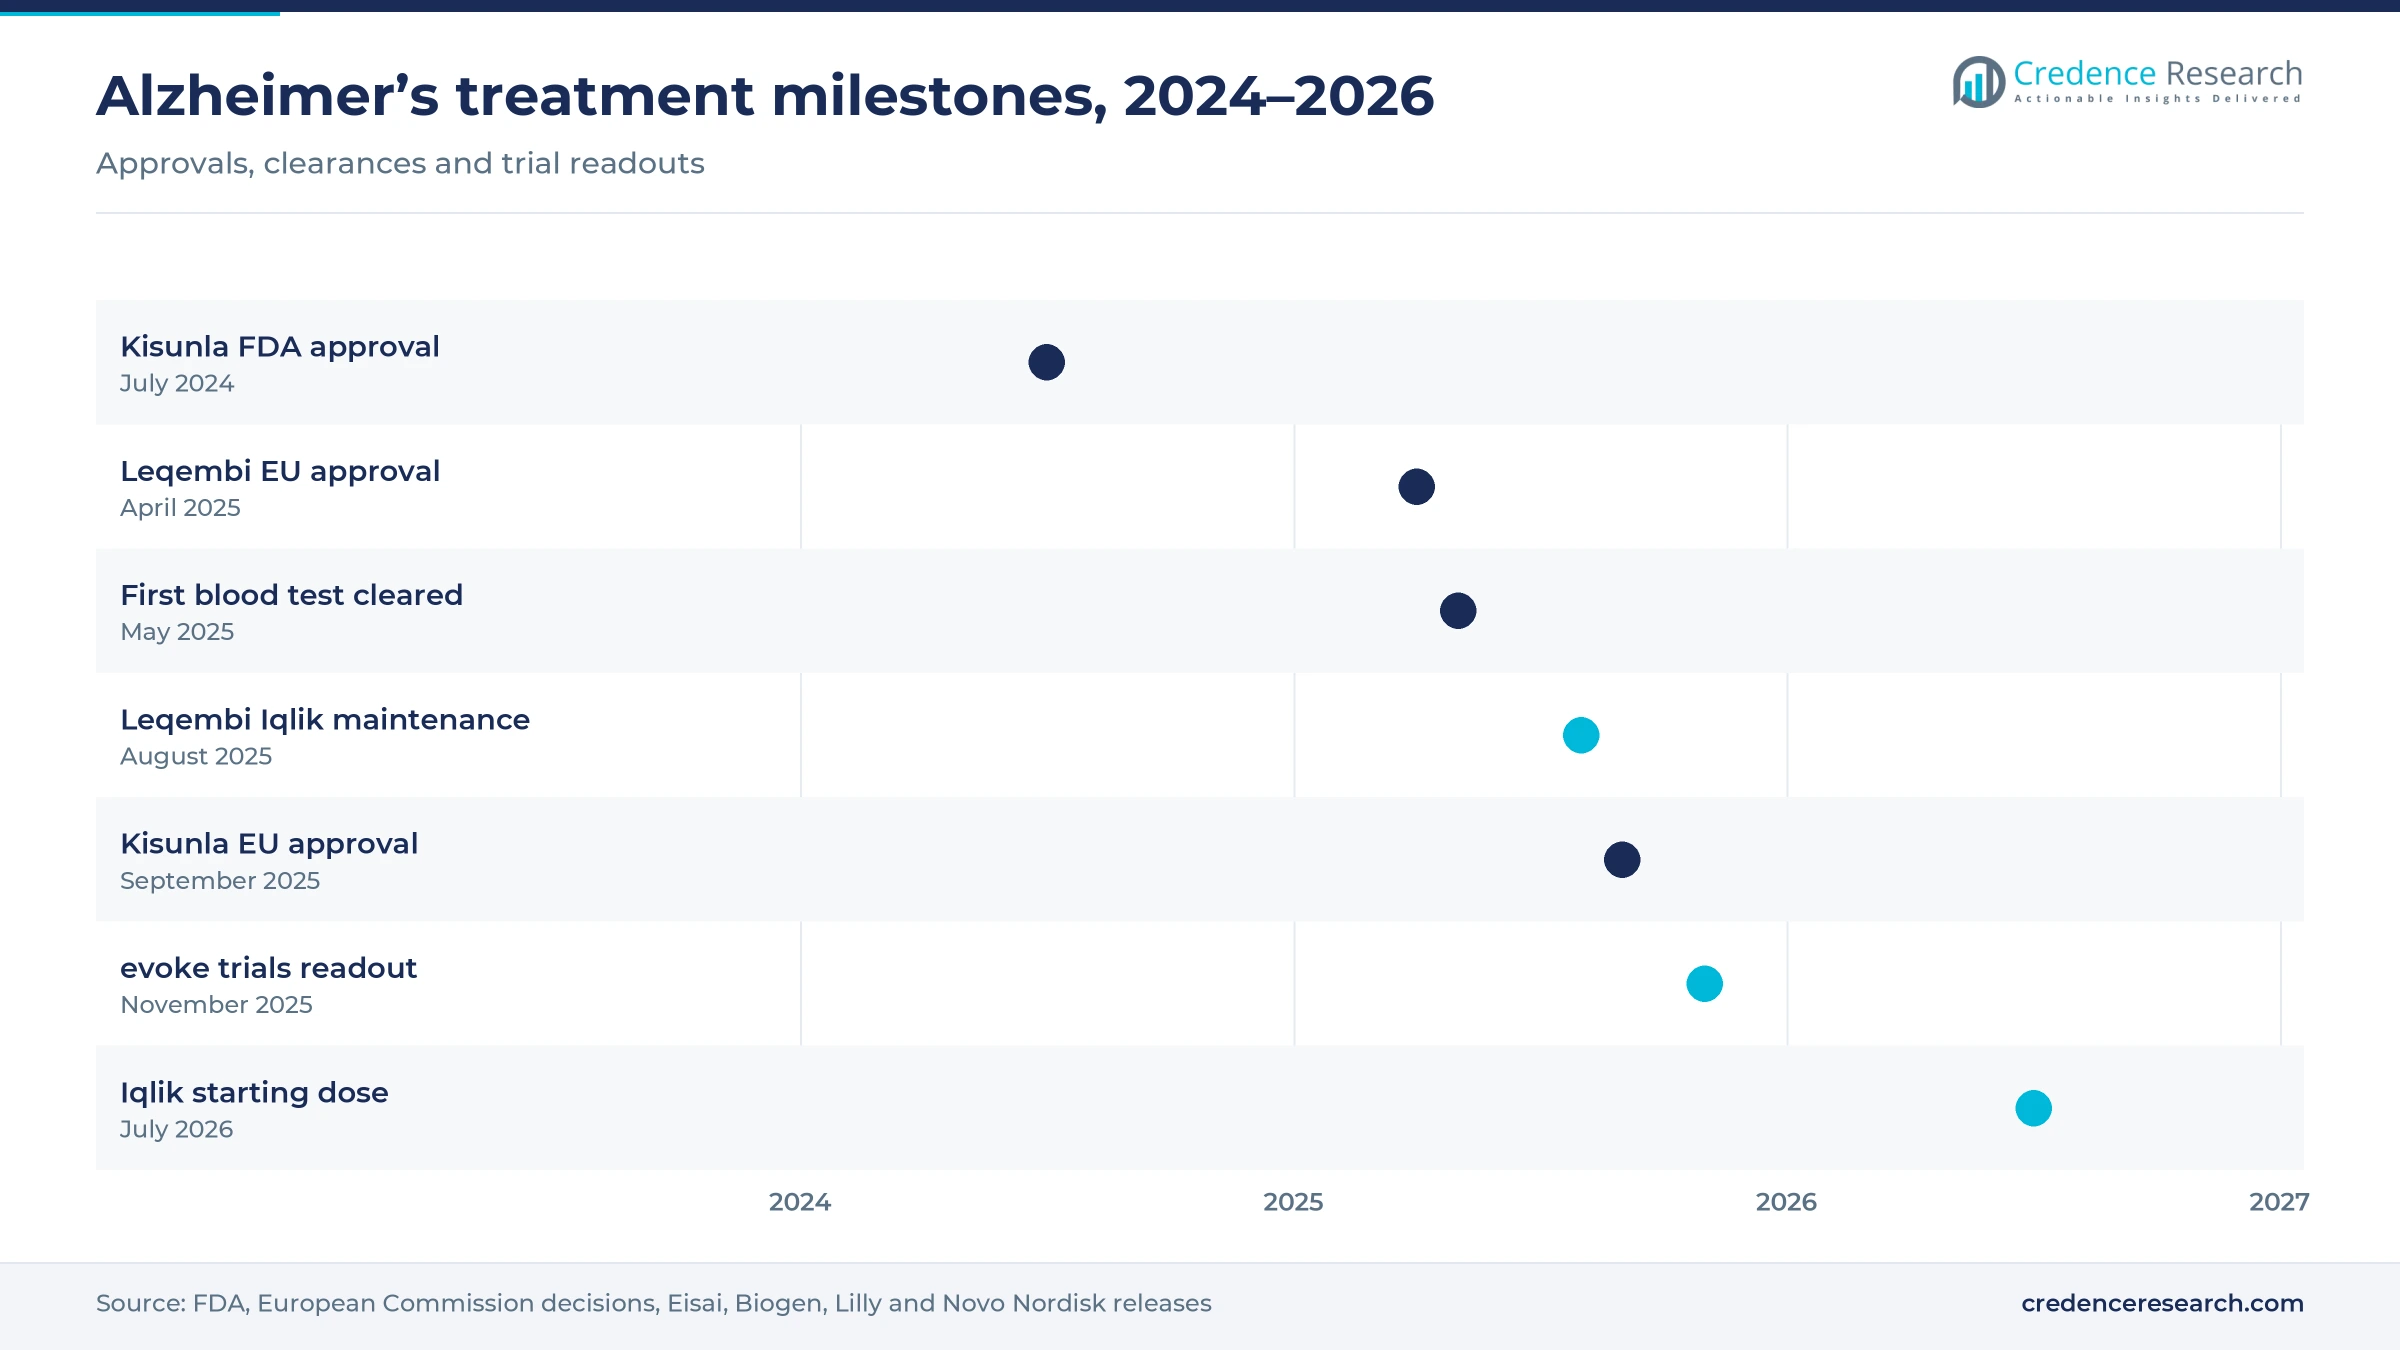
Disease-modifying antibodies lift value per patient because they are priced far above generic tablets and are given over many months. The FDA approved Kisunla (donanemab) in July 2024 for patients with mild cognitive impairment or mild dementia, based on a trial that randomized 1,736 patients. Lecanemab, sold as Leqembi, has been on the U.S. market since 2023 and is now approved in Europe, Japan and China. In turn, a small number of treated patients generates a large share of new value each year.
How do blood tests widen the diagnosed population?
Blood-based diagnosis widens the pool of confirmed patients because amyloid PET scans and spinal taps are costly and hard to access. In May 2025, the FDA cleared the first blood test to aid in diagnosing Alzheimer’s disease, a plasma ratio of pTau217 and beta-amyloid 1-42 from Fujirebio. Wider use of cognitive impairment biomarkers shortens the path from first symptoms to a treatment decision in primary care. This matters because antibodies work only in early disease, so faster diagnosis directly increases the number of eligible patients.
Why does at-home dosing ease capacity limits?
At-home dosing eases the capacity limits that have slowed antibody uptake in infusion centers and neurology clinics. Eisai and Biogen announced FDA approval of Leqembi Iqlik in August 2025, a weekly 360 mg subcutaneous injection for maintenance that takes about 15 seconds. In July 2026, the FDA also approved a subcutaneous starting dose of 500 mg weekly, given as two 250 mg injections. As a result, more patients can begin and stay on therapy without an infusion visit every two weeks.
Subcutaneous dosing and safer titration shift care
Shift from infusion toward subcutaneous care
A shift from infusion toward subcutaneous care is under way as antibody makers look to reduce the workload on clinics. Chairs at ambulatory infusion centers can become a bottleneck, because each patient needs regular visits plus MRI safety scans. Subcutaneous dosing moves part of that workload into the home and may lower the cost of each treatment year for health systems. In turn, community neurologists can manage more patients without relying on hospital infusion capacity.
Rising focus on safer dosing schedules
Rising attention to safety is changing how antibodies are started, since amyloid-related imaging abnormalities remain the main clinical concern. In July 2025, Lilly announced an updated Kisunla label with a modified titration schedule that cut ARIA-E rates to 14% from 24% at week 24. Lower rates of brain swelling can make neurologists more willing to treat eligible patients in routine practice. As a result, dosing refinements may matter as much as new molecules for uptake through 2030.
Opportunity in combination and earlier-stage treatment
Combination regimens and treatment before symptoms appear create an opening for companies with broad neurology pipelines. Researchers are testing whether antibodies given to people with amyloid but no symptoms can delay decline, which would widen the eligible population. Pairing antibodies with tau-targeting or symptomatic medicines could also raise value per patient if trials show added benefit. Companies that already sell cholinesterase inhibitors and memantine can use existing neurology sales teams to support these launches.
Opportunity in aging Asian and emerging markets
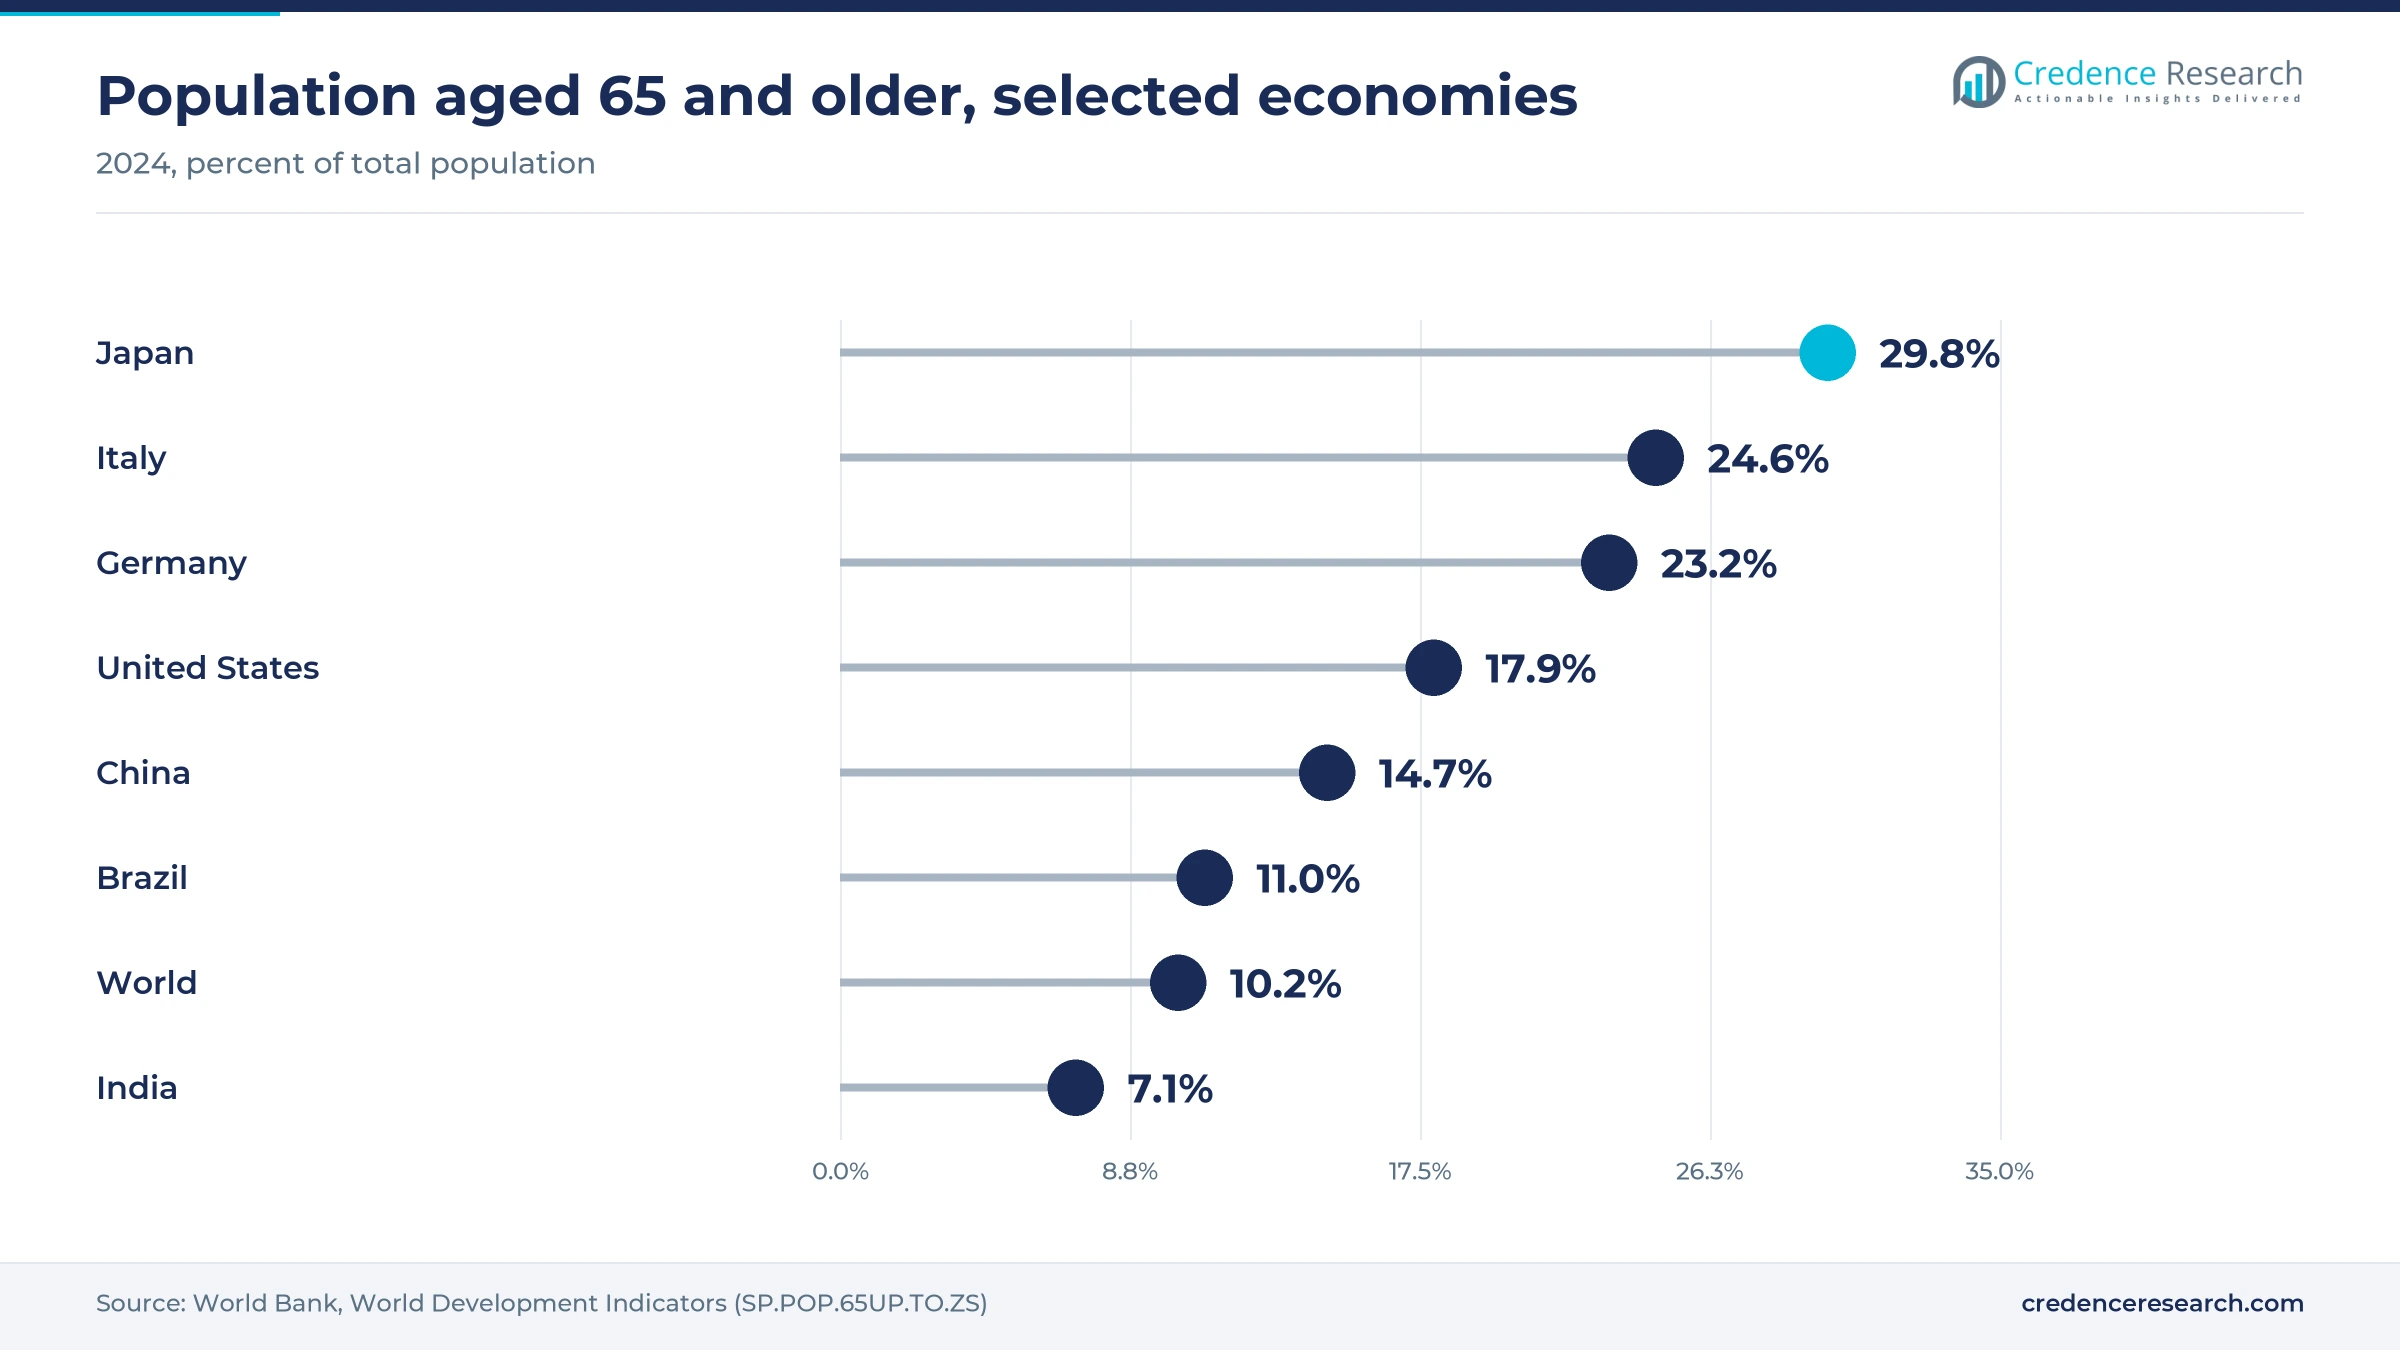
Asia Pacific and emerging markets offer an opening because aging is accelerating while specialist capacity is still being built. World Bank data show that people aged 65 and older made up 29.8% of Japan’s population and 14.7% of China’s in 2024. These large older populations already use donepezil and memantine widely, which gives antibody makers a base of diagnosed patients to reach. Local manufacturing of generics and tiered pricing for newer agents could widen access in middle-income countries.
Safety monitoring, eligibility limits and payer caution
Why do safety risks limit antibody uptake?
Safety risks limit antibody uptake because ARIA, a form of brain swelling or bleeding, requires repeated MRI monitoring during the first months of treatment. Patients who carry two copies of the ApoE4 gene face the highest risk, so European approvals exclude them from both antibodies. This narrows the eligible population in Europe and adds genetic testing to the care pathway before treatment can begin. As a result, many diagnosed patients remain on symptomatic medicines only, even when their disease is at an early stage.
How do eligibility rules narrow the treated group?
Eligibility rules narrow the treated group because antibodies are approved only for mild cognitive impairment or mild dementia with confirmed amyloid. Many patients are diagnosed at a moderate stage, when donepezil and memantine remain the only prescription options. Confirming amyloid with PET or spinal fluid adds cost and delay, although blood tests are starting to ease this step. In turn, only a small share of the 57 million people living with dementia worldwide can be considered for disease-modifying therapy.
Why are payers cautious about antibody spending?
Payers are cautious because antibody treatment adds drug, imaging and infusion costs for a benefit measured as slower decline rather than recovery. Several health technology assessment bodies in Europe have questioned the cost-effectiveness of lecanemab and donanemab at current prices. This pressure limits reimbursement in public systems and pushes companies toward price negotiations or outcome-based agreements. As a result, uptake outside the United States and Japan is likely to stay gradual through the late 2020s.
How do late-stage failures raise development risk?
Late-stage failures raise development risk for companies outside the antibody leaders and slow the arrival of new mechanisms. In November 2025, Novo Nordisk announced that its evoke and evoke+ trials of oral semaglutide, which enrolled 3,808 adults with early disease, did not slow progression. Results like this reduce investor appetite for new programs and leave treatment dependent on amyloid-targeting therapy. In turn, product choice beyond amyloid antibodies and generic symptomatic medicines is likely to remain narrow for several years.
Japan and China speed Asia while the U.S. holds value
| Region | Value, 2025 (USD billion) | Share, 2025 | CAGR, 2026–2035 |
|---|---|---|---|
| North America | 3.04 | 41.0% | 10.51% |
| Asia Pacific | 2.23 | 30.0% | 11.11% |
| Europe | 1.56 | 21.0% | 9.61% |
| Latin America | 0.33 | 4.5% | 9.81% |
| Middle East & Africa | 0.26 | 3.5% | 10.01% |
Why does North America lead in value?
North America held a 41.0% share of 2025 value and grows at 10.51% a year as antibody use expands across U.S. neurology practices. The FDA estimates that nearly 7 million Americans are living with Alzheimer’s disease, a number projected to rise to nearly 13 million. High prices for branded antibodies and Medicare coverage for eligible patients make the United States the largest single market. Canada and Mexico add demand mainly for generic symptomatic medicines, which keeps their share of regional value small.
How do approval limits shape demand in Europe?
Europe accounted for a 21.0% share of 2025 value and grows at 9.61% a year, the slowest pace among the five regions. The European Commission approved lecanemab in April 2025 and donanemab in September 2025, but only for ApoE4 non-carriers or heterozygotes with early disease. Public health systems also apply strict cost-effectiveness reviews, which slows reimbursement country by country. As a result, generic donepezil, rivastigmine and memantine continue to account for most prescriptions across Germany, France, Italy and Spain.
Why is Asia Pacific the fastest-growing region?
Asia Pacific held a 30.0% share of 2025 value and is the fastest-growing region at 11.11% a year through 2035. Japan, with one of the oldest populations in the world, approved lecanemab in 2023, and China approved it in January 2024. Large numbers of patients already take donepezil and memantine, which gives specialists a base for moving early-stage patients to antibodies. Growth in South Korea, Australia and India adds further volume as memory clinics expand in large cities.
What limits uptake in Latin America?
Latin America represented a 4.5% share of 2025 value and grows at 9.81% a year, led by Brazil, Mexico and Argentina. Most patients pay for generic cholinesterase inhibitors and memantine through public programs or out of pocket. Limited MRI capacity and high antibody prices are likely to keep disease-modifying treatment concentrated in private hospitals in large cities.
Where is demand building in the middle East and Africa?
Middle East and Africa held a 3.5% share of 2025 value and grows at 10.01% a year, with Gulf states accounting for most spending. Saudi Arabia and the United Arab Emirates are expanding neurology services and private insurance coverage for older residents. In much of Africa, low diagnosis rates mean that few patients receive any prescription medicine for dementia.
Approvals and trial readouts from 2024 to 2026
| Development | Status and market relevance |
|---|---|
| In July 2024, the FDA approved Eli Lilly’s Kisunla (donanemab) for early symptomatic Alzheimer’s disease after a trial in 1,736 patients. | Approved; second traditional U.S. approval for an amyloid-targeting antibody |
| In April 2025, Eisai and Biogen announced European Commission approval of Leqembi for ApoE4 non-carriers or heterozygotes with early disease. | Approved; first amyloid antibody authorized in the European Union |
| In August 2025, Eisai and Biogen announced FDA approval of Leqembi Iqlik, a weekly 360 mg subcutaneous injection for maintenance dosing. | Approved; moves maintenance treatment from infusion centers to the home |
| In November 2025, Novo Nordisk announced that its evoke and evoke+ trials of oral semaglutide did not slow Alzheimer’s disease progression. | Failed; leaves amyloid antibodies as the only disease-modifying class |
| In July 2026, the FDA approved a subcutaneous starting dose of Leqembi Iqlik, given as two 250 mg injections once a week. | Approved; allows treatment to start at home without infusion visits |
Delivery and monitoring tools that set the treatment pace
- Subcutaneous autoinjectors let patients take lecanemab at home after training, reducing infusion visits and travel for caregivers.
- Blood-based biomarkers confirm amyloid pathology without PET scans and help primary care doctors refer suitable patients sooner.
- Modified titration schedules start antibodies at lower doses to reduce the risk of brain swelling during the first months.
- Transdermal patches deliver rivastigmine through the skin, which reduces stomach side effects and helps caregivers manage daily dosing.
- Brain shuttle antibodies use transferrin receptor binding to carry more antibody across the blood-brain barrier, as with Roche’s trontinemab in Phase 3.
Need a Custom Version of This Report?
Tailor the scope, geography, or segments to your exact requirements.
- Custom geography or segment scope
- Direct access to our analyst team
Two antibody makers lead as generic makers hold volume
Competition splits between two antibody leaders and many generic producers of symptomatic medicines. Eisai, with partner Biogen, sells lecanemab in the United States, Europe, Japan and China, and is moving patients to subcutaneous dosing to defend its early lead. Eli Lilly competes with donanemab, which can be stopped once amyloid is cleared, a feature that appeals to payers. Johnson & Johnson, Roche, AbbVie and Bristol-Myers Squibb invest in tau, brain shuttle and neuropsychiatric programs, and AstraZeneca is also profiled. Smaller companies such as AC Immune and Cognition Therapeutics develop vaccines and small molecules, while C2N Diagnostics supplies blood tests that help identify eligible patients. Generic makers supply most donepezil, galantamine, rivastigmine and memantine volume, so price competition dominates the older product groups. Because antibody approvals require large trials, partnerships remain the main route for mid-sized companies to reach patients.
Companies profiled and their roles in this market
| Company | Type | Role in the market |
|---|---|---|
| Eisai Co., Ltd. | Originator | Lecanemab (Leqembi, Leqembi Iqlik) and donepezil (Aricept) |
| Biogen Inc. | Originator partner | Co-commercializes lecanemab with Eisai |
| Eli Lilly and Company | Originator | Donanemab (Kisunla) |
| F. Hoffmann-La Roche AG | Developer | Trontinemab brain shuttle antibody in Phase 3 |
| Johnson & Johnson Services, Inc. | Originator | Galantamine (Razadyne) and anti-tau research |
| AbbVie Inc. | Originator | Memantine and donepezil combination (Namzaric) and brain shuttle research |
| Bristol-Myers Squibb Company | Developer | Tau and neuropsychiatric programs |
| AstraZeneca PLC | Developer | Neuroscience research programs |
| AC Immune SA | Developer | Vaccines and small molecules against amyloid and tau |
| Cognition Therapeutics | Developer | Oral small molecule zervimesine |
| C2N Diagnostics | Diagnostics partner | Blood tests that support patient selection |
Why antibody uptake decides the growth path
Credence Research’s view is that antibody uptake, not generic volume, decides how fast value grows to 2035. Symptomatic tablets will keep most prescriptions, but their prices are already low, so they add little new value each year. Subcutaneous dosing and blood tests remove two of the largest barriers to antibody treatment and should lift the number of patients treated in early disease. The main swing factors are safety in routine practice, European reimbursement and whether earlier-stage trials succeed. Companies with positions across dementia treatment and diagnostics are best placed to capture this shift.
How the market values and splits were built
The report uses 2025 as the base year and forecasts value for each year from 2026 to 2035. Market values come from the Credence Research model, which combines treated patient estimates, treatment duration and price levels by product and region. Product, channel and regional splits are Credence Research estimates informed by public sources. These sources include WHO and World Bank statistics, FDA approvals and device clearances, European Commission decisions and company releases. Every dated event was checked against a regulator or company release before inclusion in the report.
Where treatment value moves by 2035
By 2035, the market reaches USD 20.05 billion, and antibodies are expected to account for a much larger part of value than today. Subcutaneous dosing at home should make treatment possible outside large hospitals, which supports uptake in community practice. Generic cholinesterase inhibitors and memantine will remain the base of prescriptions, especially for patients with moderate or severe disease. Asia Pacific gains share fastest, while North America keeps the largest share of value at the end of the period. The main risks are safety findings in routine use, tighter reimbursement in Europe and further trial failures for new mechanisms.
Frequently Asked Questions
How big is the Alzheimer’s disease drugs market?
Which region leads the Alzheimer’s disease drugs market?
Which product holds the largest share?
Which product group grows fastest?
What are the latest Alzheimer’s drug approvals?
What limits growth in the Alzheimer’s disease drugs market?
Which distribution channel grows fastest?
Who are the major companies in the Alzheimer’s disease drugs market?
Table of Content
Chapter 1 Market Segmentation
- 1.1 Segmentation Framework
- 1.1.1 Product and Service Classification
- 1.1.2 Application and End-Use Classification
- 1.1.3 Technology and Solution Classification
- 1.1.4 Customer and Distribution Channel Classification
- 1.1.5 Geographic Segmentation
- 1.1.6 Market Segment Definitions and Boundaries
- 1.2 By Product
- 1.2.1 Donepezil
- 1.2.2 NMDA Receptor Antagonist
- 1.2.3 Rivastigmine
- 1.2.4 Combination Drugs
- 1.2.5 Galantamine
- 1.2.6 Anti-amyloid Antibodies and Others
Chapter 2 Introduction
- 2.1 Report Objectives and Scope
- 2.2 Product Definition and Industry Terminology
- 2.3 Market Inclusions and Exclusions
- 2.4 Research Process
- 2.4.1 Primary Research and Expert Interviews
- 2.4.2 Secondary Research and Source Review
- 2.4.3 Top-Down and Bottom-Up Estimation
- 2.4.4 Data Triangulation and Verification
- 2.5 Market Size Measurement Basis
- 2.5.1 2025: USD 7.42 billion → 2035: USD 20.05 billion
- 2.6 Historical and Forecast Reference Periods
- 2.6.1 Historical Period: 2018-2025
- 2.6.2 Base Year: 2025
- 2.6.3 Forecast Period: 2025-2035
- 2.7 Research Assumptions and Limitations
Chapter 3 Executive Summary
- 3.1 Market Snapshot and Key Findings
- 3.2 Base-Year Market Size, 2025
- 3.3 Forecast Market Size, 2035
- 3.4 Revenue and Volume Growth Outlook
- 3.5 Key Demand and Supply Indicators
- 3.6 Leading Market Segments
- 3.7 Fastest-Growing Market Opportunities
- 3.8 Regional Performance Highlights
- 3.9 Technology and Industry Transformation
- 3.10 Competitive Landscape Summary
- 3.11 Analyst View and Strategic Implications
Chapter 4 Global Alzheimer’s Disease Drugs Market Trends and Developments
- 4.1 Historical Industry Development, 2018-2025
- 4.2 Recent Market Trends and Developments
- 4.3 Demand and Customer Behavior Trends
- 4.4 Technology and Product Innovation
- 4.5 Artificial Intelligence, Automation and Digitalization
- 4.6 Local Manufacturing and Supply Chain Realignment
- 4.7 Industry Partnerships, Mergers and Acquisitions
- 4.8 Sustainability and Circular Economy Developments
- 4.9 Government and Private Sector Investment Trends
- 4.10 Emerging Business Models and Commercialization
- 4.11 Industry Developments and Announcements
Chapter 5 Global Alzheimer’s Disease Drugs Market Production, Supply and Demand Analysis
- 5.1 Demand Trend and Consumption Analysis, 2018-2025
- 5.2 Demand Forecast, 2025-2035
- 5.3 Production and Output Trend, 2018-2025
- 5.4 Production and Output Forecast, 2025-2035
- 5.5 Installed Capacity and Capacity Utilization
- 5.6 Company-Wise Production Plants and Statistics
- 5.6.1 Installed Production Capacity
- 5.6.2 Actual Production
- 5.6.3 Planned Capacity and Expansion Targets
- 5.7 Supply Chain Structure and Procurement Trends
- 5.8 Supply-Demand Gap and Bottlenecks
- 5.9 Import Dependence and Sourcing Structure
- 5.10 Contract Manufacturing and Outsourcing
- 5.11 Regional Supply and Demand Concentration
Chapter 6 Global Alzheimer’s Disease Drugs Market Pricing Analysis
- 6.1 Pricing Structure and Measurement
- 6.2 Historical Pricing Trends, 2018-2025
- 6.3 Pricing Outlook, 2025-2035
- 6.4 Average Selling Price and Unit Economics
- 6.5 Pricing by Product and Market Segment
- 6.6 Geographic Pricing Differences
- 6.7 Key Input, Energy, Labor and Logistics Costs
- 6.8 Contract Pricing and Purchasing Models
- 6.9 Pricing Sensitivity and Competitive Positioning
- 6.10 Price, Margin and Profitability Implications
Chapter 7 Global Alzheimer’s Disease Drugs Market Dynamics
- 7.1 Market Growth Drivers
- 7.1.1 Demand-Side Drivers
- 7.1.2 Technology and Innovation Drivers
- 7.1.3 Infrastructure and Investment Drivers
- 7.1.4 Regulatory and Policy Drivers
- 7.2 Market Restraints
- 7.2.1 Cost and Affordability Constraints
- 7.2.2 Technology and Adoption Barriers
- 7.2.3 Supply Chain and Operational Constraints
- 7.3 Market Challenges
- 7.3.1 Competitive Pressure and Margin Erosion
- 7.3.2 Skills, Infrastructure and Implementation Gaps
- 7.4 Emerging Market Opportunities
- 7.5 Market Dynamics Impact and Time-Horizon Assessment
Chapter 8 Global Alzheimer’s Disease Drugs Value Chain Analysis
- 8.1 Industry Value Chain Overview
- 8.2 Upstream Suppliers and Critical Inputs
- 8.3 Technology and Component Providers
- 8.4 Manufacturing or Service Delivery
- 8.5 Distribution, Channel Partners and Integrators
- 8.6 Downstream Applications and End Users
- 8.7 Value Addition and Profit Pools
- 8.8 Vertical Integration and Outsourcing
- 8.9 Supplier Concentration and Risk
- 8.10 Supply Chain Localization and Resilience
Chapter 9 Global Alzheimer’s Disease Drugs Market Regulations and Policies
- 9.1 Relevant Laws, Standards and Compliance Frameworks
- 9.2 Product, Service, Safety and Quality Requirements
- 9.3 Government Policies, Incentives and Subsidies
- 9.4 Imports, Exports and Trade Barriers
- 9.5 Public Procurement and Local Content Requirements
- 9.6 Environmental and Sustainability Compliance
- 9.7 Upcoming Policy Changes and Market Implications
Chapter 10 Global Alzheimer’s Disease Drugs Market Hotspots and Opportunities
- 10.1 Market Opportunity Mapping and Growth Hotspots
- 10.2 High-Growth Applications and Customer Groups
- 10.3 Underserved Markets and White-Space Opportunities
- 10.4 Emerging Technology and Product Opportunities
- 10.5 New Capacity and Investment Hotspots
- 10.6 Market Entry and Expansion Opportunities
- 10.7 Distribution and Partnership Opportunities
- 10.8 Near-Term and Long-Term Commercial Potential
- 10.9 Opportunity Attractiveness and Execution Risks
Chapter 11 Global Alzheimer’s Disease Drugs Market Outlook, 2025-2035
- 11.1 Market Size and Analysis
- 11.1.1 Revenue (Market Measurement: 2025: USD 7.42 billion → 2035: USD 20.05 billion)
- 11.1.2 Market Volume and Quantity Sold
- 11.1.3 Historical Market Size, 2018-2025
- 11.1.4 Base-Year Market Size, 2025
- 11.2 Market Forecast, 2025-2035
- 11.2.1 Revenue Forecast to 2035
- 11.2.2 Volume Forecast to 2035
- 11.2.3 CAGR and Year-on-Year Growth
- 11.2.4 Incremental Revenue Opportunity
- 11.3 Forecast Assumptions and Scenario Analysis
- 11.3.1 Base-Case Forecast
- 11.3.2 Optimistic and Conservative Scenarios
- 11.3.3 Technology, Pricing and Policy Sensitivities
- 11.4 Market Attractiveness and Growth Outlook
Chapter 12 Global Alzheimer’s Disease Drugs Market Segmentation and Outlook
- 12.1 Segmentation Summary and Market Shares, 2025
- 12.2 Largest and Fastest-Growing Segments
- 12.3 By Product - Market Size and Forecast, 2025-2035
- 12.3.1 Segment Definition and Scope
- 12.3.2 Historical Market Size, 2018-2025
- 12.3.3 Revenue Forecast, 2025-2035
- 12.3.4 Volume Forecast, 2025-2035
- 12.3.5 Base-Year Market Share, 2025
- 12.3.6 Segment CAGR and Growth Drivers
- 12.3.7 Subsegment Market Size and Forecast
- 12.3.7.1 Donepezil
- 12.3.7.2 NMDA Receptor Antagonist
- 12.3.7.3 Rivastigmine
- 12.3.7.4 Combination Drugs
- 12.3.7.5 Galantamine
- 12.3.7.6 Anti-amyloid Antibodies and Others
- 12.3.8 Subsegment Pricing and Adoption Trends
- 12.3.9 Leading Suppliers and Competition
- 12.3.10 Regional Demand and Opportunities
- 12.4 Segment Growth Comparison
- 12.5 Segment Attractiveness and Priority Matrix
Chapter 13 Global Alzheimer’s Disease Drugs Geographic Market Outlook, 2025-2035
- 13.1 Regional Market Size and Share, 2025
- 13.2 Regional Market Forecast, 2025-2035
- 13.3 Regional Pricing, Production and Demand Differences
- 13.4 North America
- 13.4.1 United States
- 13.4.2 Canada
- 13.4.3 Mexico
- 13.5 Europe
- 13.5.1 Germany
- 13.5.2 France
- 13.5.3 Italy
- 13.5.4 United Kingdom
- 13.5.5 Spain
- 13.5.6 Poland
- 13.5.7 Russia
- 13.5.8 Netherlands
- 13.5.9 Belgium
- 13.5.10 Sweden
- 13.5.11 Denmark
- 13.5.12 Norway
- 13.5.13 Rest of Europe
- 13.6 Asia Pacific
- 13.6.1 China
- 13.6.2 India
- 13.6.3 Japan
- 13.6.4 South Korea
- 13.6.5 Thailand
- 13.6.6 Indonesia
- 13.6.7 Vietnam
- 13.6.8 Malaysia
- 13.6.9 Australia
- 13.6.10 Rest of Asia Pacific
- 13.7 Latin America
- 13.7.1 Brazil
- 13.7.2 Argentina
- 13.7.3 Colombia
- 13.7.4 Chile
- 13.7.5 Rest of Latin America
- 13.8 Middle East
- 13.8.1 Saudi Arabia
- 13.8.2 United Arab Emirates
- 13.8.3 Turkey
- 13.8.4 Israel
- 13.8.5 Iran
- 13.8.6 Rest of the Middle East
- 13.9 Africa
- 13.9.1 South Africa
- 13.9.2 Egypt
- 13.9.3 Nigeria
- 13.9.4 Morocco
- 13.9.5 Rest of Africa
- 13.10 Regional Investment, Policy and Supply Chain Differences
- 13.11 Regional Competitive Landscape
- 13.12 Geographic Growth Hotspots
Chapter 14 Global Alzheimer’s Disease Drugs Technology, Innovation and Sustainability Outlook
- 14.1 Technology Landscape and Maturity
- 14.2 Product, Process and Service Innovation
- 14.3 AI, Automation and Digital Tools in the Industry
- 14.4 Technology Adoption and Performance Benchmarking
- 14.5 Innovation Pipeline and R&D Investment
- 14.6 Patent and Intellectual Property Trends
- 14.7 Energy Efficiency and Resource Management
- 14.8 Sustainability, Recycling and Circularity
- 14.9 Technology Roadmap, 2025-2035
- 14.10 Risks of Obsolescence and Technology Substitution
Chapter 15 Global Alzheimer’s Disease Drugs Market Key Strategic Imperatives
- 15.1 Growth and Market Entry Priorities
- 15.2 High-Return Products and Segments
- 15.3 Pricing, Profitability and Cost Optimization
- 15.4 Technology Investment and Product Differentiation
- 15.5 Supply Chain Localization and Resilience
- 15.6 Distribution and Customer Acquisition
- 15.7 Partnership, Acquisition and Capacity Strategy
- 15.8 Regional Expansion Priorities
- 15.9 Short-, Medium- and Long-Term Actions
Chapter 16 Competition Outlook
- 16.1 Industry Competition Characteristics
- 16.2 Market Structure and Concentration
- 16.3 Market Share and Competitive Positioning, 2025
- 16.4 Company-Wise Revenue and Product Benchmarking
- 16.5 Production and Service Capacity Benchmarking
- 16.6 Technology, Pricing and Differentiation
- 16.7 Regional Footprint and Distribution Strength
- 16.8 Mergers, Acquisitions and Strategic Alliances
- 16.9 New Entrants and Competitive Threats
- 16.10 Porter's Five Forces and Industry Attractiveness
- 16.11 Competitive Outlook, 2025-2035
Chapter 17 Company Profiles
- 17.1 Company Coverage and Selection Criteria
- 17.2 AbbVie Inc.
- 17.2.1 Business Description
- 17.2.2 Company Ownership and Geographic Presence
- 17.2.3 Product and Service Portfolio
- 17.2.4 Manufacturing and Operating Footprint
- 17.2.5 Production Capacity and Expansion Plans
- 17.2.6 Financial Performance and Investment
- 17.2.7 Market Share and Competitive Position
- 17.2.8 Technology and Innovation Capabilities
- 17.2.9 Strategic Alliances or Partnerships
- 17.2.10 Recent Developments
- 17.2.11 Growth Strategy and Outlook
- 17.3 AC Immune SA
- 17.4 AstraZeneca PLC
- 17.5 Biogen Inc.
- 17.6 Bristol-Myers Squibb Company
- 17.7 C2N Diagnostics
- 17.8 Cognition Therapeutics
- 17.9 Eisai Co., Ltd.
- 17.10 Eli Lilly and Company
- 17.11 F. Hoffmann-La Roche AG
- 17.12 Johnson & Johnson Services, Inc.
- 17.13 Other Relevant Market Participants
Note: Every listed company is profiled on the structure shown under the first company. The company list is preliminary and may change based on research findings, market developments, data availability and client requirements.
Chapter 18 Disclaimer
- 18.1 Research and Forecast Disclaimer
- 18.2 Data Source and Estimation Limitations
Note: The depth of individual sections depends on data availability for this market. Volume, capacity, trade and other unit-based metrics are included where applicable.

