
Market Overview
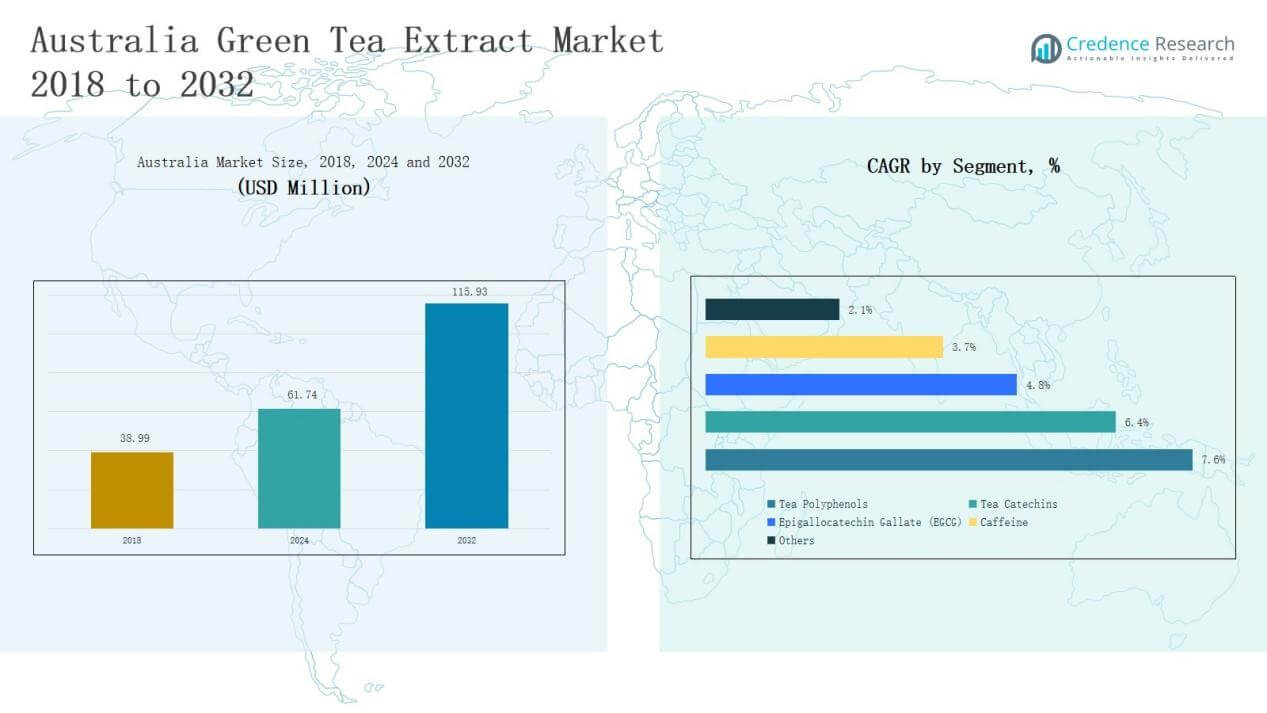
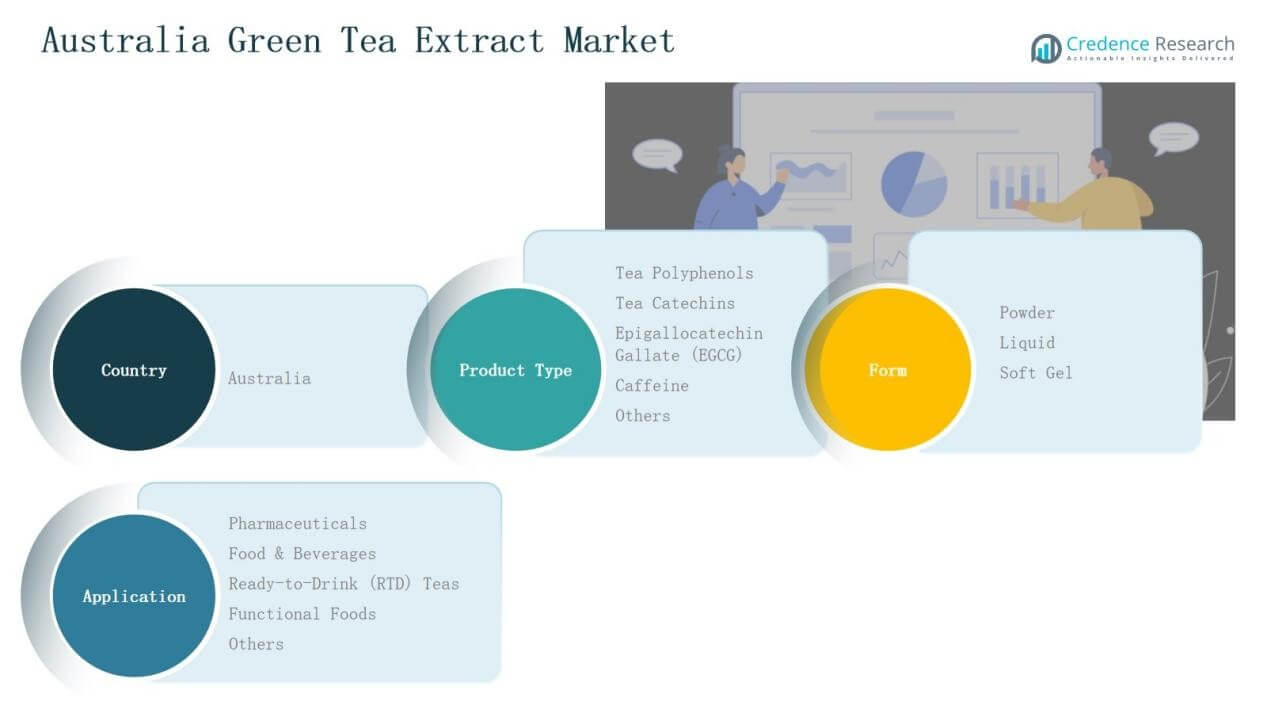
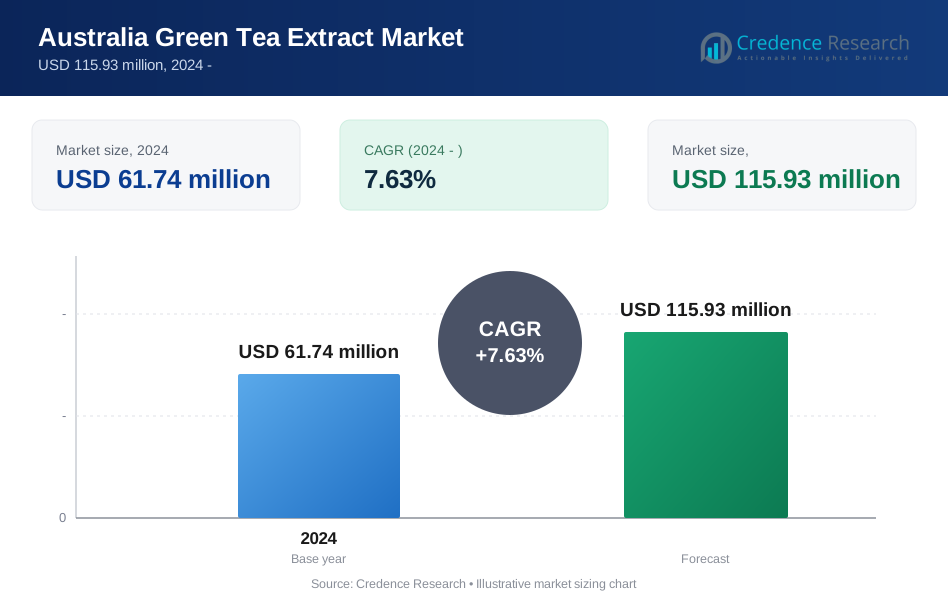
Australia Green Tea Extract Market size was valued at USD 38.99 million in 2018 to USD 61.74 million in 2024 and is anticipated to reach USD 115.93 million by 2032, at a CAGR of 7.63% during the forecast period.
| REPORT ATTRIBUTE | DETAILS |
|---|---|
| Historical Period | 2020-2023 |
| Base Year | 2024 |
| Forecast Period | 2025-2032 |
| Australia Green Tea Extract Market Size 2024 | USD 61.74 Million |
| Australia Green Tea Extract Market, CAGR | 7.63% |
| Australia Green Tea Extract Market Size 2032 | USD 115.93 Million |
The Australia Green Tea Extract Market features strong competition led by companies such as TPI Enterprises Ltd., NutraCare Australia Pty Ltd., Australian Botanical Products, Tea Life Australia, Herbs of Gold, Botani Pty Ltd., Australian Tea Masters, Bulk Nutrients, MediHerb, and Flavour Makers Pty Ltd. These players compete through product innovation, diversified portfolios, and expanding distribution across both offline and online channels. Many focus on clean-label, organic, and EGCG-rich formulations to capture health-conscious consumers. Regionally, New South Wales dominates with a 32% market share, driven by a large urban population, robust retail infrastructure, and high adoption of nutraceuticals and functional beverages. This combination of competitive strategies and regional strength positions the market for steady growth across healthcare, food, and wellness applications.
Market Insights
- The Australia Green Tea Extract Market grew from USD 38.99 million in 2018 to USD 61.74 million in 2024 and is projected to reach USD 115.93 million by 2032 at a CAGR of 7.63%.
- Tea Catechins lead the product type segment with 34% share, driven by strong antioxidant properties and growing adoption in pharmaceuticals and nutraceuticals for cardiovascular health and weight management.
- Powder form dominates with 46% share due to its versatility in supplements, beverages, and functional foods, while liquid form follows with 36% and soft gels hold 18%.
- Food & Beverages command 38% share, followed by pharmaceuticals at 27%, highlighting consumer demand for fortified foods and clinically supported health benefits in supplements.
- New South Wales is the leading region with 32% share, supported by urban population growth, robust retail infrastructure, and high adoption of nutraceutical and functional beverage products.
 Market Segment Insights
By Product Type
Tea Catechins hold the dominant share of 34% in the Australia Green Tea Extract Market. Their strong presence is driven by proven antioxidant properties that support cardiovascular health and weight management. Pharmaceutical companies and nutraceutical firms prefer catechins for their bioactive effectiveness in supplements. Tea Polyphenols account for 27%, supported by their broad applications in food fortification and cosmetic formulations. Epigallocatechin Gallate (EGCG) holds 19%, mainly due to clinical research backing its anti-cancer and anti-inflammatory benefits. Caffeine contributes 12%, sustained by demand in energy products, while others make up the remaining 8%, led by specialty blends and emerging extracts.
For instance, Caruso's Natural Health introduced Green Tea 25,000 tablets, which are promoted for metabolism support, calorie burning, and energy enhancement; these nutraceutical tablets leverage the high catechin content for weight management benefits.
By Form
Powder form leads with a 46% share in the Australia Green Tea Extract Market. Its dominance stems from versatility in tablets, capsules, beverages, and functional foods. Manufacturers favor powder for its stability, easy transport, and controlled dosing. Liquid form follows with 36%, benefiting from its use in ready-to-drink teas, concentrates, and cosmetic solutions. Soft gel captures 18%, supported by pharmaceutical and nutraceutical firms targeting premium supplement users. Growth in this segment is also driven by consumer demand for convenient single-dose formats.
By Application
Food & Beverages dominate with a 38% share in the Australia Green Tea Extract Market. Demand is fueled by rising health awareness and integration into fortified drinks, snacks, and functional foods. Pharmaceuticals represent 27%, supported by strong clinical evidence and inclusion in formulations addressing metabolic and cardiovascular health. Ready-to-Drink (RTD) teas capture 18%, driven by urban consumers seeking convenience and natural wellness. Functional Foods hold 11%, supported by product innovation in cereals, yogurts, and health bars. Others account for 6%, covering niche uses in cosmetics and dietary blends.
For instance, Asahi Beverages, the official bottler and distributor for Lipton Iced Tea in Australia, offers a range of Lipton Iced Tea Zero Sugar products, which align with consumer demand for RTD wellness drinks.
Key Growth Drivers
Rising Demand for Natural Health Supplements
The Australia Green Tea Extract Market benefits from growing consumer preference for natural and plant-based supplements. Increasing awareness of the antioxidant, anti-inflammatory, and metabolic health benefits of green tea extract fuels its inclusion in nutraceuticals and pharmaceuticals. Rising cases of lifestyle-related health issues, such as obesity and cardiovascular disease, further drive demand. Local manufacturers and global players are expanding product portfolios with catechins and EGCG-based offerings to address preventive healthcare needs, strengthening market penetration and consumer acceptance.
Expansion in Functional Food and Beverage Industry
The surge in fortified beverages, functional snacks, and ready-to-drink teas supports strong growth in Australia’s market. Food and beverage companies increasingly incorporate green tea extracts to meet rising health-conscious demand. This integration aligns with the trend of replacing synthetic additives with natural alternatives, improving product positioning among clean-label consumers. Ready-to-drink teas and functional foods enriched with tea catechins and polyphenols gain traction in supermarkets and online channels. The sector also benefits from marketing strategies focused on wellness, fitness, and immunity-boosting attributes.
For instance, Origin Tea introduced a range of sparkling iced teas at Woolworths stores, featuring flavors like Sneaky Peach and Tropical Kiss. These low-sugar, low-calorie beverages appeal to consumers seeking fizzy drinks with added health benefits.
Supportive Research and Regulatory Approvals
Scientific research validating the therapeutic benefits of green tea extract drives confidence among consumers and healthcare providers. Evidence linking EGCG and polyphenols to improved cardiovascular health, cancer prevention, and weight management enhances their adoption in pharmaceuticals. Regulatory approvals by Australian authorities for safe use in dietary supplements and fortified products strengthen industry credibility. Supportive policies also encourage local production and innovation in extraction technologies. Together, these factors create a favorable ecosystem for manufacturers, ensuring long-term market sustainability and competitive growth opportunities.
For instance, Taiyo GmbH announced the expansion of its Sunphenon green tea extract line, positioning it for functional beverages and weight management formulations with clinically documented EGCG efficacy.
 Key Trends & Opportunities
Growth in Clean-Label and Plant-Based Products
Australia’s consumers show rising preference for clean-label and plant-based products, boosting demand for green tea extract. Its natural origin, coupled with recognized health benefits, positions it as an ideal ingredient for brands targeting eco-conscious and wellness-driven buyers. Companies leverage this opportunity by developing organic extracts, vegan-certified supplements, and plant-based formulations. This trend aligns with broader sustainability goals and drives expansion into new product categories, ranging from fortified beverages to personal care products, creating significant long-term opportunities.
For instance, Else Nutrition launched its soy-free, plant-based infant and toddler formula made from almond, buckwheat, and tapioca, providing clean-label, allergen-friendly options that align with health-conscious values.
commerce and Direct-to-Consumer Expansion Digital retail platforms are reshaping market distribution channels, offering direct access to health-focused buyers. E-commerce enables smaller Australian brands and herbal supplement companies to reach niche consumers with targeted marketing. Subscription models, personalized wellness kits, and online consultations further boost engagement. The rising popularity of online sales for functional foods, beverages, and supplements accelerates growth for green tea extract players. This opportunity strengthens competitiveness and allows businesses to scale operations cost-effectively while meeting growing consumer demand for convenience and accessibility.For instance, Peony Parcel in Australia offers quarterly self-care subscription boxes that include 5 to 7 premium beauty and wellness products from boutique and trending international brands, helping consumers create a spa-like experience at home.
Key Challenges
High Production Costs and Raw Material Dependence
The Australia Green Tea Extract Market faces challenges from high production costs and dependence on imported raw materials. Premium-grade extracts require advanced processing and consistent supply chains, raising overall expenses. Dependence on imports from Asia, particularly China and Japan, makes the market vulnerable to price fluctuations and supply disruptions. These cost pressures limit affordability for smaller manufacturers and consumers, reducing competitiveness compared to other plant-based alternatives. Addressing this challenge requires investments in local sourcing and sustainable production methods.
Intense Market Competition
The market experiences high competition from both multinational corporations and domestic players. Established brands leverage strong distribution networks, marketing budgets, and diversified product portfolios to maintain dominance. Small and medium-sized enterprises face challenges in brand visibility, pricing strategies, and regulatory compliance. Furthermore, the presence of substitute ingredients, such as spirulina, turmeric, and other herbal extracts, intensifies competition. This dynamic restricts smaller players’ growth potential, demanding continuous innovation, niche targeting, and partnerships to stay relevant in the evolving market landscape.
Regulatory and Quality Compliance Issues
Compliance with strict regulations on health claims, product safety, and labeling presents ongoing challenges. Green tea extract products must meet stringent Australian standards, requiring extensive testing and documentation. Small manufacturers may struggle to invest in compliance infrastructure, delaying market entry or expansion. Mislabeling, exaggerated claims, or quality inconsistencies risk damaging consumer trust and brand reputation. Navigating these hurdles requires strategic investment in quality assurance, certifications, and transparent communication to maintain competitiveness and safeguard long-term market positioning.
Regional Analysis
New South Wales
New South Wales leads the Australia Green Tea Extract Market with a 32% share. The region benefits from a large urban population with high awareness of preventive healthcare and natural supplements. Strong retail infrastructure and wide availability of green tea extract products in pharmacies and supermarkets support market penetration. Food and beverage companies in Sydney also integrate extracts into functional foods and ready-to-drink teas. Rising disposable incomes and demand for clean-label nutrition further drive growth. It remains the most competitive and innovation-driven state in the country.
Victoria
Victoria accounts for a 27% share of the Australia Green Tea Extract Market. The state’s growing demand is supported by its strong presence of nutraceutical firms and health-conscious consumers in Melbourne. Rising adoption of green tea extract in functional beverages, dietary supplements, and pharmaceutical applications strengthens its growth. Government-backed health initiatives and widespread awareness campaigns on natural wellness products encourage consumer adoption. E-commerce platforms in the state also provide a strong push for small and medium-sized companies. It continues to act as a hub for innovation and product diversification.
Queensland
Queensland holds a 19% share of the Australia Green Tea Extract Market. Consumer interest is rising, driven by fitness trends, weight management demand, and use of functional foods. Local players benefit from a tourism-driven economy, which creates opportunities for wellness products in hotels, resorts, and health stores. The region also shows growing demand for ready-to-drink teas and organic formulations. Evolving distribution networks and specialty retailers strengthen accessibility across urban centers. It is emerging as a promising contributor to long-term national market growth.
Western Australia
Western Australia captures a 12% share of the Australia Green Tea Extract Market. Growing consumer awareness of plant-based health products and premium supplements drives expansion. Demand is supported by Perth’s urban market and growing retail penetration. Pharmaceutical and nutraceutical companies target niche consumer groups with products containing catechins and EGCG. Import reliance remains higher in this region, yet distribution channels continue to expand steadily. It demonstrates strong growth potential with increasing health-oriented consumer spending.
Rest of Australia
The Rest of Australia contributes 10% share to the Australia Green Tea Extract Market. Smaller cities and rural areas show steady demand, primarily supported by e-commerce and specialty health stores. Rising health awareness among younger demographics improves acceptance of functional foods and supplements. Although the base is smaller compared to larger states, it offers untapped opportunities for regional expansion. Growing focus on organic and clean-label products enhances competitiveness. It represents a supportive market environment for future growth across underserved areas.
Market Segmentations:
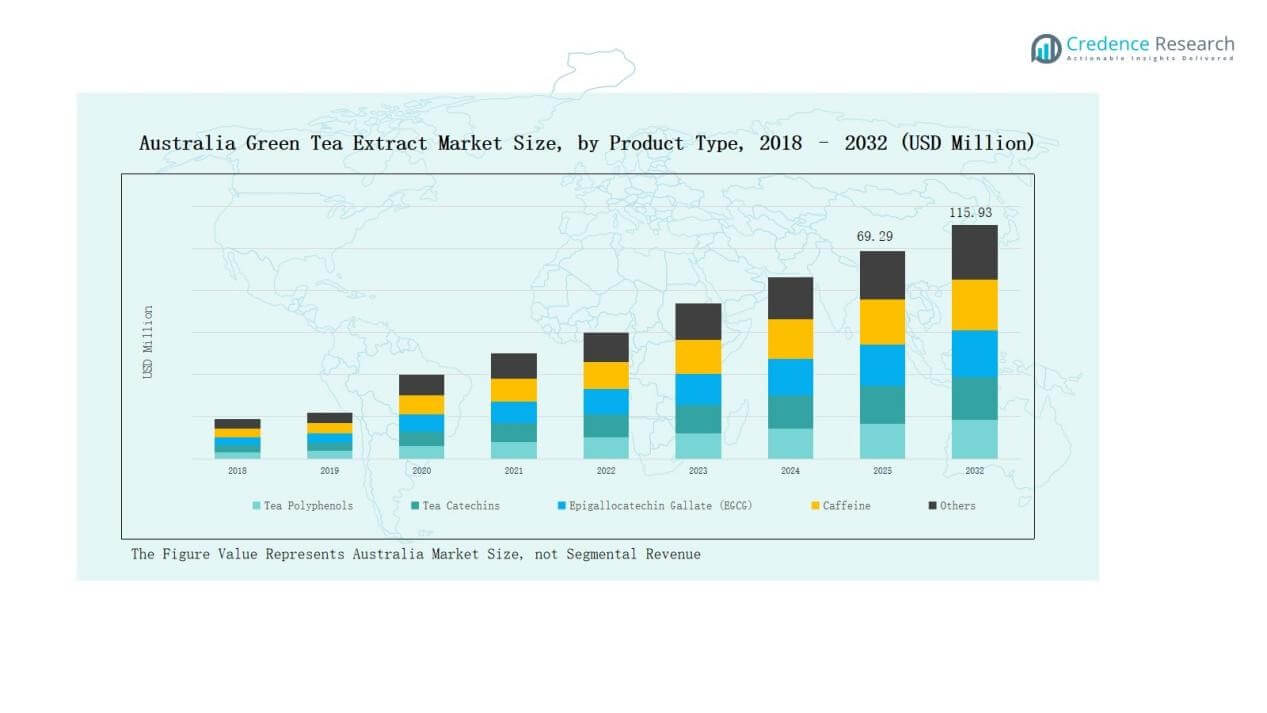
By Product Type
- Tea Polyphenols
- Tea Catechins
- Epigallocatechin Gallate (EGCG)
- Caffeine
- Others
By Form
- Powder
- Liquid
- Soft Gel
By Application
- Pharmaceuticals
- Food & Beverages
- Ready-to-Drink (RTD) Teas
- Functional Foods
- Others
By Region
- New South Wales
- Victoria
- Queensland
- Western Australia
- Rest of Australia
Competitive Landscape
The Australia Green Tea Extract Market is highly competitive, with a mix of multinational corporations and domestic firms driving growth. Leading players such as TPI Enterprises Ltd., NutraCare Australia Pty Ltd., Australian Botanical Products, Tea Life Australia, and Herbs of Gold maintain strong positions through diversified product portfolios and established distribution networks. These companies focus on developing formulations enriched with catechins, polyphenols, and EGCG to target both nutraceutical and functional food segments. Smaller players, including Botani Pty Ltd., Australian Tea Masters, Bulk Nutrients, MediHerb, and Flavour Makers Pty Ltd., strengthen competition by catering to niche markets with organic, clean-label, and specialty products. Strategic initiatives such as product innovation, partnerships with retailers, and expansion into e-commerce channels enhance competitiveness. Regulatory compliance and quality assurance remain key differentiators, as consumers demand safe and authentic products. The competitive landscape is marked by continuous innovation and positioning around health, wellness, and sustainability trends.
Key Players
- TPI Enterprises Ltd.
- NutraCare Australia Pty Ltd.
- Australian Botanical Products
- Tea Life Australia
- Herbs of Gold
- Botani Pty Ltd
- Australian Tea Masters
- Bulk Nutrients
- MediHerb
- Flavour Makers Pty Ltd
Recent Developments
- In April 2024, Twinings expanded Australia's green tea market by introducing Matcha Green, a blend of steamed and roasted green teas that boosted demand for antioxidant-fortified wellness drinks across the country.
- In October 2024, PLT Health Solutions launched Cellflo6, a patented green tea extract for energy, sports performance, and wellness formulations, featured in products like the 7-Select Fusion Energy beverage available at multiple retail outlets.
- In February 2025, Australia’s Poisons Standard was amended for Camellia sinensis extract (green tea extract).
Report Coverage
The research report offers an in-depth analysis based on Product Type, Form, Application and Region. It details leading market players, providing an overview of their business, product offerings, investments, revenue streams, and key applications. Additionally, the report includes insights into the competitive environment, SWOT analysis, current market trends, as well as the primary drivers and constraints. Furthermore, it discusses various factors that have driven market expansion in recent years. The report also explores market dynamics, regulatory scenarios, and technological advancements that are shaping the industry. It assesses the impact of external factors and global economic changes on market growth. Lastly, it provides strategic recommendations for new entrants and established companies to navigate the complexities of the market.
Future Outlook
- Demand for green tea extract will expand with rising health and wellness awareness.
- Functional food and beverage applications will strengthen market adoption across consumer groups.
- Pharmaceutical usage will increase with growing clinical validation of catechins and EGCG benefits.
- Clean-label and organic extracts will gain traction among eco-conscious consumers.
- E-commerce and direct-to-consumer channels will accelerate product accessibility nationwide.
- Ready-to-drink teas will witness stronger demand from younger urban populations.
- Local sourcing and sustainable production will reduce reliance on imports.
- Premium supplement formats like soft gels will grow in popularity among high-income groups.
- Innovation in fortified foods will create new opportunities for niche product launches.
- Regulatory clarity and quality certifications will improve consumer trust and brand competitiveness.
Request a Free Sample
Fill in your details and we'll send you a free sample report.
- Sample data tables & charts
- Research methodology
Need a Custom Version of This Report?
Tailor the scope, geography, or segments to your exact requirements.
- Custom geography or segment scope
- Direct access to our analyst team
Frequently Asked Questions
What is the current market size for Australia Green Tea Extract Market, and what is its projected size in 2032?
At what Compound Annual Growth Rate is the Australia Green Tea Extract Market projected to grow between 2025 and 2032?
Which Australia Green Tea Extract Market segment held the largest share in 2024?
What are the primary factors fueling the growth of the Australia Green Tea Extract Market?
Who are the leading companies in the Australia Green Tea Extract Market?
Which region commanded the largest share of the Australia Green Tea Extract Market in 2024?
Table of Content
Chapter 1. Report Introduction
- 1.1 Report Description & Purpose
- 1.1.1 Report Title & Market Definition
- 1.1.2 Unique Selling Propositions (USP) & Key Differentiators
- 1.1.3 Value Proposition for Stakeholders
- 1.2 Research Objectives
- 1.2.1 Market Sizing Objectives (Volume & Revenue)
- 1.2.2 Segmentation Objectives
- 1.2.3 Competitive Intelligence Objectives
- 1.2.4 Forecast & Scenario Objectives
- 1.3 Report Scope
- 1.3.1 Australia Green Tea Extract Scope – Types & Subtypes Covered
- 1.3.2 Geographic Scope – Regions & Countries Covered
- 1.3.3 Historical Period, Base Year & Forecast Period (2024; forecast to the forecast period)
- 1.3.4 Inclusions & Exclusions
- 1.4 HS Code & Classification Framework
- 1.5 Currency, Units & Pricing Basis
- 1.6 Target Stakeholders
- 1.7 Limitations & Assumptions
Chapter 2. Executive Summary
- 2.1 Global Australia Green Tea Extract Market Snapshot
- 2.1.1 Market Size – Historical (2024) & Forecast (the forecast period) (2024: USD 61.74 million → forecast year: USD 115.93 million)
- 2.1.2 Volume & Revenue – Global Totals
- 2.1.3 Key Market Highlights – Top Five Facts
- 2.2 Australia Green Tea Extract Market Segmentation Snapshot
- 2.2.1 Market Split by Region – 2024 vs.
- 2.3 Competitive Snapshot
- 2.3.1 Top 10 Players by Revenue Share – 2024
- 2.3.2 Top 10 Players by Volume Share – 2024
- 2.3.3 Recent Strategic Developments (18-Month Summary)
- 2.4 Key Investment Highlights & Strategic Conclusions
Chapter 3. Australia Green Tea Extract Market Dynamics & Industry Analysis
- 3.1 Market Overview & Context
- 3.1.1 Australia Green Tea Extract Market Position in the Broader Automotive Value Chain
- 3.1.2 OEM vs. Replacement Market Dynamics
- 3.1.3 Market Maturity & Development Stage by Region
- 3.2 Australia Green Tea Extract Market Drivers
- 3.3 Australia Green Tea Extract Market Restraints & Challenges
- 3.4 Australia Green Tea Extract Market Opportunities
- 3.5 Porter's Five Forces Analysis
- 3.5.1 Threat of New Entrants
- 3.5.2 Bargaining Power of Suppliers
- 3.5.3 Bargaining Power of Buyers
- 3.5.4 Threat of Substitutes
- 3.5.5 Competitive Rivalry – Intensity Assessment
- 3.6 Australia Green Tea Extract Value Chain Analysis
- 3.6.1 Upstream – Raw Material/Input Suppliers
- 3.6.1.1 Raw Material/Input 1
- 3.6.1.2 Raw Material/Input 2
- 3.6.1.3 Raw Material/Input 3
- 3.6.2 Midstream – Production/Manufacturing/Service Delivery
- 3.6.2.1 Production/Process Overview
- 3.6.2.2 Key Facility Locations & Capacity by Manufacturer
- 3.6.3 Downstream – Distribution & End Consumer
- 3.6.3.1 Primary Channel – B2B/OEM
- 3.6.3.2 Secondary Channels – Dealer, Retail, Online, Direct
- 3.6.4 Value Chain Profitability Analysis
- 3.6.1 Upstream – Raw Material/Input Suppliers
- 3.7 PESTEL Analysis
- 3.7.1 Political Factors
- 3.7.2 Economic Factors
- 3.7.3 Social Factors
- 3.7.4 Technological Factors
- 3.7.5 Environmental Factors
- 3.7.6 Legal Factors
- 3.8 Australia Green Tea Extract Supply Chain Analysis
- 3.8.1 Raw Material/Input Supply Risk Assessment
- 3.8.2 Manufacturing Concentration Risk (Geographic Exposure)
- 3.8.3 Trade Disruption Impact Analysis
- 3.9 Regulatory & Policy Landscape
Note: The regulatory and policy landscape section covers regulations based on their applicability to the market, Australia Green Tea Extract category, geography, and scope of the study. Only regulatory frameworks with a material impact on operations, compliance, trade, sustainability, or market access are analyzed in detail.
Chapter 4. Key Investment Pockets & Opportunity Analysis
- 4.1 Australia Green Tea Extract Market Attractiveness Analysis
- 4.1.1 By Region – Investment Attractiveness Matrix (Volume × CAGR)
- 4.2 Absolute Revenue Growth Opportunity
- 4.2.1 By Region – Absolute USD Growth Through the forecast period
- 4.3 Incremental Volume Opportunity
- 4.3.1 By Region – Incremental Volume Through the forecast period
- 4.3.2 Segment – Incremental Volume
- 4.4 Emerging Submarket Opportunity Deep Dive (Subject to Applicability)
- 4.5 Emerging Market Opportunity Scorecards
- 4.5.1 United States
- 4.5.2 Europe
- 4.5.3 Asia
- 4.5.4 Middle East & Africa
Note: Emerging Market Opportunity Scorecards will be included based on relevance and strategic importance. Regions listed are indicative and may vary depending on data availability and market dynamics.
Chapter 5. Australia Green Tea Extract Import-Export Analysis & Trade Flows
- 5.1 Global Trade Overview
- 5.1.1 Global Export Value by Country (2024)
- 5.1.2 Global Export Volume by Country (2024)
- 5.1.3 Global Import Value by Country (2024)
- 5.1.4 Global Import Volume by Country (2024)
- 5.1.5 Net Trade Balance by Country (2024)
- 5.2 Export Analysis – Segment
- 5.2.1 Type 1 (HS Code)
- 5.2.2 Type 2 (HS Code)
- 5.2.3 Type 3 (HS Code)
- 5.2.4 Type 4 (HS Code)
- 5.2.5 Type 5 (HS Code)
- 5.3 Import Analysis – Segment
- 5.3.1 Type 1 (HS Code)
- 5.3.2 Type 2 (HS Code)
- 5.3.3 Type 3 (HS Code)
- 5.3.4 Type 4 (HS Code)
- 5.3.5 Type 5 (HS Code)
- 5.4 Average Unit Trade Prices
- 5.4.1 Average Export Price – Segment & Country
- 5.4.2 Average Import Price – Segment & Source Country
- 5.4.3 Price Trends (2024)
- 5.5 Key Trade Route Analysis
- 5.5.1 Trade Route 1
- 5.5.2 Trade Route 2
- 5.5.3 Trade Route 3
- 5.5.4 Trade Route 4
- 5.5.5 Trade Route 5
- 5.6 Trade Policy Impact Assessment
- 5.6.1 US Anti-Dumping & Section 301 Tariffs
- 5.6.2 EU Customs Union Impact
- 5.6.3 Major Free Trade Agreements
- 5.6.4 USMCA Rules of Origin
Note: Trade policy analysis will be included only where relevant to the Australia Green Tea Extract market.
Chapter 6. Competitive Landscape & Company Benchmarking
- 6.1 Australia Green Tea Extract Market Concentration & Structure
- 6.1.1 Herfindahl-Hirschman Index (HHI) – vs. 2024
- 6.1.2 Tier 1, Tier 2 & Tier 3 Market Structure
- 6.1.3 Global, Regional & Local Player Dynamics
- 6.2 Australia Green Tea Extract Market Share Analysis – 2024
- 6.2.1 Global Revenue Share by Company
- 6.2.2 Global Volume Share by Company
- 6.2.3 Regional Revenue Share
- 6.2.4 Market Share Evolution ( vs. 2024)
- 6.2.5 OEM Segment Share by Company
- 6.2.6 Replacement Segment Share by Company
- 6.3 Production/Delivery Capacity & Facility Analysis
- 6.3.1 Global Installed Capacity
- 6.3.2 Capacity Utilization Rates
- 6.3.3 Production/Output Volume
- 6.3.4 Facility Locations & Capacity Map
- 6.3.5 Planned Capacity Additions
- 6.4 Australia Green Tea Extract Competitive Benchmarking Matrix
- 6.4.1 Revenue, Volume, CAGR & Profitability Comparison
- 6.4.2 Channel Revenue Mix
- 6.4.3 Geographic Revenue Exposure
- 6.4.4 R&D Intensity
- 6.4.5 Sustainability Maturity
- 6.5 Strategic Developments in Australia Green Tea Extract (Last 24 Months)
- 6.5.1 Mergers, Acquisitions & Divestments
- 6.5.2 New Australia Green Tea Extract Launches
- 6.5.3 Facility Expansions
- 6.5.4 Strategic Alliances, Joint Ventures & Partnerships
- 6.5.5 Distribution Expansion & Market Entry
- 6.5.6 Sustainability & ESG Initiatives
- 6.6 Competitive Strategy Mapping
- 6.6.1 Leader, Challenger, Follower & Niche Classification
- 6.6.2 Pricing Strategy Comparison
- 6.6.3 Channel Strategy Matrix
Note: Strategic developments are included based on their materiality and the availability of reliable information.
Chapter 7. Global Australia Green Tea Extract Market – By Distribution Channel
- 7.1 Segment Overview
- 7.1.1 Volume & Revenue Split by Channel (2024 & )
- 7.1.2 Channel Mix Evolution (the forecast period)
Chapter 8. Regional Market Analysis – Global Overview
- 8.1 Global Regional Overview
- 8.1.1 Regional Volume Share
- 8.1.2 Regional Revenue Share
- 8.1.3 Regional Volume by Region
- 8.1.4 Regional Revenue by Region
- 8.1.5 Regional Forecast Through the forecast period
- 8.2 Cross-Regional Segment Analysis
- 8.2.1 By Distribution Channel
- 8.2.2 By Brand/Price Tier
Chapter 9. North America Australia Green Tea Extract Market
- 9.1 United States
- 9.2 Canada
- 9.3 Mexico
Chapter 10. Europe Australia Green Tea Extract Market
- 10.1 Germany
- 10.2 France
- 10.3 Italy
- 10.4 United Kingdom
- 10.5 Spain
- 10.6 Poland
- 10.7 Russia
- 10.8 Netherlands
- 10.9 Belgium
- 10.10 Sweden
- 10.11 Denmark
- 10.12 Norway
- 10.13 Rest of Europe
Chapter 11. Asia Pacific Australia Green Tea Extract Market
- 11.1 China
- 11.2 India
- 11.3 Japan
- 11.4 South Korea
- 11.5 Thailand
- 11.6 Indonesia
- 11.7 Vietnam
- 11.8 Malaysia
- 11.9 Australia
- 11.10 Rest of Asia Pacific
Chapter 12. Latin America Australia Green Tea Extract Market
- 12.1 Brazil
- 12.2 Argentina
- 12.3 Colombia
- 12.4 Chile
- 12.5 Rest of Latin America
Chapter 13. Middle East Australia Green Tea Extract Market
- 13.1 Saudi Arabia
- 13.2 United Arab Emirates
- 13.3 Turkey
- 13.4 Israel
- 13.5 Iran
- 13.6 Rest of the Middle East
Chapter 14. Africa Australia Green Tea Extract Market
- 14.1 South Africa
- 14.2 Egypt
- 14.3 Nigeria
- 14.4 Morocco
- 14.5 Rest of Africa
Chapter 15. Australia Green Tea Extract Company Profiles
- 15.1 [Company 01]
- 15.1.1 Company Overview
- 15.1.2 Key Management Personnel
- 15.1.3 Products & Services Portfolio
- 15.1.4 Financial Performance
- 15.1.5 Key Market Focus & Geographic Presence
- 15.1.6 Recent Developments & Strategic Initiatives
Note: The company profile list is preliminary and may change based on research findings, market developments, data availability, and client requirements.
Chapter 16. Appendices
- Appendix A – List of Abbreviations & Acronyms
- Appendix B – Industry Classification Code Reference – Full Series
- Appendix C – Production & Capacity Data Tables
- Appendix D – End-Use & Demand Base Tables
- Appendix E – Consumption & Replacement Rate Assumptions
- Appendix F – ASP Reference Tables
- Appendix G – Manufacturing & Facility Database
- Appendix H – Import-Export Data Tables
- Appendix I – Regulatory Summary Tables
- Appendix J – Primary Research Participant List (Anonymized)
- Appendix K – Primary Research Questionnaire Framework
- Appendix L – Data Sources & Bibliography
- Appendix M – Market Size Divergence & Source Comparison
Chapter 17. Research Methodology
- 17.1 Research Framework & Philosophy
- 17.2 Secondary Research – Sources, Hierarchy & Data Extraction
- 17.3 Data Modeling – Bottom-Up & Top-Down Market Sizing
- 17.4 Primary Research – Stakeholder Framework, LOI & Sample Sizes
- 17.5 Forecast Methodology – Regression, Scenario & Sensitivity Analysis
- 17.6 Quality Control – Four-Layer Validation Framework
- 17.7 Limitations & Standard Assumptions
- 17.8 Disclaimer
