
Executive Summary & Core Metrics
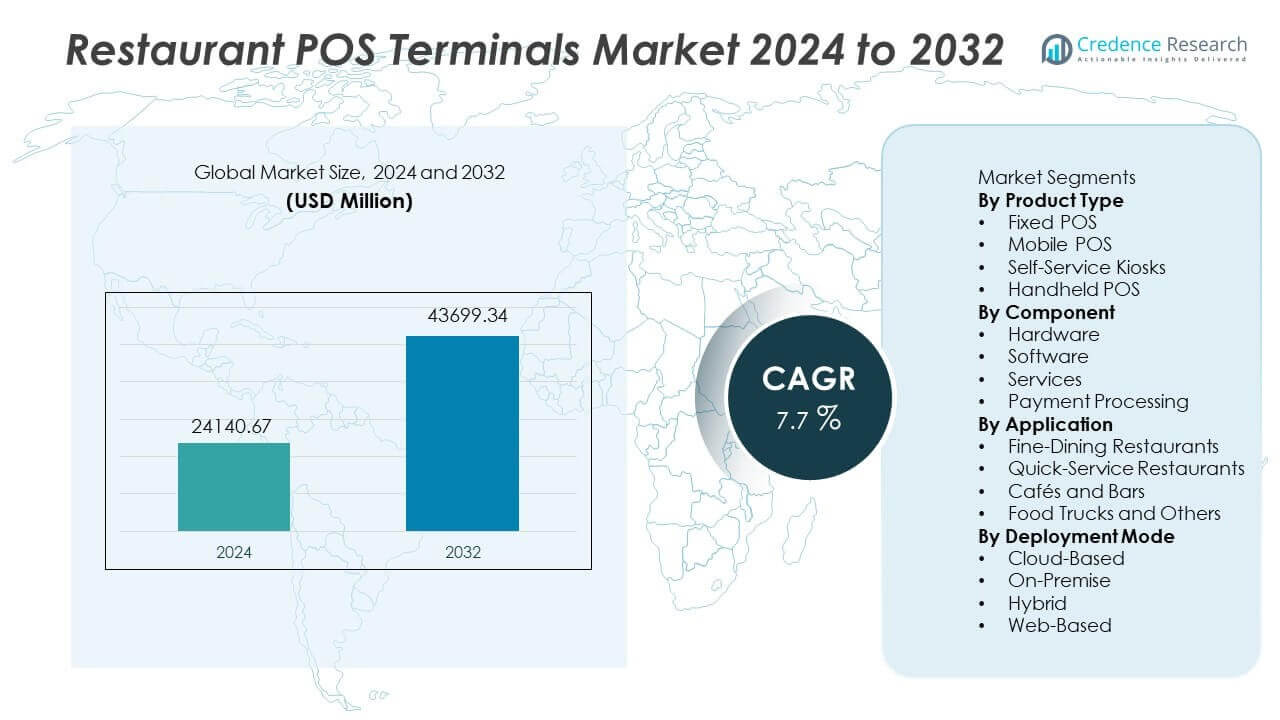
The global restaurant POS terminals market was valued at USD 24,140.67 million in 2024 and is projected to reach USD 43,699.34 million by 2032, expanding at a compound annual growth rate (CAGR) of 7.7% during the forecast period, according to Credence Research. This growth reflects rising digital ordering, wider cashless payment adoption, cloud POS migration, mobile wallet usage and stronger demand for integrated restaurant management platforms across quick-service, fine-dining, café, bar, food truck and chain restaurant formats.
| REPORT ATTRIBUTE | DETAILS |
|---|---|
| Historical Period | 2020-2023 |
| Base Year | 2024 |
| Forecast Period | 2025-2032 |
| Restaurant POS Terminals Market Size 2024 | USD 24,140.67 million |
| Restaurant POS Terminals Market, CAGR | 7.7% |
| Restaurant POS Terminals Market Size 2032 | USD 43,699.34 million |
The global restaurant POS terminals market is characterized by the presence of cloud POS providers, payment technology companies, restaurant software vendors and hardware terminal manufacturers competing on transaction speed, payment security, kitchen integration, menu management, loyalty tools, analytics and delivery platform connectivity. Leading players focus on fixed POS, mobile POS, self-service kiosks, handheld POS, hardware, software, services and payment processing solutions. Strategic priorities across the sector include cloud-based deployment, subscription models, mobile ordering, self-ordering kiosks, real-time reporting, AI-based insights, contactless payments and integrated restaurant ecosystem management.
Strategic Market Insights
- Market growth is primarily driven by expanding digital ordering, cashless payments, mobile wallets, QR-code payments and demand for integrated billing, payment, kitchen and marketing modules.
- Dominant industry trends highlight mobile POS, self-ordering kiosks, cloud systems, real-time menu management, delivery platform integration and analytics-driven restaurant operations.
- The competitive landscape is defined by vendors competing through platform integration, mobile ordering capability, payment security, loyalty tools and subscription-based models targeting small and mid-size restaurants.
- According to Credence Research regional mapping, North America represents the largest market, accounting for a definitive 38% share due to strong contactless adoption, mature restaurant networks and high cloud POS penetration.
Market Segmentation Analysis
By Product Type
- Fixed POS
- Mobile POS
- Self-Service Kiosks
- Handheld POS
Fixed POS leads the restaurant POS terminals market with a 45% share, supported by reliable integration with billing workflows, kitchen operations, payment terminals and counter-based ordering systems. Fixed POS terminals remain widely used in quick-service chains, fine-dining restaurants and multi-location foodservice networks where dependable transaction processing and centralized order management are essential. Their durability and compatibility with printers, scanners, display units and kitchen systems continue to support adoption.
Mobile POS captures 25% share as restaurants adopt flexible ordering and faster payment tools across dining areas, outdoor seating and high-traffic service formats. Self-service kiosks account for 15% share, supported by rising self-ordering demand, reduced queue times and labor efficiency needs. Handheld POS also holds 15% share due to growing use in table-side ordering, contactless service and peak-hour restaurant operations.
Toast added many new restaurant locations in 2023 and integrated third-party modules across payments and kitchen display systems to strengthen restaurant operations.
By Component
- Hardware
- Software
- Services
- Payment Processing
Hardware leads the component segment with 50% share, driven by required investment in terminals, scanners, display units, receipt printers, card readers and kitchen display systems. Restaurants rely on physical POS infrastructure to process payments, route orders, print receipts and connect front-of-house with back-of-house workflows. Hardware demand remains especially strong among chain restaurants, quick-service outlets and high-volume dining formats.
Software holds 25% share as restaurants shift toward cloud-based platforms for analytics, menu updates, centralized reporting, table management and customer engagement. Services represent 15% share because operators require installation, technical support, staff training, lifecycle management and system upgrades. Payment processing accounts for 10% share, supported by growth in card, contactless and digital wallet transactions across both chain and independent restaurants.
NCR offers POS terminals that support integrated EMV technology and enable encryption and tokenization across card transactions, helping merchants meet standards such as PCI DSS.
By Application
- Fine-Dining Restaurants
- Quick-Service Restaurants
- Cafés and Bars
- Food Trucks and Others
Quick-service restaurants dominate the application segment with a 40% share, supported by digital ordering, fast checkout, integrated kitchen systems and strong demand for high-throughput transaction processing. These restaurants require POS terminals that can handle drive-thru orders, delivery orders, loyalty programs, multiple payment types and real-time menu adjustments. Growing fast-casual and franchise expansion further strengthens the segment.
Fine-dining restaurants hold 25% share as premium operators adopt feature-rich billing, reservations, customer relationship management and table-side service tools to improve guest handling. Cafés and bars command 20% share, supported by expanding beverage culture, simplified billing needs and high-volume small-ticket transactions. Food trucks and others represent 15% share, supported by mobile formats and steady adoption of cloud and tablet-based POS platforms.
By Deployment Mode
- Cloud-Based
- On-Premise
- Hybrid
- Web-Based
Cloud-based deployment is gaining strong adoption as restaurants seek flexible systems with real-time reporting, remote menu updates and lower upfront infrastructure requirements. Cloud POS enables centralized control across multi-location restaurant chains and supports faster software upgrades without complex on-site maintenance. It also helps restaurants manage online orders, inventory, employee scheduling and delivery integrations from a unified platform.
On-premise deployment remains relevant among restaurants that prefer in-house data control, stable local processing and legacy system continuity. Hybrid and web-based models also support operators that need a combination of local reliability and cloud-connected features. As restaurant operations become more digital and multi-channel, cloud-based and hybrid models are expected to remain key deployment directions.
Key Market Dynamics
Primary Market Drivers
Rapid Expansion of Digital Ordering and Cashless Payments
Digital ordering is expanding as customers increasingly prefer contactless transactions across restaurants of every size. Restaurants deploy POS systems that accept mobile wallets, online orders, QR codes and card payments to improve checkout speed and reduce manual errors during peak hours. Chain networks invest in multi-location payment integration across delivery, dine-in and drive-thru units. Cloud-based billing enables fast menu updates and instant order routing to kitchens. Square facilitated substantial gross payment volume across many sales transactions in 2023 and supports payment capabilities across millions of merchant accounts worldwide.
Increasing Demand for Integrated Restaurant Management Tools
Restaurants increasingly seek integrated POS platforms that combine billing, inventory, ordering, table management, workforce management and analytics in one system. Unified dashboards help operators track revenue, menu performance, staff productivity and customer engagement. Integration with kitchen display systems reduces cooking delays and improves order accuracy. Loyalty and CRM tools support targeted offers and repeat visits. Oracle Hospitality Micros supports restaurant and hotel sites globally through integrated kitchen display modules and foodservice transaction processing capabilities.
Growing Adoption of Cloud-Based POS Solutions
Cloud POS supports real-time reporting, remote menu control and centralized updates across locations. Restaurants use cloud tools to manage online orders, inventory, employee scheduling and menu launches with reduced infrastructure complexity. Cloud deployment lowers upfront hardware burden and accelerates setup for new outlets. Chain brands adopt cloud systems to manage multi-location compliance and promotions. These benefits drive adoption among small, medium and enterprise restaurants seeking flexible deployment.
Key Trends & Structural Opportunities
Shift Toward Table-Side and Self-Ordering Technologies
Restaurant operators are deploying mobile POS and self-ordering screens to reduce wait times and improve order accuracy. Table-side billing supports faster checkout and helps staff manage busy dining periods. Self-service kiosks allow customers to personalize orders, review menu details and reduce queue pressure. Mobile POS helps staff update orders without returning to fixed counters. TouchBistro enables table-side ordering through iPad POS features that send orders directly to the kitchen and improve staff efficiency and guest experience.
Integration with Advanced Analytics and AI-Based Insights
Advanced analytics help restaurants understand demand patterns, peak hours, menu performance and customer preferences. AI tools support pricing decisions, ingredient planning, inventory management and personalized promotions. Operators use predictive analytics to reduce food waste and improve staff planning. Real-time dashboards help managers track kitchen delays and sales performance. Lightspeed processes transactions through analytics dashboards across restaurant sites, including real-time menu insights and demand forecasting.
Expansion of Delivery Platform and Loyalty Ecosystem Integration
POS terminals are increasingly integrated with delivery aggregators, loyalty programs and customer engagement platforms. This allows restaurants to manage dine-in, takeaway, delivery and drive-thru orders through a unified system. Integrated loyalty tools help operators create targeted offers, track customer behavior and improve retention. As omnichannel foodservice grows, POS vendors that provide seamless ecosystem connectivity are positioned to gain stronger adoption among chain and independent restaurants.
Industry Challenges
High Installation and System Upgrade Costs
Complete POS deployment requires investment in terminals, scanners, printers, payment devices, networking systems and staff training. Smaller restaurants may delay upgrades due to capital limits and uncertainty around return on investment. Hardware replacement cycles increase total cost over time, while cloud migration adds subscription fees and connectivity requirements. High-end POS systems remain more concentrated among medium and large chain networks with established technology budgets. Upfront cost continues to challenge independent operators in price-sensitive markets.
Data Security and Payment Compliance Risks
POS platforms handle payment cards, customer profiles, transaction histories and digital ordering data across channels. Security failures can expose restaurants to fraud, penalties and reputational damage. Restaurants must comply with payment card rules, data protection standards and regional privacy regulations. Cloud systems require encryption, secure gateways and regular software patching. Operators without dedicated IT teams often struggle to manage multi-layer security, making compliance and cyber risk major barriers to adoption.
Detailed Regional Analysis
| Region | Market Share (%) | Strategic Regional Catalysts & Insights |
| North America | 38.0% | Global leader. Supported by strong digital payment usage, mature restaurant networks, contactless adoption, cloud POS growth and quick-service expansion. |
| Europe | 29.0% | Mature regional market. Driven by restaurant digitalization, privacy compliance, mobile POS adoption, kiosks and digital wallet use across major foodservice economies. |
| Asia Pacific | 24.0% | High-growth regional market. Supported by urbanization, mobile wallet penetration, cloud POS adoption, chain expansion and high online ordering volumes. |
| Latin America | 6.0% | Developing regional market. Driven by mobile payments, contactless cards, quick-service expansion and cloud-based POS adoption in major cities. |
| Middle East & Africa | 3.0% | Emerging territory. Supported by hotel dining, franchise restaurant growth, tourism, contactless payments and government digitalization initiatives. |
North America leads the global restaurant POS terminals market with a 38% share, according to Credence Research. The region benefits from strong digital payment usage, rapid cloud POS adoption and mature restaurant networks across the United States and Canada. Chain restaurants invest in mobile ordering, drive-thru integration, loyalty programs and real-time analytics. Contactless payments continue to grow through mobile wallets and NFC cards in urban areas. Data security requirements also encourage adoption of certified payment platforms. Continuous innovation keeps the region ahead in POS technology development.
Europe accounts for 29% share, supported by strong restaurant digitalization across leading foodservice destinations. Cloud transformation is accelerating in Western Europe as operators integrate ordering, billing and analytics under unified platforms. Quick-service chains deploy kiosks to manage tourist volumes and peak-season demand. Restaurants emphasize data security and privacy due to strict regulatory frameworks. Mobile POS supports table-side ordering in fine-dining, café and bistro formats, while QR payments and digital wallets continue expanding.
Asia Pacific holds 24% share and shows strong growth as rapid urbanization and mobile usage push digital transactions. Chain expansion continues across fast-casual dining, food courts, mall restaurants and delivery-led formats. Cloud POS adoption rises due to lower upfront cost models and subscription billing. Operators integrate POS with delivery apps to manage high online ordering volumes. Mobile wallets remain popular in China, India, Singapore and South Korea. Rising restaurant investment and consumer demand for cashless service support regional expansion.
Latin America holds 6% share, supported by rising acceptance of mobile payments and contactless cards. Restaurant chains upgrade POS platforms to manage multi-site billing and faster checkout. Cloud-based systems gain adoption in quick-service outlets due to limited capital budgets and flexible subscription models. Digital wallets expand across Brazil, Mexico and Chile, helping restaurants handle peak ordering volumes. Cost-efficient payment processing remains important due to margin pressure across local operators.
Competitive Landscape & Recent Developments
The restaurant POS terminals market includes major players such as Toast Inc., Square Inc., NCR Corporation, Oracle Corporation, Lightspeed POS, Revel Systems, TouchBistro, Shift4 Payments, PAR Technology Corporation and Panasonic Corporation. These companies compete through cloud deployment, mobile POS integration, advanced payment processing, delivery platform connectivity and restaurant-specific software ecosystems.
Vendors strengthen portfolios through analytics, loyalty platforms, kitchen display systems and integration with delivery services. Partnerships with payment service providers help expand contactless payment adoption and secure transaction processing. Competition is increasing among mobile POS innovators targeting small and mid-size restaurants seeking low-cost deployment. Established vendors emphasize enterprise-grade systems, while emerging players focus on flexible subscription models and vertical-specific POS features for quick-service, fine-dining and café formats.
Recent Industry Developments (2023–2025)
- In October 2025, Toast Inc. expanded Toast IQ into a conversational AI assistant. The update also included a Coca-Cola partnership for menu optimization tools.
- In January 2024, ParTech Inc. launched PAR Wave, an all-in-one touch panel designed as a hospitality hardware component. PAR Wave combines performance, security, functionality and updated design for restaurant industry needs.
- In August 2023, Snack POS partnered with PAX to launch EMV-enabled terminals for restaurants, improving payment security and convenience for customers and businesses.

Request a Free Sample
Fill in your details and we'll send you a free sample report.
- Sample data tables & charts
- Research methodology
Need a Custom Version of This Report?
Tailor the scope, geography, or segments to your exact requirements.
- Custom geography or segment scope
- Direct access to our analyst team
Frequently Asked Questions
What is the current and projected size of the global restaurant POS terminals market?
What is the projected growth rate of the restaurant POS terminals industry over the forecast period?
Which product type holds the maximum market share within the restaurant POS terminals industry?
Which component segment dominates the restaurant POS terminals market?
Which application segment leads the restaurant POS terminals market?
Which region commands the highest market share in the global restaurant POS terminals space?
Table of Content
Chapter 1 Market Segmentation
- 1.1 Segmentation Framework
- 1.1.1 Product and Service Classification
- 1.1.2 Application and End-Use Classification
- 1.1.3 Technology and Solution Classification
- 1.1.4 Customer and Distribution Channel Classification
- 1.1.5 Geographic Segmentation
- 1.1.6 Market Segment Definitions and Boundaries
Chapter 2 Introduction
- 2.1 Report Objectives and Scope
- 2.2 Product Definition and Industry Terminology
- 2.3 Market Inclusions and Exclusions
- 2.4 Research Process
- 2.4.1 Primary Research and Expert Interviews
- 2.4.2 Secondary Research and Source Review
- 2.4.3 Top-Down and Bottom-Up Estimation
- 2.4.4 Data Triangulation and Verification
- 2.5 Market Size Measurement Basis
- 2.5.1 2024: USD 24,140.67 million → 2032: USD 43,699.34 million
- 2.6 Historical and Forecast Reference Periods
- 2.6.1 Base Year: 2024
- 2.6.2 Forecast Period: 2024-2032
- 2.7 Research Assumptions and Limitations
Chapter 3 Executive Summary
- 3.1 Market Snapshot and Key Findings
- 3.2 Base-Year Market Size, 2024
- 3.3 Forecast Market Size, 2032
- 3.4 Revenue and Volume Growth Outlook
- 3.5 Key Demand and Supply Indicators
- 3.6 Leading Market Segments
- 3.7 Fastest-Growing Market Opportunities
- 3.8 Regional Performance Highlights
- 3.9 Technology and Industry Transformation
- 3.10 Competitive Landscape Summary
- 3.11 Analyst View and Strategic Implications
Chapter 4 Global Restaurant POS Terminals Market Trends and Developments
- 4.1 Historical Industry Development
- 4.2 Recent Market Trends and Developments
- 4.3 Demand and Customer Behavior Trends
- 4.4 Technology and Product Innovation
- 4.5 Artificial Intelligence, Automation and Digitalization
- 4.6 Local Manufacturing and Supply Chain Realignment
- 4.7 Industry Partnerships, Mergers and Acquisitions
- 4.8 Sustainability and Circular Economy Developments
- 4.9 Government and Private Sector Investment Trends
- 4.10 Emerging Business Models and Commercialization
- 4.11 Industry Developments and Announcements
Chapter 5 Global Restaurant POS Terminals Market Production, Supply and Demand Analysis
- 5.1 Demand Trend and Consumption Analysis
- 5.2 Demand Forecast, 2024-2032
- 5.3 Production and Output Trend
- 5.4 Production and Output Forecast, 2024-2032
- 5.5 Installed Capacity and Capacity Utilization
- 5.6 Company-Wise Production Plants and Statistics
- 5.6.1 Installed Production Capacity
- 5.6.2 Actual Production
- 5.6.3 Planned Capacity and Expansion Targets
- 5.7 Supply Chain Structure and Procurement Trends
- 5.8 Supply-Demand Gap and Bottlenecks
- 5.9 Import Dependence and Sourcing Structure
- 5.10 Contract Manufacturing and Outsourcing
- 5.11 Regional Supply and Demand Concentration
Chapter 6 Global Restaurant POS Terminals Market Pricing Analysis
- 6.1 Pricing Structure and Measurement
- 6.2 Historical Pricing Trends
- 6.3 Pricing Outlook, 2024-2032
- 6.4 Average Selling Price and Unit Economics
- 6.5 Pricing by Product and Market Segment
- 6.6 Geographic Pricing Differences
- 6.7 Key Input, Energy, Labor and Logistics Costs
- 6.8 Contract Pricing and Purchasing Models
- 6.9 Pricing Sensitivity and Competitive Positioning
- 6.10 Price, Margin and Profitability Implications
Chapter 7 Global Restaurant POS Terminals Market Dynamics
- 7.1 Market Growth Drivers
- 7.1.1 Demand-Side Drivers
- 7.1.2 Technology and Innovation Drivers
- 7.1.3 Infrastructure and Investment Drivers
- 7.1.4 Regulatory and Policy Drivers
- 7.2 Market Restraints
- 7.2.1 Cost and Affordability Constraints
- 7.2.2 Technology and Adoption Barriers
- 7.2.3 Supply Chain and Operational Constraints
- 7.3 Market Challenges
- 7.3.1 Competitive Pressure and Margin Erosion
- 7.3.2 Skills, Infrastructure and Implementation Gaps
- 7.4 Emerging Market Opportunities
- 7.5 Market Dynamics Impact and Time-Horizon Assessment
Chapter 8 Global Restaurant POS Terminals Value Chain Analysis
- 8.1 Industry Value Chain Overview
- 8.2 Upstream Suppliers and Critical Inputs
- 8.3 Technology and Component Providers
- 8.4 Manufacturing or Service Delivery
- 8.5 Distribution, Channel Partners and Integrators
- 8.6 Downstream Applications and End Users
- 8.7 Value Addition and Profit Pools
- 8.8 Vertical Integration and Outsourcing
- 8.9 Supplier Concentration and Risk
- 8.10 Supply Chain Localization and Resilience
Chapter 9 Global Restaurant POS Terminals Market Regulations and Policies
- 9.1 Relevant Laws, Standards and Compliance Frameworks
- 9.2 Product, Service, Safety and Quality Requirements
- 9.3 Government Policies, Incentives and Subsidies
- 9.4 Imports, Exports and Trade Barriers
- 9.5 Public Procurement and Local Content Requirements
- 9.6 Environmental and Sustainability Compliance
- 9.7 Upcoming Policy Changes and Market Implications
Chapter 10 Global Restaurant POS Terminals Market Hotspots and Opportunities
- 10.1 Market Opportunity Mapping and Growth Hotspots
- 10.2 High-Growth Applications and Customer Groups
- 10.3 Underserved Markets and White-Space Opportunities
- 10.4 Emerging Technology and Product Opportunities
- 10.5 New Capacity and Investment Hotspots
- 10.6 Market Entry and Expansion Opportunities
- 10.7 Distribution and Partnership Opportunities
- 10.8 Near-Term and Long-Term Commercial Potential
- 10.9 Opportunity Attractiveness and Execution Risks
Chapter 11 Global Restaurant POS Terminals Market Outlook, 2024-2032
- 11.1 Market Size and Analysis
- 11.1.1 Revenue (Market Measurement: 2024: USD 24,140.67 million → 2032: USD 43,699.34 million)
- 11.1.2 Market Volume and Quantity Sold
- 11.1.3 Historical Market Size
- 11.1.4 Base-Year Market Size, 2024
- 11.2 Market Forecast, 2024-2032
- 11.2.1 Revenue Forecast to 2032
- 11.2.2 Volume Forecast to 2032
- 11.2.3 CAGR and Year-on-Year Growth
- 11.2.4 Incremental Revenue Opportunity
- 11.3 Forecast Assumptions and Scenario Analysis
- 11.3.1 Base-Case Forecast
- 11.3.2 Optimistic and Conservative Scenarios
- 11.3.3 Technology, Pricing and Policy Sensitivities
- 11.4 Market Attractiveness and Growth Outlook
Chapter 12 Global Restaurant POS Terminals Market Segmentation and Outlook
- 12.1 Segmentation Summary and Market Shares, 2024
- 12.2 Largest and Fastest-Growing Segments
- 12.3 Segment Growth Comparison
- 12.4 Segment Attractiveness and Priority Matrix
Chapter 13 Global Restaurant POS Terminals Geographic Market Outlook, 2024-2032
- 13.1 Regional Market Size and Share, 2024
- 13.2 Regional Market Forecast, 2024-2032
- 13.3 Regional Pricing, Production and Demand Differences
- 13.4 North America
- 13.4.1 United States
- 13.4.2 Canada
- 13.4.3 Mexico
- 13.5 Europe
- 13.5.1 Germany
- 13.5.2 France
- 13.5.3 Italy
- 13.5.4 United Kingdom
- 13.5.5 Spain
- 13.5.6 Poland
- 13.5.7 Russia
- 13.5.8 Netherlands
- 13.5.9 Belgium
- 13.5.10 Sweden
- 13.5.11 Denmark
- 13.5.12 Norway
- 13.5.13 Rest of Europe
- 13.6 Asia Pacific
- 13.6.1 China
- 13.6.2 India
- 13.6.3 Japan
- 13.6.4 South Korea
- 13.6.5 Thailand
- 13.6.6 Indonesia
- 13.6.7 Vietnam
- 13.6.8 Malaysia
- 13.6.9 Australia
- 13.6.10 Rest of Asia Pacific
- 13.7 Latin America
- 13.7.1 Brazil
- 13.7.2 Argentina
- 13.7.3 Colombia
- 13.7.4 Chile
- 13.7.5 Rest of Latin America
- 13.8 Middle East
- 13.8.1 Saudi Arabia
- 13.8.2 United Arab Emirates
- 13.8.3 Turkey
- 13.8.4 Israel
- 13.8.5 Iran
- 13.8.6 Rest of the Middle East
- 13.9 Africa
- 13.9.1 South Africa
- 13.9.2 Egypt
- 13.9.3 Nigeria
- 13.9.4 Morocco
- 13.9.5 Rest of Africa
- 13.10 Regional Investment, Policy and Supply Chain Differences
- 13.11 Regional Competitive Landscape
- 13.12 Geographic Growth Hotspots
Chapter 14 Global Restaurant POS Terminals Technology, Innovation and Sustainability Outlook
- 14.1 Technology Landscape and Maturity
- 14.2 Product, Process and Service Innovation
- 14.3 AI, Automation and Digital Tools in the Industry
- 14.4 Technology Adoption and Performance Benchmarking
- 14.5 Innovation Pipeline and R&D Investment
- 14.6 Patent and Intellectual Property Trends
- 14.7 Energy Efficiency and Resource Management
- 14.8 Sustainability, Recycling and Circularity
- 14.9 Technology Roadmap, 2024-2032
- 14.10 Risks of Obsolescence and Technology Substitution
Chapter 15 Global Restaurant POS Terminals Market Key Strategic Imperatives
- 15.1 Growth and Market Entry Priorities
- 15.2 High-Return Products and Segments
- 15.3 Pricing, Profitability and Cost Optimization
- 15.4 Technology Investment and Product Differentiation
- 15.5 Supply Chain Localization and Resilience
- 15.6 Distribution and Customer Acquisition
- 15.7 Partnership, Acquisition and Capacity Strategy
- 15.8 Regional Expansion Priorities
- 15.9 Short-, Medium- and Long-Term Actions
Chapter 16 Competition Outlook
- 16.1 Industry Competition Characteristics
- 16.2 Market Structure and Concentration
- 16.3 Market Share and Competitive Positioning, 2024
- 16.4 Company-Wise Revenue and Product Benchmarking
- 16.5 Production and Service Capacity Benchmarking
- 16.6 Technology, Pricing and Differentiation
- 16.7 Regional Footprint and Distribution Strength
- 16.8 Mergers, Acquisitions and Strategic Alliances
- 16.9 New Entrants and Competitive Threats
- 16.10 Porter's Five Forces and Industry Attractiveness
- 16.11 Competitive Outlook, 2024-2032
Chapter 17 Company Profiles
- 17.1 Company Coverage and Selection Criteria
- 17.2 Leading Market Participants – Standard Profile Structure
- 17.2.1 Business Description
- 17.2.2 Company Ownership and Geographic Presence
- 17.2.3 Product and Service Portfolio
- 17.2.4 Manufacturing and Operating Footprint
- 17.2.5 Production Capacity and Expansion Plans
- 17.2.6 Financial Performance and Investment
- 17.2.7 Market Share and Competitive Position
- 17.2.8 Technology and Innovation Capabilities
- 17.2.9 Strategic Alliances or Partnerships
- 17.2.10 Recent Developments
- 17.2.11 Growth Strategy and Outlook
- 17.3 Other Relevant Market Participants
Note: Every listed company is profiled on the structure shown under the first company. The company list is preliminary and may change based on research findings, market developments, data availability and client requirements.
Chapter 18 Disclaimer
- 18.1 Research and Forecast Disclaimer
- 18.2 Data Source and Estimation Limitations
Note: The depth of individual sections depends on data availability for this market. Volume, capacity, trade and other unit-based metrics are included where applicable.

