
Hand Sanitizer Dispenser Market Overview:
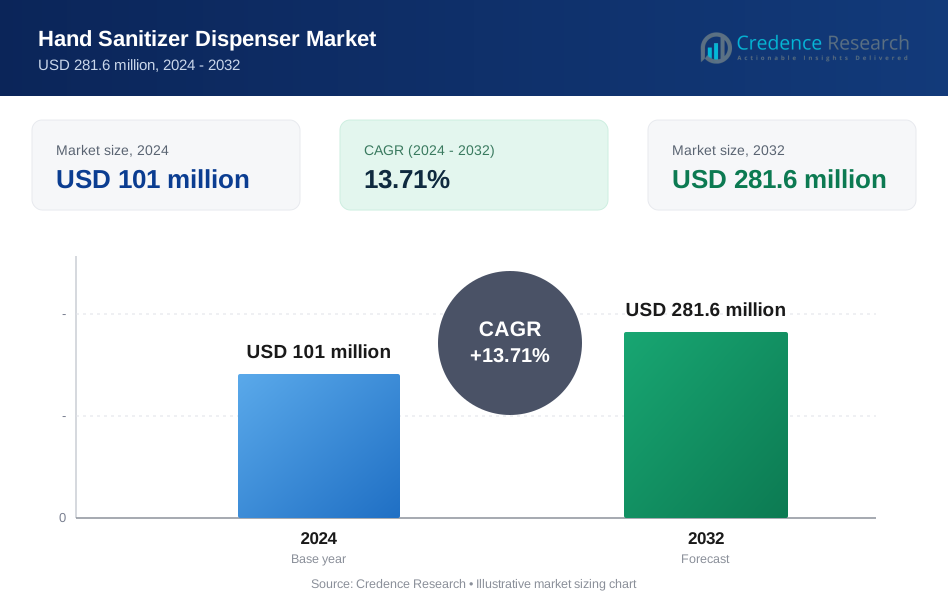
The hand sanitizer dispenser market was valued at USD 101 million in 2024 and is anticipated to reach USD 281.6 million by 2032, registering a CAGR of 13.71% during the forecast period. (Credence Research)
| REPORT ATTRIBUTE | DETAILS |
|---|---|
| Historical Period | 2020-2023 |
| Base Year | 2024 |
| Forecast Period | 2025-2032 |
| Hand Sanitizer Dispenser Market Size 2024 | USD 101 million |
| Hand Sanitizer Dispenser Market, CAGR | 13.71% |
| Hand Sanitizer Dispenser Market Size 2032 | USD 281.6 million |
The hand sanitizer dispenser market is led by established players including GOJO Industries, Inc., Kimberly-Clark Corporation, Ecolab Inc., 3M Company, Essity AB (Tork), SC Johnson Professional, Diversey Holdings, Ltd., Rubbermaid Commercial Products, Kutol Products Company, and Purell. These companies strengthen their market positions through touchless dispensing technology, durable designs, and strong institutional sales networks. North America leads the market with a 36% share, supported by strict hygiene standards across healthcare and commercial facilities. Europe follows with a 28% share, driven by regulatory compliance and public health policies. Asia Pacific holds a 24% share, reflecting rapid healthcare expansion, dense public infrastructure, and rising hygiene awareness across major economies.
Hand Sanitizer Dispenser Market Insights
- Rising focus on infection prevention drives demand, with healthcare facilities leading end users at a 46% share due to strict hygiene protocols.
- Market trends show strong adoption of touchless solutions, as automatic dispensers dominate product types with a 63% share for reduced cross-contamination.
- Competition remains moderate, with key players emphasizing sensor reliability, durability, and compliance, while price sensitivity and maintenance costs act as restraints.
- North America leads with a 36% share, followed by Europe at 28% and Asia Pacific at 24%, supported by healthcare expansion, public hygiene policies, and infrastructure growth.
Hand Sanitizer Dispenser Market Segmentation Analysis:
By Product Type
Automatic dispensers dominate the hand sanitizer dispenser market by product type with a 63% market share. This dominance is driven by strong demand for touchless hygiene solutions. Automatic dispensers reduce cross-contamination risks in high-traffic environments. Healthcare facilities and commercial buildings prefer sensor-based systems for improved infection control. Integration with smart building systems further supports adoption. Rising awareness of hygiene standards sustains demand beyond pandemic periods. Manual dispensers hold a 37% share, supported by lower cost and simple installation. These products remain popular in residential settings and small offices with budget constraints.
- For instance, GOJO Industries developed an automatic dispenser using an infrared sensor rated for over 500,000 activations per unit, supporting long-term use in clinical settings.
By Mounting Type
Wall-mounted dispensers lead the mounting type segment with a 54% market share. Space efficiency and ease of access drive widespread adoption. Hospitals and commercial spaces prefer wall-mounted units for organized hygiene stations. These dispensers support high usage frequency and easy refilling. Floor-standing dispensers account for a 28% share, driven by flexible placement in public venues. Countertop dispensers hold an 18% share, supported by use in homes, reception desks, and retail counters. Demand across mounting types reflects varied space and usage requirements.
- For instance, Tork designed wall-mounted dispensers with refill systems supporting up to 2,500 dispenses per cartridge, reducing maintenance frequency in hospitals.
By End User
Healthcare facilities dominate the end user segment with a 46% market share. Strict infection control protocols drive consistent dispenser installation. Hospitals rely on automatic systems for staff and patient safety. Commercial spaces hold a 29% share, supported by offices, malls, and transportation hubs. Educational institutions account for a 15% share due to hygiene policies in schools and universities. Residential users contribute the remaining demand, driven by hygiene awareness and compact dispenser designs. Sustained focus on public health supports long-term end user adoption.
Key Growth Drivers
Rising Emphasis on Infection Prevention and Hygiene Standards
Public and institutional focus on hygiene drives hand sanitizer dispenser demand. Healthcare facilities enforce strict infection control protocols. Touchless dispensing reduces cross-contamination risks. Commercial buildings adopt hygiene stations at entrances. Transportation hubs install dispensers to protect passengers. Governments promote public hygiene awareness programs. Workplaces integrate dispensers into safety policies. Retailers use dispensers to improve customer confidence. Continuous hygiene vigilance sustains post-pandemic adoption. These factors collectively support steady market expansion across sectors.
- For instance, Ecolab developed a touchless dispenser platform validated to deliver over 1,000,000 dispensing cycles, supporting continuous use in airports and large commercial complexes.
Growth in Healthcare Infrastructure and Patient Safety Measures
Healthcare expansion strongly supports market growth. Hospitals increase dispenser density across wards. Clinics standardize sanitizer access points. Patient safety initiatives mandate frequent hand hygiene. Automatic systems improve compliance among staff. Refilling efficiency supports high-traffic usage. New hospital projects include hygiene planning. Accreditation standards reinforce dispenser installation. Long-term care facilities adopt touchless solutions. Healthcare investment ensures consistent demand for dispensers.
- For instance, Diversey developed healthcare dispensers compatible with rapid-change refill systems that reduce refill time to under 30 seconds per unit, supporting efficient operation in high-traffic wards.
Expansion of Commercial and Public Spaces
Commercial real estate growth boosts installations. Offices adopt hygiene stations for employees. Malls place dispensers at high-traffic zones. Airports expand sanitizer coverage for travelers. Hospitality venues integrate dispensers for guest safety. Event venues require visible hygiene measures. Corporate ESG goals support health investments. Building managers prefer durable systems. Public space expansion drives sustained dispenser deployment.
Key Trends & Opportunities
Shift Toward Smart and Touchless Dispensing Technologies
Technology upgrades shape market opportunities. Sensor accuracy improves dispensing reliability. Smart counters track usage and refills. IoT integration supports maintenance planning. Battery efficiency extends device uptime. Sleek designs improve user acceptance. Facility managers value data insights. Premium products command higher margins. Innovation expands applications in smart buildings.
- For instance, Kimberly-Clark engineered touchless dispensers with battery systems supporting continuous operation for 12 months under standard commercial usage conditions.
Rising Adoption in Residential and Educational Settings
Home hygiene awareness creates new opportunities. Compact designs suit residential use. Schools install dispensers at classrooms. Universities standardize hygiene protocols. Parents prioritize child safety measures. Affordable models expand household adoption. Education policies encourage routine sanitation. Community programs reinforce habits. These settings add incremental volume growth.
- For instance, Rubbermaid Commercial Products supplied educational facilities with wall-mounted dispensers capable of supporting 2,000 dispenses per refill, reducing maintenance needs during school hours.
Key Challenges
Price Sensitivity and Maintenance Costs
Cost remains a key challenge. Automatic units carry higher upfront prices. Sensor maintenance adds operational expense. Battery replacement increases lifecycle costs. Budget constraints affect small facilities. Price competition pressures margins. Low-cost alternatives limit premium uptake. Procurement cycles delay replacements. Managing total cost of ownership remains critical.
Reliability and Supply Chain Constraints
Component availability affects production schedules. Sensor shortages disrupt deliveries. Logistics delays impact project timelines. Quality consistency varies across suppliers. Refilling standards lack uniformity. Counterfeit products affect trust. Warranty service challenges persist. Vendors must strengthen sourcing strategies. Reliability concerns can slow adoption decisions.
Regional Analysis
North America
North America holds a 36% market share in the hand sanitizer dispenser market, driven by strong hygiene regulations and high awareness levels. Healthcare facilities maintain dense dispenser networks to meet infection control standards. Commercial offices, airports, and retail chains continue long-term installations. Automatic and wall-mounted units dominate new deployments. Corporate safety policies sustain replacement demand. Educational institutions reinforce hygiene access points. Strong purchasing power supports adoption of smart and touchless models. Established distribution channels ensure product availability. Ongoing public health preparedness keeps demand stable across institutional and commercial environments.
Europe
Europe accounts for a 28% market share, supported by strict workplace safety rules and public health policies. Countries such as Germany, the United Kingdom, and France lead adoption in hospitals and public transport hubs. Commercial buildings integrate dispensers at regulated access points. Sustainability-focused designs gain preference in public facilities. Educational institutions maintain hygiene compliance programs. Replacement cycles support steady demand beyond emergency periods. High regulatory compliance drives preference for certified products. Urban infrastructure and tourism activity further sustain consistent regional demand.
Asia Pacific
Asia Pacific represents a 24% market share, driven by expanding healthcare infrastructure and dense public spaces. China, Japan, South Korea, and India lead regional installations. Hospitals increase dispenser density to manage patient flow. Commercial complexes and transit systems expand hygiene stations. Rising urbanization supports large-volume deployments. Cost-effective manual and automatic units see strong uptake. Government hygiene campaigns raise public awareness. Manufacturing scale advantages improve product affordability. Rapid infrastructure development positions the region as a key growth engine.
Rest of the World
Rest of the World holds a 12% market share, reflecting gradual adoption across Latin America, the Middle East, and Africa. Healthcare expansion supports baseline demand. Airports and public offices drive commercial installations. Hygiene awareness improves in urban centers. Budget constraints favor manual and wall-mounted units. Import dependence shapes product availability. Government-led health initiatives increase deployment in public buildings. Replacement demand remains limited but stable. Infrastructure investments and tourism recovery support incremental growth across developing regions.
Hand Sanitizer Dispenser Market Segmentations:
By Product Type
- Automatic dispensers
- Manual dispensers
By Mounting Type
- Wall-mounted
- Floor-standing
- Countertop
By End User
- Healthcare facilities
- Commercial spaces
- Educational institutions
- Residential
By Geography
- North America
- U.S.
- Canada
- Mexico
- Europe
- Germany
- France
- U.K.
- Italy
- Spain
- Rest of Europe
- Asia Pacific
- China
- Japan
- India
- South Korea
- South-east Asia
- Rest of Asia Pacific
- Latin America
- Brazil
- Argentina
- Rest of Latin America
- Middle East & Africa
- GCC Countries
- South Africa
- Rest of the Middle East and Africa
Competitive Landscape
Competitive landscape or analysis includes GOJO Industries, Inc., Kimberly-Clark Corporation, Ecolab Inc., 3M Company, Essity AB (Tork), SC Johnson Professional, Diversey Holdings, Ltd., Rubbermaid Commercial Products, Kutol Products Company, and Purell. These players compete on dispenser reliability, touchless technology, and compliance with hygiene standards. Market leaders focus on automatic dispensers to reduce contamination risks. Product portfolios emphasize durability and easy refilling for high-traffic locations. Companies invest in sensor accuracy and battery efficiency to improve lifecycle performance. Strong distribution networks support institutional sales. Strategic partnerships with healthcare systems enhance market access. Commercial contracts drive volume stability. Competitive intensity remains moderate due to brand trust and certification requirements. Ongoing innovation and cost optimization define long-term positioning.
Key Player Analysis
- GOJO Industries, Inc.
- Kimberly-Clark Corporation
- Ecolab Inc.
- 3M Company
- Tork (Essity AB)
- SC Johnson Professional
- Diversey Holdings, Ltd.
- Rubbermaid Commercial Products (Newell Brands)
- Kutol Products Company
- Purell (GOJO Industries)
Recent Developments
- In 2025, Kimberly-Clark Professional enhanced its hygiene portfolio primarily through technological integration rather than the release of new dispenser hardware.
- In 2025, Tork refreshed its product line with sensor and manual sanitizer dispensers focused on sustainability and design.
- In 2023, GOJO introduced the ES10 dispensing platform, a new sustainable, touch-free hand hygiene system with reduced plastic use.
Report Coverage
The research report offers an in-depth analysis based on Product Type, Mounting Type, End User and Geography. It details leading market players, providing an overview of their business, product offerings, investments, revenue streams, and key applications. Additionally, the report includes insights into the competitive environment, SWOT analysis, current market trends, as well as the primary drivers and constraints. Furthermore, it discusses various factors that have driven market expansion in recent years. The report also explores market dynamics, regulatory scenarios, and technological advancements that are shaping the industry. It assesses the impact of external factors and global economic changes on market growth. Lastly, it provides strategic recommendations for new entrants and established companies to navigate the complexities of the market.
Future Outlook
- Touchless dispenser adoption will continue to increase across public spaces.
- Healthcare facilities will remain the largest demand contributors.
- Smart dispensing technologies will gain wider integration.
- Commercial buildings will expand permanent hygiene stations.
- Educational institutions will maintain standardized hygiene infrastructure.
- Product designs will focus on durability and ease of maintenance.
- Cost-efficient automatic models will see higher adoption.
- Asia Pacific will show strong volume growth potential.
- Replacement demand will support recurring market revenue.
- Long-term hygiene awareness will sustain market expansion.
Request a Free Sample
Fill in your details and we'll send you a free sample report.
- Sample data tables & charts
- Research methodology
Need a Custom Version of This Report?
Tailor the scope, geography, or segments to your exact requirements.
- Custom geography or segment scope
- Direct access to our analyst team
Frequently Asked Questions
What is the current market size for the Hand Sanitizer Dispenser market, and what is its projected size in 2032?
At what Compound Annual Growth Rate is the Hand Sanitizer Dispenser market projected to grow between 2024 and 2032?
Which Hand Sanitizer Dispenser market segment held the largest share in 2024?
What are the primary factors fueling the growth of the Hand Sanitizer Dispenser market?
Who are the leading companies in the Hand Sanitizer Dispenser market?
Which region commanded the largest share of the Hand Sanitizer Dispenser market in 2024?
Table of Content
Chapter 1. Report Introduction
- 1.1 Report Description & Purpose
- 1.1.1 Report Title & Market Definition
- 1.1.2 Unique Selling Propositions (USP) & Key Differentiators
- 1.1.3 Value Proposition for Stakeholders
- 1.2 Research Objectives
- 1.2.1 Market Sizing Objectives (Volume & Revenue) (Volume Where Applicable)
- 1.2.2 Segmentation Objectives
- 1.2.3 Competitive Intelligence Objectives
- 1.2.4 Forecast & Scenario Objectives
- 1.3 Report Scope
- 1.3.1 Hand Sanitizer Dispenser Scope – Segments & Subsegments Covered
- 1.3.2 Geographic Scope – Regions & Countries Covered
- 1.3.3 Historical Period, Base Year & Forecast Period (2024; forecast to 2032)
- 1.3.4 Inclusions & Exclusions
- 1.4 Industry Classification & Applicable Codes
- 1.5 Currency, Measurement Units & Valuation Basis
- 1.6 Target Stakeholders
- 1.7 Limitations & Assumptions
Chapter 2. Executive Summary
- 2.1 Global Hand Sanitizer Dispenser Market Snapshot
- 2.1.1 Market Size – Historical (2024) & Forecast (2024-2032) (2024: USD 101 million → 2032: USD 281.6 million)
- 2.1.2 Volume & Revenue – Global Totals (Volume Where Applicable)
- 2.1.3 Key Market Highlights – Top Five Facts
- 2.2 Hand Sanitizer Dispenser Market Segmentation Snapshot
- 2.2.1 Market Split by Region – 2024 vs. 2032
- 2.3 Competitive Snapshot
- 2.3.1 Top 10 Players by Revenue Share – 2024
- 2.3.2 Top 10 Players by Volume Share – 2024 (Volume Where Applicable)
- 2.3.3 Recent Strategic Developments (18-Month Summary)
- 2.4 Key Investment Highlights & Strategic Conclusions
Chapter 3. Hand Sanitizer Dispenser Market Dynamics & Industry Analysis
- 3.1 Market Overview & Context
- 3.1.1 Hand Sanitizer Dispenser Market Position in the Broader Industry Value Chain
- 3.1.2 Demand Structure & Purchasing Dynamics
- 3.1.3 Market Maturity & Development Stage by Region
- 3.2 Hand Sanitizer Dispenser Market Drivers
- 3.3 Hand Sanitizer Dispenser Market Restraints & Challenges
- 3.4 Hand Sanitizer Dispenser Market Opportunities
- 3.5 Porter's Five Forces Analysis
- 3.5.1 Threat of New Entrants
- 3.5.2 Bargaining Power of Suppliers
- 3.5.3 Bargaining Power of Buyers
- 3.5.4 Threat of Substitutes
- 3.5.5 Competitive Rivalry – Intensity Assessment
- 3.6 Hand Sanitizer Dispenser Value Chain Analysis
- 3.6.1 Upstream – Key Inputs, Resources & Suppliers
- 3.6.1.1 Key Input/Resource 1
- 3.6.1.2 Key Input/Resource 2
- 3.6.1.3 Key Input/Resource 3
- 3.6.2 Midstream – Core Operations & Value Creation
- 3.6.2.1 Operating Model & Process Overview
- 3.6.2.2 Key Operating Locations & Capabilities by Company
- 3.6.3 Downstream – Market Channels & End Users
- 3.6.3.1 Direct Sales & Customer Engagement Channels
- 3.6.3.2 Indirect Sales, Intermediaries & Partner Channels
- 3.6.4 Value Chain Profitability Analysis
- 3.6.1 Upstream – Key Inputs, Resources & Suppliers
- 3.7 PESTEL Analysis
- 3.7.1 Political Factors
- 3.7.2 Economic Factors
- 3.7.3 Social Factors
- 3.7.4 Technological Factors
- 3.7.5 Environmental Factors
- 3.7.6 Legal Factors
- 3.8 Hand Sanitizer Dispenser Supply Chain Analysis
- 3.8.1 Critical Input & Resource Availability Risk Assessment
- 3.8.2 Supplier & Operational Concentration Risk (Geographic Exposure)
- 3.8.3 Supply & Service Disruption Impact Analysis
- 3.9 Regulatory & Policy Landscape
Note: The regulatory and policy landscape section covers regulations based on their applicability to the market, Hand Sanitizer Dispenser category, geography, and scope of the study. Only regulatory frameworks with a material impact on operations, compliance, trade, sustainability, or market access are analyzed in detail.
Chapter 4. Key Investment Pockets & Opportunity Analysis
- 4.1 Hand Sanitizer Dispenser Market Attractiveness Analysis
- 4.1.1 By Region – Investment Attractiveness Matrix (Market Size × CAGR)
- 4.2 Absolute Revenue Growth Opportunity
- 4.2.1 By Region – Absolute Revenue Growth Through 2032
- 4.3 Incremental Demand Opportunity
- 4.3.1 By Region – Incremental Demand Through 2032
- 4.3.2 Segment – Incremental Demand
- 4.4 Emerging Submarket Opportunity Deep Dive (Subject to Applicability)
- 4.5 Priority Market Opportunity Scorecards
- 4.5.1 United States
- 4.5.2 Europe
- 4.5.3 Asia
- 4.5.4 Middle East & Africa
Note: Priority market opportunity scorecards reflect the geographic scope and strategic relevance of the study. Listed markets are indicative and may be adapted to the industry.
Chapter 5. Hand Sanitizer Dispenser Cross-Border Trade & Market Access Analysis
- 5.1 International Trade & Cross-Border Activity Overview
- 5.1.1 Global Export Value by Country (2024)
- 5.1.2 Global Export Volume by Country (2024) (Volume Where Applicable)
- 5.1.3 Global Import Value by Country (2024)
- 5.1.4 Global Import Volume by Country (2024) (Volume Where Applicable)
- 5.1.5 Net Trade Balance by Country (2024)
- 5.2 Export Analysis – Segment
- 5.2.1 Category 1 (Applicable Classification Code)
- 5.2.2 Category 2 (Applicable Classification Code)
- 5.2.3 Category 3 (Applicable Classification Code)
- 5.2.4 Category 4 (Applicable Classification Code)
- 5.2.5 Category 5 (Applicable Classification Code)
- 5.3 Import Analysis – Segment
- 5.3.1 Category 1 (Applicable Classification Code)
- 5.3.2 Category 2 (Applicable Classification Code)
- 5.3.3 Category 3 (Applicable Classification Code)
- 5.3.4 Category 4 (Applicable Classification Code)
- 5.3.5 Category 5 (Applicable Classification Code)
- 5.4 Cross-Border Pricing & Transaction Benchmarks
- 5.4.1 Export Pricing – Segment & Country
- 5.4.2 Import Pricing – Segment & Source Country
- 5.4.3 Price Trends (2024)
- 5.5 Key Cross-Border Trade & Delivery Routes
- 5.5.1 Cross-Border Trade/Delivery Route 1
- 5.5.2 Cross-Border Trade/Delivery Route 2
- 5.5.3 Cross-Border Trade/Delivery Route 3
- 5.5.4 Cross-Border Trade/Delivery Route 4
- 5.5.5 Cross-Border Trade/Delivery Route 5
- 5.6 Trade Policy & Market Access Impact Assessment
- 5.6.1 Tariff & Non-Tariff Barriers
- 5.6.2 Regional Trade & Economic Integration Frameworks
- 5.6.3 Bilateral & Multilateral Trade Agreements
- 5.6.4 Cross-Border Operating, Licensing & Localization Requirements
Note: This chapter applies where cross-border trade or delivery is relevant to Hand Sanitizer Dispenser. Goods, services, and digital offerings are assessed using applicable classifications and transaction measures. Import-export volumes, trade balances, and route analyses are included only where meaningful to the market.
Chapter 6. Competitive Landscape & Company Benchmarking
- 6.1 Hand Sanitizer Dispenser Market Concentration & Structure
- 6.1.1 Herfindahl-Hirschman Index (HHI) – the historical period vs. 2024
- 6.1.2 Leading, Mid-Sized & Emerging Player Structure
- 6.1.3 Global, Regional & Local Player Dynamics
- 6.2 Hand Sanitizer Dispenser Market Share Analysis – 2024
- 6.2.1 Global Revenue Share by Company
- 6.2.2 Global Volume Share by Company (Volume Where Applicable)
- 6.2.3 Regional Revenue Share
- 6.2.4 Market Share Evolution (the historical period vs. 2024)
- 6.2.5 Company Market Share by Key Segment
- 6.2.6 Company Market Share by Customer Group
- 6.3 Operating Scale, Capacity & Infrastructure Analysis
- 6.3.1 Global Operating Scale & Supply Capacity
- 6.3.2 Resource Utilization & Operating Efficiency
- 6.3.3 Output, Service Delivery & Activity Metrics
- 6.3.4 Operating Footprint & Infrastructure Map
- 6.3.5 Planned Operational & Capacity Expansion
- 6.4 Hand Sanitizer Dispenser Competitive Benchmarking Matrix
- 6.4.1 Revenue, Growth, Profitability & Operating Metric Comparison
- 6.4.2 Channel Revenue Mix
- 6.4.3 Geographic Revenue Exposure
- 6.4.4 R&D Intensity
- 6.4.5 Sustainability Maturity
- 6.5 Strategic Developments in Hand Sanitizer Dispenser (Last 24 Months)
- 6.5.1 Mergers, Acquisitions & Divestments
- 6.5.2 New Products, Services & Solutions in Hand Sanitizer Dispenser
- 6.5.3 Operational & Infrastructure Expansions
- 6.5.4 Strategic Alliances, Joint Ventures & Partnerships
- 6.5.5 Distribution Expansion & Market Entry
- 6.5.6 Sustainability & ESG Initiatives
- 6.6 Competitive Strategy Mapping
- 6.6.1 Leader, Challenger, Follower & Niche Classification
- 6.6.2 Pricing Strategy Comparison
- 6.6.3 Channel Strategy Matrix
Note: Strategic developments are included based on their materiality and the availability of reliable information.
Chapter 7. Global Hand Sanitizer Dispenser Market – By Sales & Delivery Channel
- 7.1 Segment Overview
- 7.1.1 Volume & Revenue Split by Channel (2024 & 2032) (Volume Where Applicable)
- 7.1.2 Channel Mix Evolution (2024-2032)
Chapter 8. Regional Market Analysis – Global Overview
- 8.1 Global Regional Overview
- 8.1.1 Regional Volume Share (Volume Where Applicable)
- 8.1.2 Regional Revenue Share
- 8.1.3 Regional Volume by Region (Volume Where Applicable)
- 8.1.4 Regional Revenue by Region
- 8.1.5 Regional Forecast Through 2032
- 8.2 Cross-Regional Segment Analysis
- 8.2.1 By Sales & Delivery Channel
- 8.2.2 By Competitive Positioning & Price Tier
Chapter 9. North America Hand Sanitizer Dispenser Market
- 9.1 United States
- 9.2 Canada
- 9.3 Mexico
Chapter 10. Europe Hand Sanitizer Dispenser Market
- 10.1 Germany
- 10.2 France
- 10.3 Italy
- 10.4 United Kingdom
- 10.5 Spain
- 10.6 Poland
- 10.7 Russia
- 10.8 Netherlands
- 10.9 Belgium
- 10.10 Sweden
- 10.11 Denmark
- 10.12 Norway
- 10.13 Rest of Europe
Chapter 11. Asia Pacific Hand Sanitizer Dispenser Market
- 11.1 China
- 11.2 India
- 11.3 Japan
- 11.4 South Korea
- 11.5 Thailand
- 11.6 Indonesia
- 11.7 Vietnam
- 11.8 Malaysia
- 11.9 Australia
- 11.10 Rest of Asia Pacific
Chapter 12. Latin America Hand Sanitizer Dispenser Market
- 12.1 Brazil
- 12.2 Argentina
- 12.3 Colombia
- 12.4 Chile
- 12.5 Rest of Latin America
Chapter 13. Middle East Hand Sanitizer Dispenser Market
- 13.1 Saudi Arabia
- 13.2 United Arab Emirates
- 13.3 Turkey
- 13.4 Israel
- 13.5 Iran
- 13.6 Rest of the Middle East
Chapter 14. Africa Hand Sanitizer Dispenser Market
- 14.1 South Africa
- 14.2 Egypt
- 14.3 Nigeria
- 14.4 Morocco
- 14.5 Rest of Africa
Chapter 15. Hand Sanitizer Dispenser Company Profiles
- 15.1 [Company 01]
- 15.1.1 Company Overview
- 15.1.2 Key Management Personnel
- 15.1.3 Products & Services Portfolio
- 15.1.4 Financial Performance
- 15.1.5 Key Market Focus & Geographic Presence
- 15.1.6 Recent Developments & Strategic Initiatives
Note: The company profile list is preliminary and may change based on research findings, market developments, data availability, and client requirements.
Chapter 16. Appendices
- Appendix A – List of Abbreviations & Acronyms
- Appendix B – Industry Classification Code Reference – Full Series
- Appendix C – Supply, Output & Operating Capacity Data Tables
- Appendix D – End-Use & Demand Base Tables
- Appendix E – Demand, Adoption & Usage Assumptions
- Appendix F – Pricing & Revenue Metric Reference Tables
- Appendix G – Company Operations & Infrastructure Database
- Appendix H – Cross-Border Trade & Activity Data Tables (Where Applicable)
- Appendix I – Regulatory Summary Tables
- Appendix J – Primary Research Participant List (Anonymized)
- Appendix K – Primary Research Questionnaire Framework
- Appendix L – Data Sources & Bibliography
- Appendix M – Market Size Divergence & Source Comparison
Chapter 17. Research Methodology
- 17.1 Research Framework & Philosophy
- 17.2 Secondary Research – Sources, Hierarchy & Data Extraction
- 17.3 Data Modeling – Bottom-Up & Top-Down Market Sizing
- 17.4 Primary Research – Stakeholder Framework, LOI & Sample Sizes
- 17.5 Forecast Methodology – Regression, Scenario & Sensitivity Analysis
- 17.6 Quality Control – Four-Layer Validation Framework
- 17.7 Limitations & Standard Assumptions
- 17.8 Disclaimer
