
| REPORT ATTRIBUTE | DETAILS |
|---|---|
| Historical Period | 2020-2023 |
| Base Year | 2024 |
| Forecast Period | 2025-2032 |
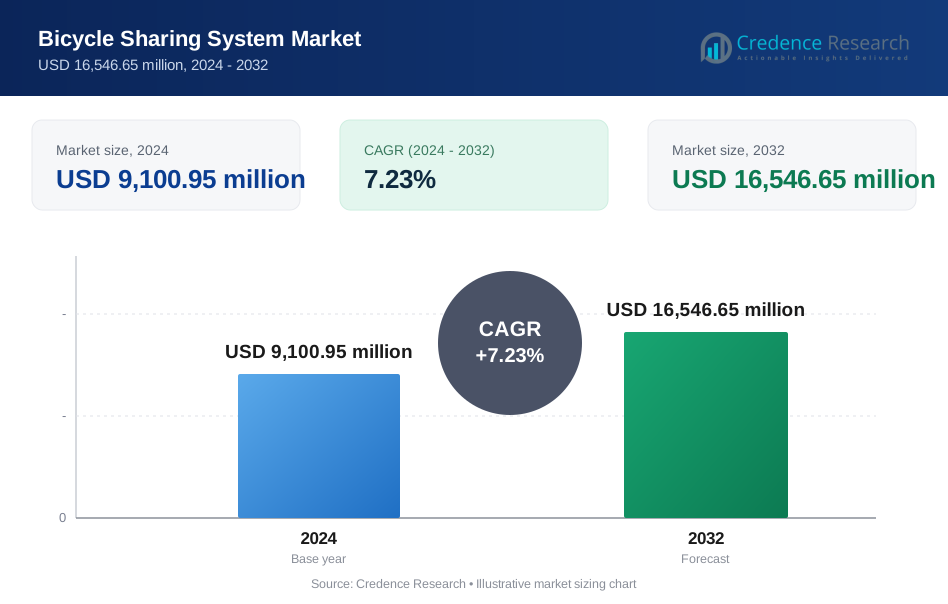
| Bicycle Sharing System Market Size 2024 | USD 9,100.95 million |
| Bicycle Sharing System Market, CAGR | 7.23% |
| Bicycle Sharing System Market Size 2032 | USD 16,546.65 million |
Market Overview
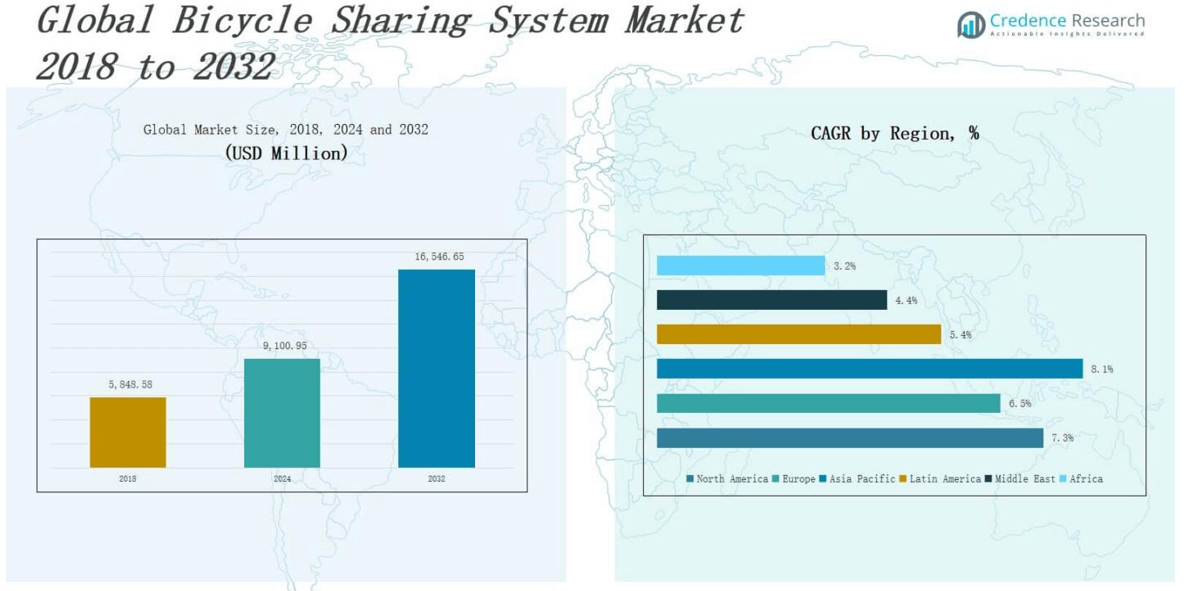
The Bicycle Sharing System Market size was valued at USD 5,848.58 million in 2018 to USD 9,100.95 million in 2024 and is anticipated to reach USD 16,546.65 million by 2032, at a CAGR of 7.23% during the forecast period.
The Bicycle Sharing System Market is experiencing significant growth driven by increasing urban congestion, environmental concerns, and the rising demand for affordable, sustainable transportation solutions. Governments and municipalities are actively promoting cycling infrastructure and integrating bike-sharing programs into public transit systems to reduce traffic emissions and enhance urban mobility. Technological advancements such as GPS-enabled smart locks, mobile app integration, and real-time tracking have streamlined user access and improved fleet management efficiency. The proliferation of dockless and electric bike-sharing models further expands user convenience and geographic coverage, particularly in densely populated cities. Strategic partnerships between public agencies and private operators are enabling rapid deployment and scalability of systems across regions. Additionally, rising health consciousness and consumer preference for contactless, solo travel options in the post-pandemic landscape are boosting adoption. These trends, coupled with investments in smart city initiatives and supportive government policies, are propelling the market forward and positioning bicycle sharing systems as a vital component of future urban transportation networks.
The Bicycle Sharing System Market demonstrates varied growth across regions including North America, Europe, Asia Pacific, Latin America, the Middle East, and Africa. Asia Pacific leads the market in volume and revenue, driven by high urban density and dominant players like Meituan and DiDi in China. Europe and North America follow, supported by advanced infrastructure and policy-driven adoption in countries such as Germany, France, the U.S., and Canada. Latin America shows moderate growth, with Brazil and Mexico emerging as key markets. The Middle East and Africa remain nascent but are expanding due to urban development initiatives and pilot mobility programs. Key players in the global landscape include Uber Technologies, Lyft Inc., JCDecaux, Hello Bike, CycleHop, Deutsche Bahn AG, Meituan Inc., DiDi Bike, and oBike. These companies focus on smart mobility, e-bike integration, and strategic city partnerships to enhance service reach and maintain competitive advantage.
Market Insights
- The Bicycle Sharing System Market is projected to grow from USD 5,848.58 million in 2018 to USD 16,546.65 million by 2032, at a CAGR of 7.23%, driven by urban congestion and demand for sustainable transportation.
- Governments are promoting cycling infrastructure and smart mobility solutions, which support first- and last-mile connectivity and boost long-term adoption.
- Technological upgrades like GPS-enabled locks, IoT integration, and AI-driven fleet management are improving service efficiency and reducing operational losses.
- Dockless and e-bike sharing models are expanding rapidly due to their flexibility, ease of deployment, and strong user acceptance in both developed and emerging markets.
- Theft, vandalism, and inconsistent regulations remain major challenges, increasing operational costs and limiting scalability across certain urban zones.
- Asia Pacific leads the global market with over 35% share, followed by Europe and North America; growth in Latin America, the Middle East, and Africa remains steady but regionally uneven.
- Key players include Uber, Meituan, DiDi, Lyft, JCDecaux, Hello Bike, CycleHop, and Deutsche Bahn AG, all focusing on fleet expansion, e-bike integration, and strategic city partnerships.
Market Drivers
Government Initiatives and Urban Mobility Goals
Governments worldwide are prioritizing low-emission mobility and investing in alternative transportation models to reduce urban congestion and air pollution. The Bicycle Sharing System Market benefits directly from policy support, subsidies, and public-private partnerships that facilitate infrastructure development and program rollouts. Cities are integrating bike-sharing systems into broader smart city initiatives. These efforts aim to promote first- and last-mile connectivity. It supports environmental goals while improving public health through active commuting. Municipal funding and regulatory backing continue to accelerate market expansion.
- For instance, London's Ultra Low Emission Zone (ULEZ), expanded citywide in 2023, reduced nitrogen dioxide by 27% and particulate matter by 31%, demonstrating the impact of regulatory measures on air quality and supporting a modal shift to cycling and public transport.
Technological Advancements in Smart Bicycles
The integration of GPS, IoT, and mobile app connectivity is enhancing user experience and operational efficiency across the Bicycle Sharing System Market. Smart locks, automated payment systems, and real-time bike tracking improve service reliability and fleet management. These technologies reduce theft and streamline maintenance operations. It creates a scalable and data-driven transportation solution. Operators now leverage AI to optimize bike distribution. Smart innovations help meet urban mobility demands with greater precision and lower operational costs..
- For instance, PowUnity’s BikeTrax GPS tracker enables real-time location tracking for e-bikes using IoT and LTE-M technology, significantly improving theft protection and fleet management by sending live data to a connected smartphone app.
Changing Consumer Behavior and Lifestyle Trends
Modern urban consumers are increasingly prioritizing convenience, sustainability, and health in their daily choices. The Bicycle Sharing System Market aligns with these preferences by offering affordable and eco-friendly commuting options. Rising health awareness is encouraging cycling as a form of active transportation. It appeals to both daily commuters and recreational users. Consumers also seek app-based, on-demand services, which bike-sharing platforms now provide. These behavioral shifts are steadily increasing ridership and expanding market reach.
Growth of Dockless and E-Bike Models
Dockless systems and electric bicycles are reshaping the competitive landscape of the Bicycle Sharing System Market. These models offer greater flexibility and user convenience without requiring physical docking stations. E-bikes support longer-distance commutes and reduce physical exertion, appealing to a broader demographic. It allows operators to extend service areas beyond central business zones. The model reduces infrastructure dependency and enables faster market entry. These developments are rapidly boosting adoption in both developed and emerging markets.
Market Trends
Rising Integration with Public Transit Networks
Urban planners and transportation authorities are increasingly aligning bike-sharing programs with broader public transit ecosystems. This multimodal approach improves last-mile connectivity and reduces reliance on private vehicles. The Bicycle Sharing System Market is seeing widespread implementation of shared mobility hubs that link bikes, buses, and metro systems. It strengthens commuter efficiency and supports more fluid urban movement. Transit agencies now partner with bike-sharing providers to offer bundled fare options. The integration is becoming a core feature of sustainable city mobility planning.
- For instance, in Pittsburgh, transit riders using the linked Connect Card receive a free 15-minute bike ride when unlocking a bike with their transit card, directly incentivizing multimodal commuting and streamlining fare payments between modes.
Expansion of Dockless and Flexible Rental Models
Dockless bicycle sharing has rapidly gained popularity for its convenience and low infrastructure requirements. Users can access and park bikes almost anywhere through mobile apps, reducing barriers to adoption. The Bicycle Sharing System Market is evolving toward more flexible rental structures to cater to dynamic commuter patterns. It allows operators to serve a wider geographic area without heavy capital investments. Short-term rentals and pay-per-use models are expanding user access. These innovations reshape how people approach short-distance travel.
Growth in Adoption of E-Bikes Across Urban Corridors
Electric bicycles are becoming a key segment within the Bicycle Sharing System Market due to their speed, accessibility, and reduced physical effort. Commuters increasingly prefer e-bikes for longer routes and hilly terrains. It expands the appeal of bike-sharing to less active users and older demographics. E-bike fleets also generate higher trip frequencies and revenue per ride. Operators are investing in battery-swapping stations and charging infrastructure. The trend supports more inclusive and widespread adoption of shared cycling services.
- For instance, Paris has integrated e-bikes into its urban transport system, enabling residents to use them not just for commuting but also for cargo transport and deliveries. This shift has contributed to cleaner air and reduced congestion on the city’s historic streets.
Data-Driven Operations and Predictive Maintenance Models
Technology is driving operational transformation in the Bicycle Sharing System Market through predictive analytics and real-time data monitoring. Companies track bike usage, location, and condition to optimize fleet distribution and reduce downtime. It improves service reliability and reduces maintenance costs. AI-driven platforms forecast demand surges and recommend strategic bike placements. These systems help avoid service gaps and increase user satisfaction. Data-enabled decisions support scalable growth and improve long-term operational sustainability for providers.
Market Challenges Analysis
Vandalism, Theft, and Operational Losses
One of the critical challenges facing the Bicycle Sharing System Market is the persistent issue of bike vandalism and theft, especially in high-density urban areas. Operators face mounting losses from damaged or missing units, leading to increased maintenance costs and disrupted service availability. It complicates inventory tracking and forces companies to invest in more durable bike designs and advanced locking mechanisms. Insurance premiums and security measures raise operational overheads. Lack of enforcement and public accountability further hampers prevention. These risks undermine profitability and affect investor confidence in long-term scalability.
Infrastructure Gaps and Regulatory Barriers
The Bicycle Sharing System Market also faces difficulties due to inadequate urban infrastructure and inconsistent regulatory support across regions. Many cities lack dedicated bike lanes, safe parking zones, or integration with public transit nodes, limiting system effectiveness. It restricts user adoption and deters potential operators from entering underserved markets. Varying municipal regulations can delay deployment or create compliance challenges for private firms. Policy fragmentation between jurisdictions reduces efficiency and creates friction in scaling operations. These limitations hinder uniform growth and pose barriers to seamless user experience.
Market Opportunities
Untapped Demand in Emerging Urban Centers
Rapid urbanization in emerging economies presents a significant growth avenue for the Bicycle Sharing System Market. Mid-sized cities in Asia, Latin America, and Africa are seeking low-cost, sustainable transport options to address congestion and pollution. It creates a favorable environment for bike-sharing operators to establish cost-effective mobility networks. Rising smartphone penetration and digital payment adoption support seamless user access. Local governments are beginning to allocate funds for non-motorized transport infrastructure. These markets offer first-mover advantages for global and regional providers.
Integration with Smart City and Mobility-as-a-Service Platforms
The Bicycle Sharing System Market stands to benefit from its alignment with smart city developments and Mobility-as-a-Service (MaaS) ecosystems. Municipalities are investing in integrated mobility platforms that unify bikes, public transit, and ride-hailing services into one digital interface. It opens up new revenue streams through API integrations and mobility subscriptions. Technology providers can collaborate with cities to co-develop data-driven solutions. Demand for customized, scalable bike-sharing platforms is growing among urban planners. These partnerships will drive innovation and system interoperability across urban transportation networks.
Market Segmentation Analysis:
By Bike Type
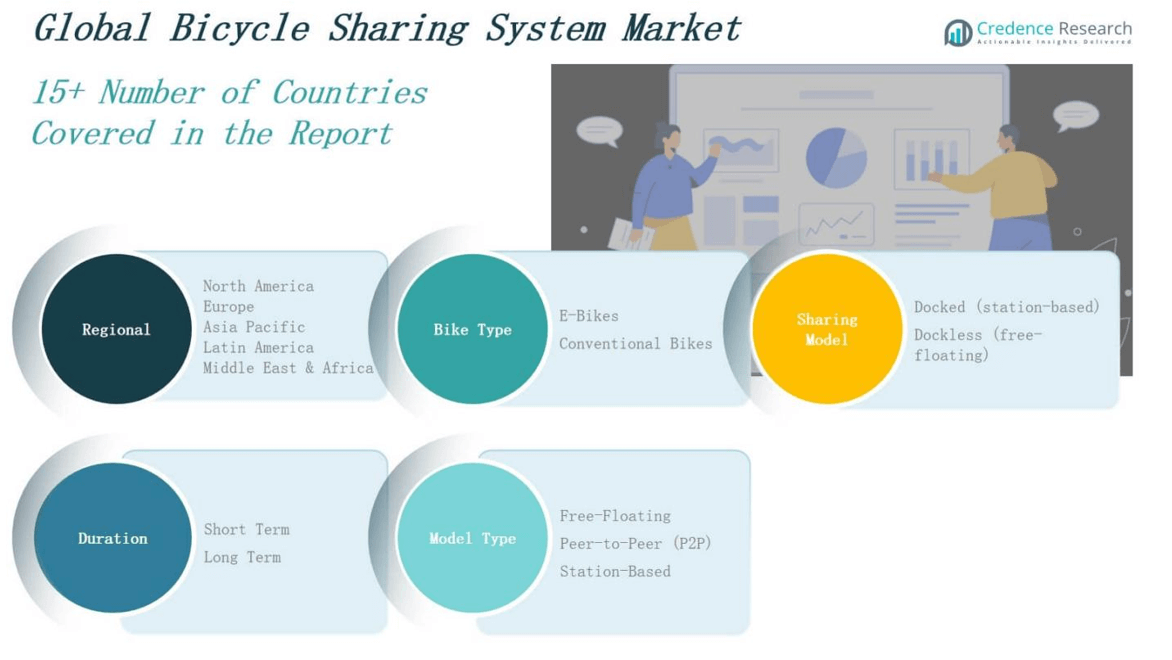
The Bicycle Sharing System Market is segmented into E-Bikes and Conventional Bikes. E-Bikes are gaining traction due to their speed, ease of use, and appeal to a broader user base including older and less active individuals. It supports longer-distance commuting and reduces user fatigue, especially in hilly or urban areas. Conventional bikes remain relevant for short trips and budget-conscious riders. Cities with flat terrains and strong cycling culture still see high adoption of traditional models.
- For instance, in the United States, 1.1 million e-bikes were sold in 2022, surpassing electric car sales, and annual e-bike sales grew 240% between 2019 and 2021, outpacing regular bicycle sales by four times.
By Sharing Model
Based on sharing model, the Bicycle Sharing System Market includes Docked (Station-Based) and Dockless (Free-Floating) systems. Dockless models lead in flexibility, requiring less physical infrastructure and enabling faster deployment across varied urban zones. It supports more scalable and cost-efficient operations. Docked systems, however, offer controlled parking, improved security, and structured user experiences. Municipalities with stricter urban planning guidelines often prefer docked systems for better management.
- For instance, Ofo and Mobike in China rapidly scaled to millions of bikes across more than 100 cities by leveraging GPS-enabled dockless technology, allowing users to locate and unlock bikes via mobile apps without fixed stations.
By Duration
The market also segments by Short Term and Long Term rental durations. Short term rentals dominate due to their convenience for tourists, casual users, and commuters needing one-way trips. It suits high-traffic areas and on-demand transportation needs. Long term subscriptions are growing in appeal among daily users seeking economical and consistent access. Providers are developing loyalty programs and tiered pricing to attract and retain long-term users. This balance supports broader user engagement across demographics.
Segments:
Based on Bike Type
- E-Bikes
- Conventional Bike
Based on Sharing Model
- Docked (Station-Based)
- Dockless (Free-Floating)
Based on Duration
- Short Term
- Long Term
Based on Model Type
- Free-Floating
- Peer-to-Peer (P2P)
- Station-Based
Based on Region
- North America
- U.S.
- Canada
- Mexico
- Europe
- Germany
- France
- U.K.
- Italy
- Spain
- Rest of Europe
- Asia Pacific
- China
- Japan
- India
- South Korea
- South-east Asia
- Rest of Asia Pacific
- Latin America
- Brazil
- Argentina
- Rest of Latin America
- Middle East & Africa
- GCC Countries
- South Africa
- Rest of the Middle East and Africa
Regional Analysis
North America
The North America Bicycle Sharing System Market size was valued at USD 1,124.27 million in 2018 to USD 1,708.20 million in 2024 and is anticipated to reach USD 3,125.58 million by 2032, at a CAGR of 7.3% during the forecast period. North America holds a prominent share of the global market, supported by rising urbanization, sustainability initiatives, and investments in micromobility infrastructure. The United States leads the region, driven by major cities like New York, San Francisco, and Washington D.C., which have well-established public-private bike-sharing partnerships. It benefits from strong app integration, payment systems, and widespread e-bike deployments. Canada and Mexico are also expanding their networks to support urban mobility goals. The region accounts for around 20% of the global market share.
Europe
The Europe Bicycle Sharing System Market size was valued at USD 1,850.14 million in 2018 to USD 2,785.92 million in 2024 and is anticipated to reach USD 4,800.39 million by 2032, at a CAGR of 6.5% during the forecast period. Europe remains a mature and innovation-led market, driven by a strong cycling culture and policy support across key countries like Germany, France, the Netherlands, and the UK. Cities across Europe continue to expand docked and dockless systems while integrating them into multimodal public transport. It sees steady growth in both conventional and e-bike usage. The EU’s investment in green transport is further accelerating adoption. Europe contributes approximately 25% of the global market share.
Asia Pacific
The Asia Pacific Bicycle Sharing System Market size was valued at USD 2,423.30 million in 2018 to USD 3,917.73 million in 2024 and is anticipated to reach USD 7,580.27 million by 2032, at a CAGR of 8.1% during the forecast period. Asia Pacific holds the largest share of the market, accounting for over 35% of global revenue. Countries like China and India dominate, supported by high population density and government efforts to reduce urban congestion. China leads in both user volume and fleet size, driven by giants such as Meituan and DiDi. It also benefits from rapid digitization and favorable regulatory environments. Southeast Asia and South Korea are emerging hotspots for smart and sustainable transport models.
Latin America
The Latin America Bicycle Sharing System Market size was valued at USD 247.01 million in 2018 to USD 379.03 million in 2024 and is anticipated to reach USD 600.42 million by 2032, at a CAGR of 5.4% during the forecast period. Latin America is witnessing steady growth, with countries like Brazil, Mexico, and Colombia actively promoting non-motorized transportation solutions. Urban centers are increasingly investing in cycling infrastructure to tackle congestion and pollution. It is seeing expanded e-bike integration in cities with hilly terrain and long-distance commutes. Public-private partnerships and digital payment integration are supporting usage. Latin America contributes nearly 5% of the global market share.
Middle East
The Middle East Bicycle Sharing System Market size was valued at USD 135.24 million in 2018 to USD 188.54 million in 2024 and is anticipated to reach USD 276.60 million by 2032, at a CAGR of 4.4% during the forecast period. The Middle East market is gradually expanding, led by smart city developments in the UAE, Saudi Arabia, and Qatar. Governments are promoting bicycle-sharing as part of sustainable urban mobility strategies. It benefits from high-tech, app-based systems and tourism-driven demand. However, extreme climate conditions and limited cycling culture in some areas restrict full-scale adoption. The region accounts for approximately 3% of the global market.
Africa
The Africa Bicycle Sharing System Market size was valued at USD 68.62 million in 2018 to USD 121.53 million in 2024 and is anticipated to reach USD 163.38 million by 2032, at a CAGR of 3.2% during the forecast period. Africa represents the smallest share of the global Bicycle Sharing System Market at under 2%. Growth is mainly centered in South Africa, Egypt, and Nigeria, where urbanization is driving interest in alternative mobility solutions. It faces challenges such as limited cycling infrastructure, low smartphone penetration, and lack of regulatory frameworks. However, pilot projects and NGO-driven mobility programs are helping raise awareness and usage. Opportunities remain untapped in secondary cities with dense populations.
Key Player Analysis
- Uber Technologies Inc.
- Deutsche Bahn AG
- Meituan Inc.
- DiDi Bike
- Lyft Inc.
- JCDecaux Group
- Hello Bike
- CycleHop LLC
- oBike
- Nextbike GmbH
- Lime (Neutron Holdings, Inc.)
- Donkey Republic
- Bird Global Inc. (via e-bike services
- Tier Mobility
- Spin (a Ford subsidiary)
Competitive Analysis
The Bicycle Sharing System Market features intense competition among global and regional players aiming to expand their footprint through strategic partnerships, advanced technology, and diversified fleet offerings. Key companies such as Uber Technologies, Meituan Inc., DiDi Bike, Lyft Inc., and JCDecaux dominate in urban centers with integrated mobility platforms and scalable operations. It sees growing investment in electric bike fleets, predictive maintenance, and app-based features to enhance user experience and operational efficiency. Startups and mid-sized firms are entering niche markets with peer-to-peer and free-floating models. Competitive advantage depends on fleet size, geographic coverage, pricing models, and real-time service reliability. Market leaders are also collaborating with local governments to secure contracts and exclusive rights in key cities. The Bicycle Sharing System Market remains dynamic, with constant innovation driving differentiation and user retention in a rapidly evolving urban mobility landscape. Companies that adapt to policy shifts and user expectations are better positioned to capture long-term growth.
Recent Developments
- In March 2025, Yamaha Motor Co., Ltd. acquired Brose’s bicycle drive unit business to strengthen its e-bike system portfolio and expand its development presence in Europe.
- In September 2024, Bicycle Transit Systems, Inc. announced the acquisition of BCycle. In this acquisition, Bicycle Transit Systems became the largest docked bike share provider in the United States by number of communities served.
- In March 2023, MYBYK, an India-based bicycle sharing and rental company, launched MYBYK Electric and MYBYK Electric Cargo. MYBYK Electric features Bluetooth connectivity, keyless cycle unlocking, and keyless battery unlocking.
- In June 2025, Lyft Urban Solutions launched its next-generation bikeshare fleet, including a redesigned electric bike and pedal bike that support both docked and out-of-station use.
Market Concentration & Characteristics
The Bicycle Sharing System Market exhibits moderate to high market concentration, with a mix of global giants and regional players shaping its competitive structure. Leading companies such as Uber Technologies, Meituan Inc., DiDi Bike, Lyft Inc., and JCDecaux hold substantial market share in key urban centers, leveraging scale, digital platforms, and strategic city contracts. The market is characterized by rapid innovation, with operators adopting smart locks, real-time tracking, and electric bikes to differentiate services. It shows strong urban orientation, concentrated in cities with dense populations and supportive infrastructure. Public-private partnerships and regulatory integration play a central role in determining market entry and expansion. The presence of docked and dockless models introduces operational diversity, while flexible rental schemes cater to a broad user base. The Bicycle Sharing System Market remains dynamic, driven by urban mobility trends, evolving consumer preferences, and technological advancement, while being shaped by local policy frameworks and infrastructure readiness.
Report Coverage
The research report offers an in-depth analysis based on Bike Type, Sharing Model, Duration, Model Type and Region. It details leading market players, providing an overview of their business, product offerings, investments, revenue streams, and key applications. Additionally, the report includes insights into the competitive environment, SWOT analysis, current market trends, as well as the primary drivers and constraints. Furthermore, it discusses various factors that have driven market expansion in recent years. The report also explores market dynamics, regulatory scenarios, and technological advancements that are shaping the industry. It assesses the impact of external factors and global economic changes on market growth. Lastly, it provides strategic recommendations for new entrants and established companies to navigate the complexities of the market.
Future Outlook
- Urban areas will continue to expand cycling infrastructure, supporting wider deployment of bike-sharing systems.
- Governments will introduce more regulations favoring non-motorized, low-emission transport modes.
- E-bike usage in sharing fleets will increase, appealing to longer commutes and broader demographics.
- Integration with Mobility-as-a-Service platforms will improve intermodal travel options for users.
- Artificial intelligence will enhance route optimization, predictive maintenance, and fleet distribution.
- Consumer demand for contactless and solo commuting options will sustain post-pandemic growth.
- Private players will expand into secondary cities and emerging economies through scalable models.
- Smart city initiatives will prioritize bike-sharing as a core component of urban mobility ecosystems.
- Strategic partnerships between tech firms and transport agencies will accelerate service innovation.
- Sustainable transport goals will drive funding and policy support for shared bicycle programs.
Request a Free Sample
Fill in your details and we'll send you a free sample report.
- Sample data tables & charts
- Research methodology
Need a Custom Version of This Report?
Tailor the scope, geography, or segments to your exact requirements.
- Custom geography or segment scope
- Direct access to our analyst team
Frequently Asked Questions
What is the current size of the Bicycle Sharing System Market?
What are the key segments within the Bicycle Sharing System Market?
What are some challenges faced by the Bicycle Sharing System Market?
Who are the major players in the Bicycle Sharing System Market?
Table of Content
Chapter 1. Report Introduction
- 1.1 Report Description & Purpose
- 1.1.1 Report Title & Market Definition
- 1.1.2 Unique Selling Propositions (USP) & Key Differentiators
- 1.1.3 Value Proposition for Stakeholders
- 1.2 Research Objectives
- 1.2.1 Market Sizing Objectives (Volume & Revenue)
- 1.2.2 Segmentation Objectives
- 1.2.3 Competitive Intelligence Objectives
- 1.2.4 Forecast & Scenario Objectives
- 1.3 Report Scope
- 1.3.1 Bicycle Sharing System Scope – Types & Subtypes Covered
- 1.3.2 Geographic Scope – Regions & Countries Covered
- 1.3.3 Historical Period, Base Year & Forecast Period (2024; forecast to 2032)
- 1.3.4 Inclusions & Exclusions
- 1.4 HS Code & Classification Framework
- 1.5 Currency, Units & Pricing Basis
- 1.6 Target Stakeholders
- 1.7 Limitations & Assumptions
Chapter 2. Executive Summary
- 2.1 Global Bicycle Sharing System Market Snapshot
- 2.1.1 Market Size – Historical (2024) & Forecast (2024-2032) (2024: USD 9,100.95 million → 2032: USD 16,546.65 million)
- 2.1.2 Volume & Revenue – Global Totals
- 2.1.3 Key Market Highlights – Top Five Facts
- 2.2 Bicycle Sharing System Market Segmentation Snapshot
- 2.2.1 Market Split by Region – 2024 vs. 2032
- 2.3 Competitive Snapshot
- 2.3.1 Top 10 Players by Revenue Share – 2024
- 2.3.2 Top 10 Players by Volume Share – 2024
- 2.3.3 Recent Strategic Developments (18-Month Summary)
- 2.4 Key Investment Highlights & Strategic Conclusions
Chapter 3. Bicycle Sharing System Market Dynamics & Industry Analysis
- 3.1 Market Overview & Context
- 3.1.1 Bicycle Sharing System Market Position in the Broader Automotive Value Chain
- 3.1.2 OEM vs. Replacement Market Dynamics
- 3.1.3 Market Maturity & Development Stage by Region
- 3.2 Bicycle Sharing System Market Drivers
- 3.3 Bicycle Sharing System Market Restraints & Challenges
- 3.4 Bicycle Sharing System Market Opportunities
- 3.5 Porter's Five Forces Analysis
- 3.5.1 Threat of New Entrants
- 3.5.2 Bargaining Power of Suppliers
- 3.5.3 Bargaining Power of Buyers
- 3.5.4 Threat of Substitutes
- 3.5.5 Competitive Rivalry – Intensity Assessment
- 3.6 Bicycle Sharing System Value Chain Analysis
- 3.6.1 Upstream – Raw Material/Input Suppliers
- 3.6.1.1 Raw Material/Input 1
- 3.6.1.2 Raw Material/Input 2
- 3.6.1.3 Raw Material/Input 3
- 3.6.2 Midstream – Production/Manufacturing/Service Delivery
- 3.6.2.1 Production/Process Overview
- 3.6.2.2 Key Facility Locations & Capacity by Manufacturer
- 3.6.3 Downstream – Distribution & End Consumer
- 3.6.3.1 Primary Channel – B2B/OEM
- 3.6.3.2 Secondary Channels – Dealer, Retail, Online, Direct
- 3.6.4 Value Chain Profitability Analysis
- 3.6.1 Upstream – Raw Material/Input Suppliers
- 3.7 PESTEL Analysis
- 3.7.1 Political Factors
- 3.7.2 Economic Factors
- 3.7.3 Social Factors
- 3.7.4 Technological Factors
- 3.7.5 Environmental Factors
- 3.7.6 Legal Factors
- 3.8 Bicycle Sharing System Supply Chain Analysis
- 3.8.1 Raw Material/Input Supply Risk Assessment
- 3.8.2 Manufacturing Concentration Risk (Geographic Exposure)
- 3.8.3 Trade Disruption Impact Analysis
- 3.9 Regulatory & Policy Landscape
Note: The regulatory and policy landscape section covers regulations based on their applicability to the market, Bicycle Sharing System category, geography, and scope of the study. Only regulatory frameworks with a material impact on operations, compliance, trade, sustainability, or market access are analyzed in detail.
Chapter 4. Key Investment Pockets & Opportunity Analysis
- 4.1 Bicycle Sharing System Market Attractiveness Analysis
- 4.1.1 By Region – Investment Attractiveness Matrix (Volume × CAGR)
- 4.2 Absolute Revenue Growth Opportunity
- 4.2.1 By Region – Absolute USD Growth Through 2032
- 4.3 Incremental Volume Opportunity
- 4.3.1 By Region – Incremental Volume Through 2032
- 4.3.2 Segment – Incremental Volume
- 4.4 Emerging Submarket Opportunity Deep Dive (Subject to Applicability)
- 4.5 Emerging Market Opportunity Scorecards
- 4.5.1 United States
- 4.5.2 Europe
- 4.5.3 Asia
- 4.5.4 Middle East & Africa
Note: Emerging Market Opportunity Scorecards will be included based on relevance and strategic importance. Regions listed are indicative and may vary depending on data availability and market dynamics.
Chapter 5. Bicycle Sharing System Import-Export Analysis & Trade Flows
- 5.1 Global Trade Overview
- 5.1.1 Global Export Value by Country (2024)
- 5.1.2 Global Export Volume by Country (2024)
- 5.1.3 Global Import Value by Country (2024)
- 5.1.4 Global Import Volume by Country (2024)
- 5.1.5 Net Trade Balance by Country (2024)
- 5.2 Export Analysis – Segment
- 5.2.1 Type 1 (HS Code)
- 5.2.2 Type 2 (HS Code)
- 5.2.3 Type 3 (HS Code)
- 5.2.4 Type 4 (HS Code)
- 5.2.5 Type 5 (HS Code)
- 5.3 Import Analysis – Segment
- 5.3.1 Type 1 (HS Code)
- 5.3.2 Type 2 (HS Code)
- 5.3.3 Type 3 (HS Code)
- 5.3.4 Type 4 (HS Code)
- 5.3.5 Type 5 (HS Code)
- 5.4 Average Unit Trade Prices
- 5.4.1 Average Export Price – Segment & Country
- 5.4.2 Average Import Price – Segment & Source Country
- 5.4.3 Price Trends (2024)
- 5.5 Key Trade Route Analysis
- 5.5.1 Trade Route 1
- 5.5.2 Trade Route 2
- 5.5.3 Trade Route 3
- 5.5.4 Trade Route 4
- 5.5.5 Trade Route 5
- 5.6 Trade Policy Impact Assessment
- 5.6.1 US Anti-Dumping & Section 301 Tariffs
- 5.6.2 EU Customs Union Impact
- 5.6.3 Major Free Trade Agreements
- 5.6.4 USMCA Rules of Origin
Note: Trade policy analysis will be included only where relevant to the Bicycle Sharing System market.
Chapter 6. Competitive Landscape & Company Benchmarking
- 6.1 Bicycle Sharing System Market Concentration & Structure
- 6.1.1 Herfindahl-Hirschman Index (HHI) – vs. 2024
- 6.1.2 Tier 1, Tier 2 & Tier 3 Market Structure
- 6.1.3 Global, Regional & Local Player Dynamics
- 6.2 Bicycle Sharing System Market Share Analysis – 2024
- 6.2.1 Global Revenue Share by Company
- 6.2.2 Global Volume Share by Company
- 6.2.3 Regional Revenue Share
- 6.2.4 Market Share Evolution ( vs. 2024)
- 6.2.5 OEM Segment Share by Company
- 6.2.6 Replacement Segment Share by Company
- 6.3 Production/Delivery Capacity & Facility Analysis
- 6.3.1 Global Installed Capacity
- 6.3.2 Capacity Utilization Rates
- 6.3.3 Production/Output Volume
- 6.3.4 Facility Locations & Capacity Map
- 6.3.5 Planned Capacity Additions
- 6.4 Bicycle Sharing System Competitive Benchmarking Matrix
- 6.4.1 Revenue, Volume, CAGR & Profitability Comparison
- 6.4.2 Channel Revenue Mix
- 6.4.3 Geographic Revenue Exposure
- 6.4.4 R&D Intensity
- 6.4.5 Sustainability Maturity
- 6.5 Strategic Developments in Bicycle Sharing System (Last 24 Months)
- 6.5.1 Mergers, Acquisitions & Divestments
- 6.5.2 New Bicycle Sharing System Launches
- 6.5.3 Facility Expansions
- 6.5.4 Strategic Alliances, Joint Ventures & Partnerships
- 6.5.5 Distribution Expansion & Market Entry
- 6.5.6 Sustainability & ESG Initiatives
- 6.6 Competitive Strategy Mapping
- 6.6.1 Leader, Challenger, Follower & Niche Classification
- 6.6.2 Pricing Strategy Comparison
- 6.6.3 Channel Strategy Matrix
Note: Strategic developments are included based on their materiality and the availability of reliable information.
Chapter 7. Global Bicycle Sharing System Market – By Distribution Channel
- 7.1 Segment Overview
- 7.1.1 Volume & Revenue Split by Channel (2024 & 2032)
- 7.1.2 Channel Mix Evolution (2024-2032)
Chapter 8. Regional Market Analysis – Global Overview
- 8.1 Global Regional Overview
- 8.1.1 Regional Volume Share
- 8.1.2 Regional Revenue Share
- 8.1.3 Regional Volume by Region
- 8.1.4 Regional Revenue by Region
- 8.1.5 Regional Forecast Through 2032
- 8.2 Cross-Regional Segment Analysis
- 8.2.1 By Distribution Channel
- 8.2.2 By Brand/Price Tier
Chapter 9. North America Bicycle Sharing System Market
- 9.1 United States
- 9.2 Canada
- 9.3 Mexico
Chapter 10. Europe Bicycle Sharing System Market
- 10.1 Germany
- 10.2 France
- 10.3 Italy
- 10.4 United Kingdom
- 10.5 Spain
- 10.6 Poland
- 10.7 Russia
- 10.8 Netherlands
- 10.9 Belgium
- 10.10 Sweden
- 10.11 Denmark
- 10.12 Norway
- 10.13 Rest of Europe
Chapter 11. Asia Pacific Bicycle Sharing System Market
- 11.1 China
- 11.2 India
- 11.3 Japan
- 11.4 South Korea
- 11.5 Thailand
- 11.6 Indonesia
- 11.7 Vietnam
- 11.8 Malaysia
- 11.9 Australia
- 11.10 Rest of Asia Pacific
Chapter 12. Latin America Bicycle Sharing System Market
- 12.1 Brazil
- 12.2 Argentina
- 12.3 Colombia
- 12.4 Chile
- 12.5 Rest of Latin America
Chapter 13. Middle East Bicycle Sharing System Market
- 13.1 Saudi Arabia
- 13.2 United Arab Emirates
- 13.3 Turkey
- 13.4 Israel
- 13.5 Iran
- 13.6 Rest of the Middle East
Chapter 14. Africa Bicycle Sharing System Market
- 14.1 South Africa
- 14.2 Egypt
- 14.3 Nigeria
- 14.4 Morocco
- 14.5 Rest of Africa
Chapter 15. Bicycle Sharing System Company Profiles
- 15.1 [Company 01]
- 15.1.1 Company Overview
- 15.1.2 Key Management Personnel
- 15.1.3 Products & Services Portfolio
- 15.1.4 Financial Performance
- 15.1.5 Key Market Focus & Geographic Presence
- 15.1.6 Recent Developments & Strategic Initiatives
Note: The company profile list is preliminary and may change based on research findings, market developments, data availability, and client requirements.
Chapter 16. Appendices
- Appendix A – List of Abbreviations & Acronyms
- Appendix B – Industry Classification Code Reference – Full Series
- Appendix C – Production & Capacity Data Tables
- Appendix D – End-Use & Demand Base Tables
- Appendix E – Consumption & Replacement Rate Assumptions
- Appendix F – ASP Reference Tables
- Appendix G – Manufacturing & Facility Database
- Appendix H – Import-Export Data Tables
- Appendix I – Regulatory Summary Tables
- Appendix J – Primary Research Participant List (Anonymized)
- Appendix K – Primary Research Questionnaire Framework
- Appendix L – Data Sources & Bibliography
- Appendix M – Market Size Divergence & Source Comparison
Chapter 17. Research Methodology
- 17.1 Research Framework & Philosophy
- 17.2 Secondary Research – Sources, Hierarchy & Data Extraction
- 17.3 Data Modeling – Bottom-Up & Top-Down Market Sizing
- 17.4 Primary Research – Stakeholder Framework, LOI & Sample Sizes
- 17.5 Forecast Methodology – Regression, Scenario & Sensitivity Analysis
- 17.6 Quality Control – Four-Layer Validation Framework
- 17.7 Limitations & Standard Assumptions
- 17.8 Disclaimer
