
Market Overview
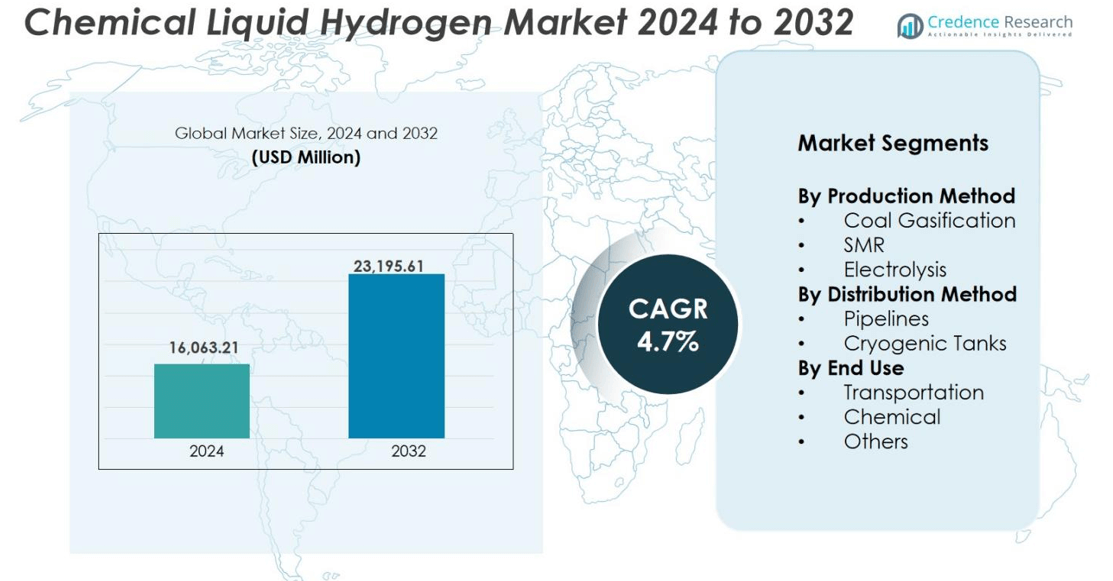
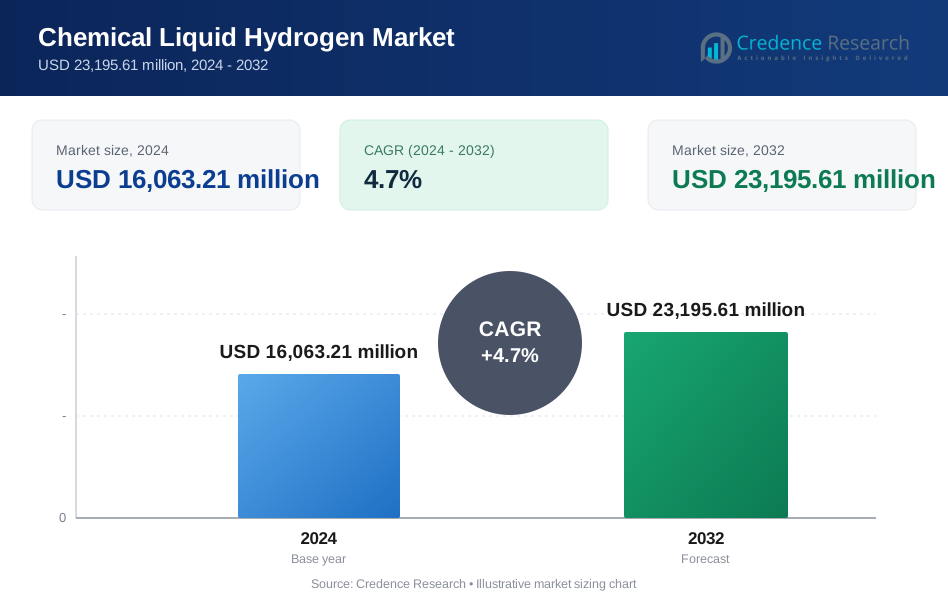
The Chemical Liquid Hydrogen market size was valued at USD 16,063.21 million in 2024 and is anticipated to reach USD 23,195.61 million by 2032, at a CAGR of 4.7% during the forecast period.
| REPORT ATTRIBUTE | DETAILS |
|---|---|
| Historical Period | 2020-2023 |
| Base Year | 2024 |
| Forecast Period | 2025-2032 |
| Chemical Liquid Hydrogen Market Size 2024 | USD 16,063.21 million |
| Chemical Liquid Hydrogen Market, CAGR | 4.7% |
| Chemical Liquid Hydrogen Market Size 2032 | USD 23,195.61 million |
The Chemical Liquid Hydrogen market is supported by major global players that operate large liquefaction facilities, cryogenic storage systems, and distribution networks. Companies such as Air Liquide, Linde, Air Products and Chemicals, Chart Industries, INOXCVA, Kawasaki Heavy Industries, and Iwatani Corporation invest in advanced liquefaction technologies, lightweight storage tanks, and long-range transport systems for industrial and mobility applications. Strategic partnerships with refineries, aerospace programs, and fuel cell vehicle fleets strengthen commercial adoption. Asia Pacific remains the leading regional market with a 34% share, driven by strong clean-energy policies, hydrogen mobility programs, and large-scale production projects across Japan, China, and South Korea.
Market Insights
- The Chemical Liquid Hydrogen market was valued at USD 16,063.21 million in 2024 and will reach USD 23,195.61 million by 2032, growing at a CAGR of 4.7%.
- Demand rises due to clean transportation, aerospace propulsion, and decarbonization of chemical and refining industries. Fuel cell vehicles, hydrogen buses, and marine pilots adopt liquid hydrogen for high energy density and long driving range.
- Companies invest in advanced liquefaction, cryogenic tanks, and distribution systems, while partnerships with automakers, airlines, and industrial users support commercial rollout. Key players include Air Liquide, Linde, Air Products and Chemicals, Chart Industries, and Iwatani Corporation.
- High liquefaction cost, limited infrastructure, and boil-off management remain restraints, especially in regions without large production hubs or hydrogen corridors.
- Asia Pacific leads with a 34% share, supported by hydrogen mobility and industrial projects. Transportation is the dominant segment with a 52% share due to scaling fuel cell fleets and refueling networks.
Market Segmentation Analysis:
By Production Method
Coal gasification, steam methane reforming (SMR), and electrolysis remain the major production routes for chemical liquid hydrogen. SMR holds the dominant share of 64% due to established industrial infrastructure, lower production cost, and large-scale output capabilities. The method supports continuous hydrogen supply for refineries, ammonia plants, and mobility projects. Electrolysis is the fastest-growing sub-segment, supported by renewable power adoption and investments in green hydrogen. Rising government incentives for low-carbon production and expansion of electrolyzer manufacturing strengthen this shift. Coal gasification retains relevance in regions with abundant coal reserves and integrated energy facilities.
- For instance, around two-thirds (over 60%) of hydrogen production in China comes from coal gasification, where companies like Air Products operate oxygen-blown entrained flow gasifiers to enhance efficiency and reduce emissions.
By Distribution Method
Chemical liquid hydrogen is distributed through pipelines and cryogenic tanks, depending on distance and end-user needs. Cryogenic tanks account for the largest share of 59% because they support long-distance transport and flexible delivery to fueling stations, industrial users, and aerospace facilities. Their demand increases as mobility and power applications expand. Pipelines serve large industrial clusters and chemical hubs, offering steady supply with minimal losses. Growing investment in hydrogen corridors and dedicated pipeline networks will support long-term pipeline growth, but cryogenic storage remains dominant due to wider operational reach.
- For instance, Air Liquide utilizes vacuum-insulated cryogenic tanks which can maintain liquid hydrogen at -253°C, allowing transport over long distances with minimal boil-off losses, supporting hydrogen fueling stations and aerospace applications.
By End Use
The Chemical Liquid Hydrogen market serves transportation, chemical processing, and other industrial applications. The transportation segment dominates with a 52% share as fuel cell vehicles, aviation test programs, and marine propulsion adopt liquid hydrogen for high energy density and long-range capability. Automakers and hydrogen refueling infrastructure providers invest in storage, liquefaction, and tank technologies. The chemical industry also uses liquid hydrogen for ammonia production, methanol synthesis, and refinery operations. Other sectors, including power generation and space propulsion, drive additional demand through pilot projects and government-backed clean energy initiatives.
Key Growth Driver
Rising Demand from Clean Mobility and Transportation
Clean mobility programs drive significant growth in the chemical liquid hydrogen market. Fuel cell vehicles, heavy-duty trucks, ships, drones, and future hydrogen-powered aircraft require high-energy storage, and liquid hydrogen offers higher volumetric density than compressed gas. Countries invest in hydrogen refueling corridors, long-range commercial fleets, and aerospace test flights that depend on cryogenic hydrogen. Automakers partner with energy players to develop liquefaction plants and storage tanks to support commercial rollout. Public funding accelerates pilot projects for railway and marine applications, while aviation manufacturers test hydrogen propulsion to meet zero-emission targets.
- For instance, Toyota has developed a liquid hydrogen-fueled racing car, the H2 Corolla, which successfully completed races and is supported by partnerships with major manufacturers like Shinko Industries for fuel tank technology.
Expansion of Industrial and Chemical Applications
Industrial sectors use liquid hydrogen for refining, methanol production, steel processing, ammonia synthesis, semiconductor manufacturing, and high-purity applications. Refineries deploy hydrogen for desulfurization and cracking processes, while chemical plants consume it for synthesis reactions. Growing steel decarbonization projects also favor hydrogen-based direct reduction of iron to reduce CO₂ emissions. Electronics manufacturers demand ultra-pure liquid hydrogen for wafer processing and microchip fabrication. Industrial clusters adopt centralized liquefaction and storage units, enabling bulk supply at stable purity levels.
- For instance, ExxonMobil employs hydrogen extensively in its refining operations to reduce sulfur content through hydrocracking and hydrotreating processes, ensuring cleaner fuels.
Government Policies and Green Hydrogen Investments
Policies promoting net-zero emissions accelerate liquid hydrogen deployment. Funding for renewable electrolysis, clean industrial fuel, aviation decarbonization, and maritime transformation supports long-term ecosystem growth. National hydrogen roadmaps in Europe, the U.S., Japan, and South Korea include incentives for liquefaction plants, refueling stations, and transportation fleets. Companies invest in green hydrogen facilities powered by solar, wind, and hydropower to reduce lifecycle emissions and meet regulatory compliance. Infrastructure spending supports pipelines, cryogenic tank fleets, and large-scale terminals near industrial hubs.
Key Trends & Opportunities
Technological Advancements in Storage and Liquefaction
Cryogenic systems are evolving to store hydrogen at lower cost and higher efficiency. New liquefaction technologies reduce energy consumption and mitigate boil-off losses, making long-distance transport more economical. Advanced tank materials improve insulation performance and durability for automotive, maritime, and aerospace applications. Hydrogen hubs integrate large liquefiers, terminals, and distribution networks to supply industrial clusters and fueling stations. These improvements attract private players, EPC contractors, and port authorities who see hydrogen bunkering as a long-term business opportunity. Modular storage and mobile tank containers open opportunities for remote and off-grid users.
- For instance, The Western Green Energy Hub in Australia, a proposed project being developed by a consortium including InterContinental Energy, CWP Global, and Mirning Green Energy Limited, is planned to become one of the world's largest renewable energy and green hydrogen production facilities upon full development over a 30-year period.
Growing Adoption in Aerospace and Space Programs
Aerospace agencies and commercial space companies use liquid hydrogen as a high-efficiency propellant. Space launch vehicles rely on hydrogen for high thrust-to-weight ratios, and commercial launch providers continue expanding payloads and missions. Aviation manufacturers test hydrogen-powered engines and fuel cells for short- and mid-range aircraft. Development of cryogenic aviation fuel tanks, heat-management systems, and airport refueling infrastructure creates new investment opportunities. Partnerships between aerospace companies, OEMs, and research institutions accelerate certification and system integration. Successful milestones in aviation hydrogen propulsion could unlock a large commercial market over the next two decades.
- For instance, Aviation manufacturers like Airbus are advancing hydrogen-powered engines, exemplified by their ZEROe project, which successfully tested a 1.2 MW hydrogen fuel cell propulsion system, aiming for commercial hydrogen aircraft by the 2030s.
Key Challenges
High Production and Liquefaction Costs
Producing liquid hydrogen requires energy-intensive liquefaction equipment, refrigeration stages, and specialized compression systems. High electricity prices increase operating costs, especially in regions dependent on fossil-fuel-based power. Transport and storage also require expensive cryogenic tanks and boil-off management systems. These factors limit cost competitiveness compared with compressed hydrogen or conventional fuels. Scaling up renewable electrolysis can reduce emissions but still faces high capital expenditure. Many developing regions lack hydrogen infrastructure, increasing delivery costs. Cost reduction will depend on advances in liquefaction efficiency, renewable power pricing, and large-scale plant deployment.
Limited Infrastructure and Safety Concerns
The market faces constraints from limited liquefaction terminals, hydrogen pipelines, and refueling stations. Many regions lack cryogenic transport fleets and bulk storage facilities, slowing commercial adoption. Safety regulations require strict handling protocols because hydrogen is highly flammable and stored at extremely low temperatures. Industries need trained personnel, robust detection systems, and advanced insulation technologies to avoid accidents. Regulatory approvals increase project timelines and raise investment requirements. Infrastructure expansion will require coordinated policies, utility partnerships, and technological standards to ensure safe large-scale storage and distribution.
Regional Analysis
North America
North America holds a 32% share of the Chemical Liquid Hydrogen market, driven by strong adoption in clean mobility, aerospace propulsion, and industrial decarbonization projects. The United States invests in hydrogen corridors, liquefaction plants, and heavy-duty fuel cell fleets across logistics and public transport. NASA and commercial space firms rely on liquid hydrogen for launch vehicles, while refineries and chemical plants consume large volumes for processing. Federal clean energy incentives encourage production via renewable electrolysis and SMR with carbon capture. Canada supports pilot projects for mining, steel processing, and long-range hydrogen trucking, strengthening regional demand momentum.
Europe
Europe accounts for 29% of the market, supported by strong environmental regulations, green hydrogen roadmaps, and clean fuel standards for aviation and maritime sectors. Germany, France, the Netherlands, and Norway fund large-scale electrolysis plants, hydrogen ports, and cross-border pipeline networks. Industrial clusters deploy liquid hydrogen to cut emissions in steel and chemicals. Automotive manufacturers expand fuel cell vehicle testing and hydrogen refueling stations across highways. The region also advances cryogenic tank technology and storage materials for transportation and aerospace. EU-backed carbon reduction policies ensure long-term demand, positioning Europe as a major hub for low-carbon liquid hydrogen.
Asia Pacific
Asia Pacific leads with a 34% market share, supported by strong investments in hydrogen fueling infrastructure, liquefaction plants, and mobility programs. Japan and South Korea deploy hydrogen buses, commercial vehicles, and maritime pilot projects, while China scales industrial hydrogen consumption for chemicals and steel. Aerospace research agencies in Japan explore hydrogen-powered aviation. Australia invests in export-oriented green hydrogen facilities supplying Japan and Southeast Asia. Technology partnerships between energy companies and equipment manufacturers drive innovation in liquefaction efficiency and cryogenic logistics. Rapid industrial growth and government-backed hydrogen roadmaps make Asia Pacific the fastest-growing regional market.
Rest of the World
The Rest of the World segment holds a 5% share, with growing demand from the Middle East, Latin America, and Africa. Middle Eastern countries invest in large renewable hydrogen projects powered by solar and wind for export and industrial applications. Latin America explores hydrogen for mining fleets, fertilizers, and power generation, supported by abundant renewable energy resources. Africa sees early-stage investments in green ammonia and export-oriented hydrogen plants. Limited infrastructure and high capital requirements restrain rapid adoption, but international partnerships, technology transfer, and government-led pilot programs are gradually expanding market prospects.
Market Segmentations
By Production Method
- Coal Gasification
- SMR
- Electrolysis
By Distribution Method
- Pipelines
- Cryogenic Tanks
By End Use
- Transportation
- Chemical
- Others
By Geography
- North America
- U.S.
- Canada
- Mexico
- Europe
- Germany
- France
- U.K.
- Italy
- Spain
- Rest of Europe
- Asia Pacific
- China
- Japan
- India
- South Korea
- South-east Asia
- Rest of Asia Pacific
- Latin America
- Brazil
- Argentina
- Rest of Latin America
- Middle East & Africa
- GCC Countries
- South Africa
- Rest of the Middle East and Africa
Competitive Landscape
The Chemical Liquid Hydrogen market features strong competition among global industrial gas suppliers, engineering companies, and cryogenic equipment manufacturers. Leading companies invest in liquefaction plants, hydrogen hubs, storage innovations, and large-scale transportation networks to meet growing demand from mobility, aerospace, and industrial sectors. Major players secure long-term agreements with refineries, fuel cell vehicle fleets, chemical plants, and space agencies to ensure supply stability. Technology partnerships focus on improving liquefaction efficiency, reducing boil-off losses, and developing lightweight cryogenic tanks for transport and aviation. Companies also expand through joint ventures, acquisitions, and regional production facilities to strengthen distribution capabilities. Strategic investments in green hydrogen from electrolysis support sustainability goals and compliance with low-carbon regulations. As governments fund new hydrogen corridors and refueling stations, market competition intensifies, encouraging innovation in storage materials, pipeline infrastructure, and modular delivery systems.
Key Player Analysis
- GENH2
- Kawasaki Heavy Industries
- INOXCVA
- Air Liquide
- Chart Industries
- Linde
- Engie
- Iwatani Corporation
- GE Appliances
- Air Products and Chemicals, Inc.
Recent Developments
- In October 2025, MB Energy and Gen2 Energy signed a partnership agreement to establish a liquid hydrogen supply chain between Norway and Germany, focusing on the production, offtake, and distribution of RFNBO-compliant liquid hydrogen.
- In May 2025, Samsung E&A, in collaboration with Nel, launched CompassH2 a next-generation green hydrogen production plant solution during the World Hydrogen Summit 2025 held in Rotterdam, Netherlands.
- In October 2025, Tiger Logistics Limited entered a Memorandum of Understanding with Russia’s H2 Invest LLC to introduce cryogenic storage and transportation technology for liquid hydrogen in India.
Report Coverage
The research report offers an in-depth analysis based on Production, Distribution, End-Use and Geography. It details leading market players, providing an overview of their business, product offerings, investments, revenue streams, and key applications. Additionally, the report includes insights into the competitive environment, SWOT analysis, current market trends, as well as the primary drivers and constraints. Furthermore, it discusses various factors that have driven market expansion in recent years. The report also explores market dynamics, regulatory scenarios, and technological advancements that are shaping the industry. It assesses the impact of external factors and global economic changes on market growth. Lastly, it provides strategic recommendations for new entrants and established companies to navigate the complexities of the market.
Future Outlook
- Clean mobility will increase adoption as fuel cell trucks, buses, and ships scale.
- Aviation programs will expand liquid hydrogen testing for short and mid-range aircraft.
- Green hydrogen projects will grow as more electrolysis plants reach commercial capacity.
- Liquefaction technology will improve efficiency and reduce operating cost.
- Cryogenic tank materials will advance to reduce boil-off losses during long transport.
- Hydrogen refueling corridors will expand across highways, ports, and logistics hubs.
- Industrial users will adopt liquid hydrogen to decarbonize steel, chemicals, and refining.
- Space launch companies will drive demand for high-thrust propulsion fuel.
- International trade of liquid hydrogen will rise as export terminals become operational.
- Public and private investment will accelerate infrastructure, storage, and safety standards.
Request a Free Sample
Fill in your details and we'll send you a free sample report.
- Sample data tables & charts
- Research methodology
Need a Custom Version of This Report?
Tailor the scope, geography, or segments to your exact requirements.
- Custom geography or segment scope
- Direct access to our analyst team
Frequently Asked Questions
What is the current market size for the Chemical Liquid Hydrogen market, and what is its projected size in 2032?
At what Compound Annual Growth Rate is the Chemical Liquid Hydrogen market projected to grow between 2025 and 2032?
Which Chemical Liquid Hydrogen market segment held the largest share in 2024?
What are the primary factors fueling the growth of the Chemical Liquid Hydrogen market?
Who are the leading companies in the Chemical Liquid Hydrogen market?
Which region commanded the largest share of the Chemical Liquid Hydrogen market in 2024?
Table of Content
Chapter 1. Report Introduction
- 1.1 Report Description & Purpose
- 1.1.1 Report Title & Market Definition
- 1.1.2 Unique Selling Propositions (USP) & Key Differentiators
- 1.1.3 Value Proposition for Stakeholders
- 1.2 Research Objectives
- 1.2.1 Market Sizing Objectives (Volume & Revenue)
- 1.2.2 Segmentation Objectives
- 1.2.3 Competitive Intelligence Objectives
- 1.2.4 Forecast & Scenario Objectives
- 1.3 Report Scope
- 1.3.1 Chemical Liquid Hydrogen Scope – Types & Subtypes Covered
- 1.3.2 Geographic Scope – Regions & Countries Covered
- 1.3.3 Historical Period, Base Year & Forecast Period (2024; forecast to 2032)
- 1.3.4 Inclusions & Exclusions
- 1.4 HS Code & Classification Framework
- 1.5 Currency, Units & Pricing Basis
- 1.6 Target Stakeholders
- 1.7 Limitations & Assumptions
Chapter 2. Executive Summary
- 2.1 Global Chemical Liquid Hydrogen Market Snapshot
- 2.1.1 Market Size – Historical (2024) & Forecast (2024-2032) (2024: USD 16,063.21 million → 2032: USD 23,195.61 million)
- 2.1.2 Volume & Revenue – Global Totals
- 2.1.3 Key Market Highlights – Top Five Facts
- 2.2 Chemical Liquid Hydrogen Market Segmentation Snapshot
- 2.2.1 Market Split by Region – 2024 vs. 2032
- 2.3 Competitive Snapshot
- 2.3.1 Top 10 Players by Revenue Share – 2024
- 2.3.2 Top 10 Players by Volume Share – 2024
- 2.3.3 Recent Strategic Developments (18-Month Summary)
- 2.4 Key Investment Highlights & Strategic Conclusions
Chapter 3. Chemical Liquid Hydrogen Market Dynamics & Industry Analysis
- 3.1 Market Overview & Context
- 3.1.1 Chemical Liquid Hydrogen Market Position in the Broader Automotive Value Chain
- 3.1.2 OEM vs. Replacement Market Dynamics
- 3.1.3 Market Maturity & Development Stage by Region
- 3.2 Chemical Liquid Hydrogen Market Drivers
- 3.3 Chemical Liquid Hydrogen Market Restraints & Challenges
- 3.4 Chemical Liquid Hydrogen Market Opportunities
- 3.5 Porter's Five Forces Analysis
- 3.5.1 Threat of New Entrants
- 3.5.2 Bargaining Power of Suppliers
- 3.5.3 Bargaining Power of Buyers
- 3.5.4 Threat of Substitutes
- 3.5.5 Competitive Rivalry – Intensity Assessment
- 3.6 Chemical Liquid Hydrogen Value Chain Analysis
- 3.6.1 Upstream – Raw Material/Input Suppliers
- 3.6.1.1 Raw Material/Input 1
- 3.6.1.2 Raw Material/Input 2
- 3.6.1.3 Raw Material/Input 3
- 3.6.2 Midstream – Production/Manufacturing/Service Delivery
- 3.6.2.1 Production/Process Overview
- 3.6.2.2 Key Facility Locations & Capacity by Manufacturer
- 3.6.3 Downstream – Distribution & End Consumer
- 3.6.3.1 Primary Channel – B2B/OEM
- 3.6.3.2 Secondary Channels – Dealer, Retail, Online, Direct
- 3.6.4 Value Chain Profitability Analysis
- 3.6.1 Upstream – Raw Material/Input Suppliers
- 3.7 PESTEL Analysis
- 3.7.1 Political Factors
- 3.7.2 Economic Factors
- 3.7.3 Social Factors
- 3.7.4 Technological Factors
- 3.7.5 Environmental Factors
- 3.7.6 Legal Factors
- 3.8 Chemical Liquid Hydrogen Supply Chain Analysis
- 3.8.1 Raw Material/Input Supply Risk Assessment
- 3.8.2 Manufacturing Concentration Risk (Geographic Exposure)
- 3.8.3 Trade Disruption Impact Analysis
- 3.9 Regulatory & Policy Landscape
Note: The regulatory and policy landscape section covers regulations based on their applicability to the market, Chemical Liquid Hydrogen category, geography, and scope of the study. Only regulatory frameworks with a material impact on operations, compliance, trade, sustainability, or market access are analyzed in detail.
Chapter 4. Key Investment Pockets & Opportunity Analysis
- 4.1 Chemical Liquid Hydrogen Market Attractiveness Analysis
- 4.1.1 By Region – Investment Attractiveness Matrix (Volume × CAGR)
- 4.2 Absolute Revenue Growth Opportunity
- 4.2.1 By Region – Absolute USD Growth Through 2032
- 4.3 Incremental Volume Opportunity
- 4.3.1 By Region – Incremental Volume Through 2032
- 4.3.2 Segment – Incremental Volume
- 4.4 Emerging Submarket Opportunity Deep Dive (Subject to Applicability)
- 4.5 Emerging Market Opportunity Scorecards
- 4.5.1 United States
- 4.5.2 Europe
- 4.5.3 Asia
- 4.5.4 Middle East & Africa
Note: Emerging Market Opportunity Scorecards will be included based on relevance and strategic importance. Regions listed are indicative and may vary depending on data availability and market dynamics.
Chapter 5. Chemical Liquid Hydrogen Import-Export Analysis & Trade Flows
- 5.1 Global Trade Overview
- 5.1.1 Global Export Value by Country (2024)
- 5.1.2 Global Export Volume by Country (2024)
- 5.1.3 Global Import Value by Country (2024)
- 5.1.4 Global Import Volume by Country (2024)
- 5.1.5 Net Trade Balance by Country (2024)
- 5.2 Export Analysis – Segment
- 5.2.1 Type 1 (HS Code)
- 5.2.2 Type 2 (HS Code)
- 5.2.3 Type 3 (HS Code)
- 5.2.4 Type 4 (HS Code)
- 5.2.5 Type 5 (HS Code)
- 5.3 Import Analysis – Segment
- 5.3.1 Type 1 (HS Code)
- 5.3.2 Type 2 (HS Code)
- 5.3.3 Type 3 (HS Code)
- 5.3.4 Type 4 (HS Code)
- 5.3.5 Type 5 (HS Code)
- 5.4 Average Unit Trade Prices
- 5.4.1 Average Export Price – Segment & Country
- 5.4.2 Average Import Price – Segment & Source Country
- 5.4.3 Price Trends (2024)
- 5.5 Key Trade Route Analysis
- 5.5.1 Trade Route 1
- 5.5.2 Trade Route 2
- 5.5.3 Trade Route 3
- 5.5.4 Trade Route 4
- 5.5.5 Trade Route 5
- 5.6 Trade Policy Impact Assessment
- 5.6.1 US Anti-Dumping & Section 301 Tariffs
- 5.6.2 EU Customs Union Impact
- 5.6.3 Major Free Trade Agreements
- 5.6.4 USMCA Rules of Origin
Note: Trade policy analysis will be included only where relevant to the Chemical Liquid Hydrogen market.
Chapter 6. Competitive Landscape & Company Benchmarking
- 6.1 Chemical Liquid Hydrogen Market Concentration & Structure
- 6.1.1 Herfindahl-Hirschman Index (HHI) – vs. 2024
- 6.1.2 Tier 1, Tier 2 & Tier 3 Market Structure
- 6.1.3 Global, Regional & Local Player Dynamics
- 6.2 Chemical Liquid Hydrogen Market Share Analysis – 2024
- 6.2.1 Global Revenue Share by Company
- 6.2.2 Global Volume Share by Company
- 6.2.3 Regional Revenue Share
- 6.2.4 Market Share Evolution ( vs. 2024)
- 6.2.5 OEM Segment Share by Company
- 6.2.6 Replacement Segment Share by Company
- 6.3 Production/Delivery Capacity & Facility Analysis
- 6.3.1 Global Installed Capacity
- 6.3.2 Capacity Utilization Rates
- 6.3.3 Production/Output Volume
- 6.3.4 Facility Locations & Capacity Map
- 6.3.5 Planned Capacity Additions
- 6.4 Chemical Liquid Hydrogen Competitive Benchmarking Matrix
- 6.4.1 Revenue, Volume, CAGR & Profitability Comparison
- 6.4.2 Channel Revenue Mix
- 6.4.3 Geographic Revenue Exposure
- 6.4.4 R&D Intensity
- 6.4.5 Sustainability Maturity
- 6.5 Strategic Developments in Chemical Liquid Hydrogen (Last 24 Months)
- 6.5.1 Mergers, Acquisitions & Divestments
- 6.5.2 New Chemical Liquid Hydrogen Launches
- 6.5.3 Facility Expansions
- 6.5.4 Strategic Alliances, Joint Ventures & Partnerships
- 6.5.5 Distribution Expansion & Market Entry
- 6.5.6 Sustainability & ESG Initiatives
- 6.6 Competitive Strategy Mapping
- 6.6.1 Leader, Challenger, Follower & Niche Classification
- 6.6.2 Pricing Strategy Comparison
- 6.6.3 Channel Strategy Matrix
Note: Strategic developments are included based on their materiality and the availability of reliable information.
Chapter 7. Global Chemical Liquid Hydrogen Market – By Distribution Channel
- 7.1 Segment Overview
- 7.1.1 Volume & Revenue Split by Channel (2024 & 2032)
- 7.1.2 Channel Mix Evolution (2024-2032)
Chapter 8. Regional Market Analysis – Global Overview
- 8.1 Global Regional Overview
- 8.1.1 Regional Volume Share
- 8.1.2 Regional Revenue Share
- 8.1.3 Regional Volume by Region
- 8.1.4 Regional Revenue by Region
- 8.1.5 Regional Forecast Through 2032
- 8.2 Cross-Regional Segment Analysis
- 8.2.1 By Distribution Channel
- 8.2.2 By Brand/Price Tier
Chapter 9. North America Chemical Liquid Hydrogen Market
- 9.1 United States
- 9.2 Canada
- 9.3 Mexico
Chapter 10. Europe Chemical Liquid Hydrogen Market
- 10.1 Germany
- 10.2 France
- 10.3 Italy
- 10.4 United Kingdom
- 10.5 Spain
- 10.6 Poland
- 10.7 Russia
- 10.8 Netherlands
- 10.9 Belgium
- 10.10 Sweden
- 10.11 Denmark
- 10.12 Norway
- 10.13 Rest of Europe
Chapter 11. Asia Pacific Chemical Liquid Hydrogen Market
- 11.1 China
- 11.2 India
- 11.3 Japan
- 11.4 South Korea
- 11.5 Thailand
- 11.6 Indonesia
- 11.7 Vietnam
- 11.8 Malaysia
- 11.9 Australia
- 11.10 Rest of Asia Pacific
Chapter 12. Latin America Chemical Liquid Hydrogen Market
- 12.1 Brazil
- 12.2 Argentina
- 12.3 Colombia
- 12.4 Chile
- 12.5 Rest of Latin America
Chapter 13. Middle East Chemical Liquid Hydrogen Market
- 13.1 Saudi Arabia
- 13.2 United Arab Emirates
- 13.3 Turkey
- 13.4 Israel
- 13.5 Iran
- 13.6 Rest of the Middle East
Chapter 14. Africa Chemical Liquid Hydrogen Market
- 14.1 South Africa
- 14.2 Egypt
- 14.3 Nigeria
- 14.4 Morocco
- 14.5 Rest of Africa
Chapter 15. Chemical Liquid Hydrogen Company Profiles
- 15.1 [Company 01]
- 15.1.1 Company Overview
- 15.1.2 Key Management Personnel
- 15.1.3 Products & Services Portfolio
- 15.1.4 Financial Performance
- 15.1.5 Key Market Focus & Geographic Presence
- 15.1.6 Recent Developments & Strategic Initiatives
Note: The company profile list is preliminary and may change based on research findings, market developments, data availability, and client requirements.
Chapter 16. Appendices
- Appendix A – List of Abbreviations & Acronyms
- Appendix B – Industry Classification Code Reference – Full Series
- Appendix C – Production & Capacity Data Tables
- Appendix D – End-Use & Demand Base Tables
- Appendix E – Consumption & Replacement Rate Assumptions
- Appendix F – ASP Reference Tables
- Appendix G – Manufacturing & Facility Database
- Appendix H – Import-Export Data Tables
- Appendix I – Regulatory Summary Tables
- Appendix J – Primary Research Participant List (Anonymized)
- Appendix K – Primary Research Questionnaire Framework
- Appendix L – Data Sources & Bibliography
- Appendix M – Market Size Divergence & Source Comparison
Chapter 17. Research Methodology
- 17.1 Research Framework & Philosophy
- 17.2 Secondary Research – Sources, Hierarchy & Data Extraction
- 17.3 Data Modeling – Bottom-Up & Top-Down Market Sizing
- 17.4 Primary Research – Stakeholder Framework, LOI & Sample Sizes
- 17.5 Forecast Methodology – Regression, Scenario & Sensitivity Analysis
- 17.6 Quality Control – Four-Layer Validation Framework
- 17.7 Limitations & Standard Assumptions
- 17.8 Disclaimer
