
Chemoinformatics Market Overview:
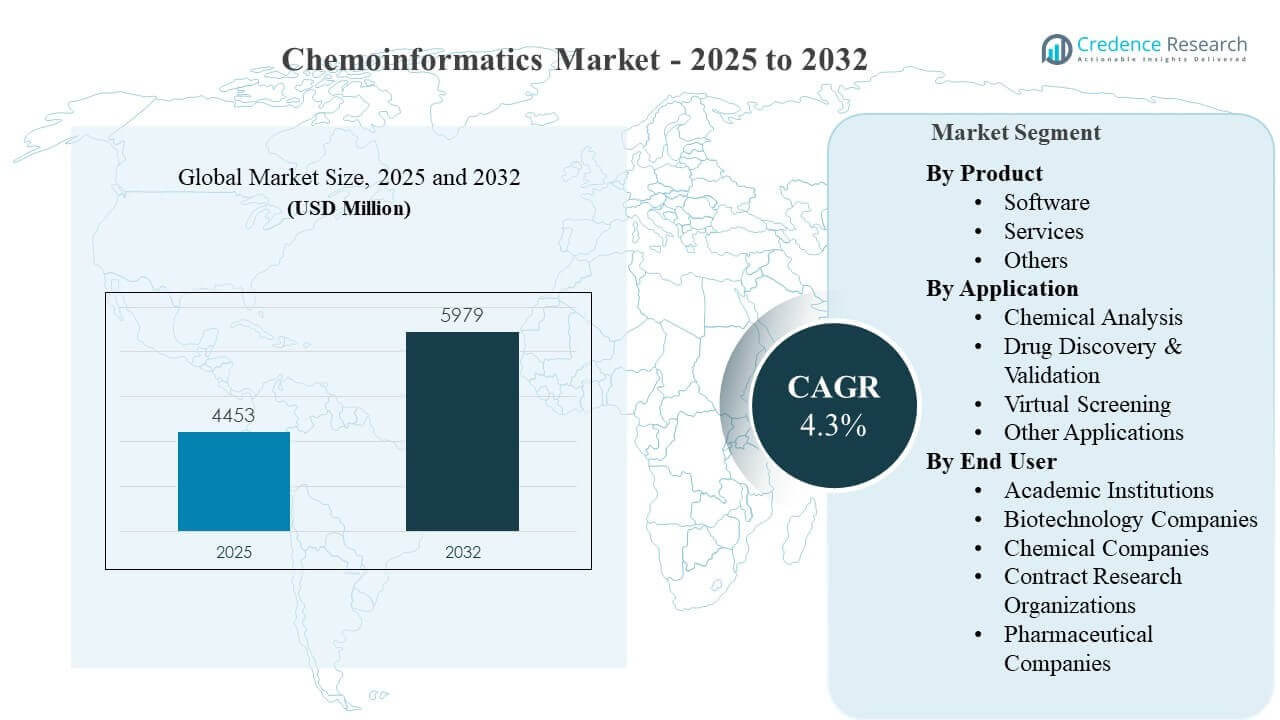
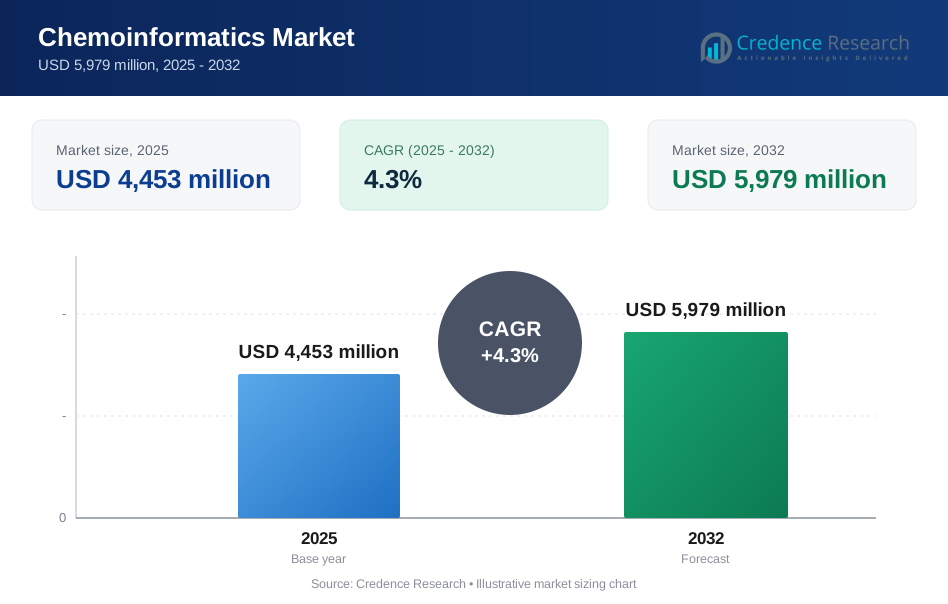
The global Chemoinformatics Market size was estimated at USD 4,453 million in 2025 and is expected to reach USD 5,979 million by 2032, growing at a CAGR of 4.3% from 2025 to 2032. Growth momentum is primarily driven by rising use of computational methods to reduce early-stage discovery attrition through faster compound prioritization, property prediction, and structure–activity optimization within integrated R&D workflows. Chemoinformatics Market adoption is also expanding as cloud-enabled deployment and enterprise data integration make cheminformatics capabilities accessible across distributed research teams and partner ecosystems.
| REPORT ATTRIBUTE | DETAILS |
|---|---|
| Historical Period | 2020-2024 |
| Base Year | 2025 |
| Forecast Period | 2026-2032 |
| Chemoinformatics Market Size 2025 | USD 4,453 million |
| Chemoinformatics Market, CAGR | 4.3% |
| Chemoinformatics Market Size 2032 | USD 5,979 million |
Key Market Trends & Insights
- Chemoinformatics Market is projected to increase from USD 4,453 million (2025) to USD 5,979 million (2032) at a 4.3% CAGR (2025–2032).
- North America represented 33.8% of Chemoinformatics Market revenue in 2025, reflecting strong concentration of discovery programs and platform spending.
- Asia Pacific accounted for 26.7% share in 2025, supported by expanding R&D capacity and increased digitalization of discovery workflows.
- Software contributed 39.2% of Chemoinformatics Market revenue in 2025, driven by platformization of modeling, search, and decision-support tools.
- Drug Discovery & Validation held 46.1% share in 2025, reflecting heavy reliance on virtual workflows to accelerate design–make–test–analyze cycles.
Segment Analysis
Chemoinformatics Market demand is anchored in the need to manage expanding chemical data volumes and convert experimental outputs into actionable discovery decisions. Chemoinformatics Market buying criteria increasingly emphasize end-to-end workflow fit, integration with ELN/LIMS and analytics layers, and governance for model usage across teams. Chemoinformatics Market adoption also benefits from cloud deployment options that scale compute for virtual screening and model training without requiring large on-premise infrastructure. Chemoinformatics Market competition is therefore shaped by platform breadth, data interoperability, and usability that reduces friction for both computational specialists and bench scientists.
Chemoinformatics Market expansion is further supported by growing reliance on predictive approaches for property optimization, safety de-risking, and synthesis planning. Chemoinformatics Market users increasingly prefer solutions that combine curated databases, structure handling, QSAR/ML pipelines, docking, and reporting within consistent environments. Chemoinformatics Market service needs rise in parallel as organizations seek implementation support, model customization, validation, and data curation to improve decision quality. Chemoinformatics Market purchasing behavior also reflects a shift toward multi-year enterprise contracts that reduce vendor sprawl and standardize discovery processes.
By Product Insights
Software accounted for the largest share of 39.2% in 2025. Software leadership is supported by the central role of chemical structure representation, searching, modeling, and prediction in daily discovery execution. Software platforms also lead because integrated modules reduce workflow fragmentation across data management, visualization, and screening pipelines. Software adoption is reinforced by cloud delivery and scalable compute access that improves throughput for virtual screening and model iteration. Software differentiation increasingly depends on enterprise integration, governance, and cross-team collaboration features.
By Application Insights
Drug Discovery & Validation accounted for the largest share of 46.1% in 2025. Drug Discovery & Validation dominance is driven by the need to triage large chemical spaces and prioritize candidates before synthesis and wet-lab confirmation. Drug Discovery & Validation workflows also benefit from AI-enabled prediction and ranking that improves iteration speed and supports portfolio-scale decision-making. Drug Discovery & Validation adoption increases when chemoinformatics outputs are tightly linked to assay readouts and experimental design. Drug Discovery & Validation spending is further sustained by pressure to reduce cycle times and improve probability of technical success.
By End User Insights
Pharmaceutical Companies accounted for the largest share of 34.6% in 2025. Pharmaceutical Companies lead due to large discovery portfolios that require standardized platforms for structure analytics, modeling, and decision governance across multiple programs. Pharmaceutical Companies also invest heavily in integrating chemoinformatics with enterprise data layers to improve traceability and reproducibility of computational results. Pharmaceutical Companies adoption is strengthened by the need to coordinate internal teams with external partners, including CROs and specialized platform providers. Pharmaceutical Companies preference increasingly favors scalable platforms that support both computational experts and bench users without workflow disruption.
Chemoinformatics Market Drivers
Rising pressure to shorten discovery cycle times
Chemoinformatics Market growth is propelled by the need to compress discovery timelines and reduce the number of low-quality candidates entering expensive experimental stages. Chemoinformatics Market platforms help prioritize compounds earlier through structure-based modeling, predictive analytics, and rapid similarity searching. Chemoinformatics Market workflows improve iteration speed by enabling faster hypothesis testing and tighter alignment between design and synthesis planning. Chemoinformatics Market value increases when outputs connect directly to project decision gates and portfolio governance.
Expansion of chemical and biological data volumes
Chemoinformatics Market demand rises as chemical space exploration expands and organizations manage larger datasets across assay outputs, compound libraries, and synthesis histories. Chemoinformatics Market tools provide standardized structure handling, indexing, and visualization that improve data quality and reuse. Chemoinformatics Market adoption is reinforced by requirements for searchable knowledge bases that preserve project learnings across teams and time. Chemoinformatics Market platforms that support interoperability typically gain advantage as data sources diversify.
- For instance, Dotmatics reported that a global chemicals and materials company using Luma and Luma Lab Connect cut analysis turnaround time by up to 80% for application teams and by 10% for test teams, while standardizing outputs and contextual metadata for broader reuse.
Growth of AI-enabled molecular design and prediction
Chemoinformatics Market adoption increases as AI/ML methods become more embedded in medicinal chemistry and materials discovery workflows. Chemoinformatics Market solutions that integrate model development, training pipelines, interpretability, and deployment into governed environments reduce operational barriers. Chemoinformatics Market users seek stronger model performance, reproducibility, and workflow integration rather than isolated algorithms. Chemoinformatics Market spending is supported when AI capabilities demonstrate measurable gains in candidate prioritization and reduced experimental burden.
- For instance, Schrödinger reported that its platform triaged 8.2 billion compounds, synthesized only 78 molecules, and identified development candidate SGR-1505 in about 10 months, versus the three to six years and up to 5,000 synthesized molecules often associated with traditional programs.
Increasing enterprise integration and collaboration requirements
Chemoinformatics Market expansion is supported by broader enterprise needs for collaboration across distributed research groups, partner ecosystems, and outsourced R&D models. Chemoinformatics Market platforms that connect with ELN/LIMS, analytics environments, and data warehouses improve continuity across the R&D lifecycle. Chemoinformatics Market buyers favor standardized environments that reduce vendor sprawl and simplify onboarding and training. Chemoinformatics Market value grows when platforms enable controlled sharing, access management, and auditability.
Chemoinformatics Market Challenges
Chemoinformatics Market adoption can be constrained by data quality limitations, inconsistent structure representations, and fragmented data ownership across organizations. Chemoinformatics Market performance depends on clean, standardized inputs, yet many R&D environments include legacy systems that hinder harmonization. Chemoinformatics Market implementations can also face change-management friction when workflows shift for bench scientists and computational teams. Chemoinformatics Market procurement may slow when integration and migration complexity is underestimated.
- For instance, Chemaxon highlights that its cHemTS structure-based classification engine delivers over 99% accuracy on roughly 50,000 Chapter 29 CN chemical codes, showing how strong performance in chemoinformatics depends on highly standardized structure handling and curated rule-based chemical data foundations.
Chemoinformatics Market expansion also faces challenges related to model governance, reproducibility, and trust in AI-derived outputs across regulated discovery decision-making. Chemoinformatics Market users frequently require validation, documentation, and transparent performance monitoring to support cross-team confidence. Chemoinformatics Market vendors must also address interoperability expectations to avoid lock-in concerns. Chemoinformatics Market competitiveness can therefore depend on implementation support and a clear path to scalable enterprise adoption.
Chemoinformatics Market Trends and Opportunities
Chemoinformatics Market opportunity is rising in unified “chemistry-to-decision” platforms that combine curated data assets, modeling, screening, and reporting under common governance. Chemoinformatics Market buyers increasingly prioritize suite integration over point solutions to reduce operational complexity. Chemoinformatics Market growth is supported by cloud-first deployments that enable elastic compute for screening and AI workloads. Chemoinformatics Market vendors that deliver smoother integration and lower time-to-value can expand footprint within large R&D organizations.
- For instance, Revvity Signals reported that SK Life Science Labs used Signals Notebook to accelerate CRO processes from days to minutes, while also automating inventory tracking across internal and external teams, demonstrating how integrated cloud-based environments can materially reduce coordination friction and speed decision workflows.
Chemoinformatics Market trends also include increased focus on retrosynthesis, route planning, and synthesis feasibility scoring integrated into everyday workflows. Chemoinformatics Market users benefit when platforms connect design recommendations to practical chemistry execution constraints. Chemoinformatics Market services demand is also expanding for model customization, workflow implementation, and data curation that improve downstream decision utility. Chemoinformatics Market opportunity is particularly strong where organizations seek faster iteration with more consistent governance across teams.
Regional Insights
North America
North America represented 33.8% of Chemoinformatics Market revenue in 2025. North America demand is supported by concentration of discovery programs, advanced computational adoption, and mature enterprise software procurement. North America buying behavior favors integrated platforms that connect modeling, data management, and analytics into standardized workflows. North America competition is intense due to high expectations for integration, governance, and measurable productivity gains.
Europe
Europe accounted for 23.9% of Chemoinformatics Market revenue in 2025. Europe adoption is supported by strong academic research output, established pharmaceutical clusters, and collaborative research networks. Europe purchasing preferences emphasize interoperability, data governance, and multi-site collaboration across research organizations. Europe demand also benefits from continued investment in digital R&D infrastructure and discovery modernization.
Asia Pacific
Asia Pacific held 26.7% share of Chemoinformatics Market revenue in 2025. Asia Pacific growth is reinforced by expanding R&D capacity, increasing digitization of discovery processes, and rising participation in global partner ecosystems. Asia Pacific adoption typically accelerates when platforms support scalable compute, localized workflows, and smoother enterprise onboarding. Asia Pacific also shows strong uptake of AI-enabled capabilities that improve prioritization and reduce experimental burden.
Latin America
Latin America represented 9.1% of Chemoinformatics Market revenue in 2025. Latin America demand is supported by gradual expansion of regional R&D capabilities and increasing integration with global discovery outsourcing and academic collaborations. Latin America adoption strengthens when cloud delivery reduces infrastructure barriers and improves access to advanced modeling and screening tools. Latin America opportunities are strongest where institutions prioritize standardized data handling and training to improve workflow consistency.
Middle East & Africa
Middle East & Africa accounted for 6.5% of Chemoinformatics Market revenue in 2025. Middle East & Africa growth is supported by selective investment in research infrastructure and partnerships that expand computational capabilities in priority therapeutic and materials areas. Middle East & Africa adoption improves when vendors provide implementation support and scalable delivery models suited to developing ecosystems. Middle East & Africa opportunities are tied to building consistent data governance and workforce capability alongside platform deployment.
Competitive Landscape
Chemoinformatics Market competition is shaped by the breadth of platform functionality, quality of chemical data assets, and ability to integrate into enterprise research environments. Chemoinformatics Market vendors differentiate through workflow coverage across modeling, search, virtual screening, visualization, and collaboration, alongside implementation and support capabilities. Chemoinformatics Market buyers increasingly prefer consolidated platforms that reduce vendor sprawl and improve governance. Chemoinformatics Market differentiation also depends on usability that supports both computational experts and bench scientists.
Schrödinger, Inc. typically positions offerings around computational chemistry and physics-based modeling to support virtual screening, lead optimization, and decision support within discovery programs. Schrödinger, Inc. emphasis often centers on workflow depth, model performance, and integration that improves iteration speed for design–make–test–analyze cycles. Schrödinger, Inc. adoption tends to strengthen where organizations seek scalable computational capability aligned to medicinal chemistry execution. Schrödinger, Inc. competitiveness is reinforced when platform deployment is paired with services and collaboration models that support enterprise adoption.
The industry research and growth report includes detailed analyses of the competitive landscape of the market and information about key companies, including:
- Schrödinger, Inc.
- Dassault Systèmes (BIOVIA)
- ChemAxon Ltd.
- Dotmatics
- OpenEye Scientific Software (Cadence)
- Optibrium
- Revvity Signals Software
- Elsevier
- BioSolveIT GmbH
- MolSoft LLC
- Thermo Fisher Scientific
- Agilent Technologies
- Jubilant Biosys
Qualitative and quantitative analysis of companies has been conducted to help clients understand the wider business environment as well as the strengths and weaknesses of key industry players. Data is qualitatively analyzed to categorize companies as pure play, category-focused, industry-focused, and diversified; it is quantitatively analyzed to categorize companies as dominant, leading, strong, tentative, and weak.
Recent Developments
- In March 2026, Schrödinger, Inc. launched its 2026-1 software release, introducing enhanced atomic-scale materials analysis and design capabilities with automated analysis workflows for thermochemistry of point defects in crystalline materials and refined machine learning solutions for materials formulations.
- In January 2026, Schrödinger, Inc. also entered into a multi-year strategic agreement with Manas AI, a full-stack AI-native drug discovery company founded by Reid Hoffman and Siddhartha Mukherjee. This partnership grants Manas AI deep, large-scale access to Schrödinger's physics-based computational molecular discovery platform, along with priority collaboration with Schrödinger's scientific and technical teams to integrate physics-based modeling with Manas AI's machine learning algorithms for improved predictive accuracy across small molecule and biologic programs.
- In July 2024, Certara, Inc. completed its acquisition of Chemaxon, a leading provider of cheminformatics software for chemical structure drawing, property prediction, search, and analysis.
Report Scope
| Report Attribute | Details |
| Market size value in 2025 | USD 4453 million |
| Revenue forecast in 2032 | USD 5979 million |
| Growth rate (CAGR) | 4.3% (2025–2032) |
| Base year | 2025 |
| Forecast period | 2026-2032 |
| Quantitative units | USD million |
| Segments covered | By Product Outlook: Software, Services, Others; By Application Outlook: Chemical Analysis, Drug Discovery & Validation, Virtual Screening, Other Applications; By End User Outlook: Academic Institutions, Biotechnology Companies, Chemical Companies, Contract Research Organizations, Pharmaceutical Companies |
| Regional scope | North America, Europe, Asia Pacific, Latin America, Middle East & Africa |
| Key companies profiled | Schrödinger, Inc.; Dassault Systèmes (BIOVIA); ChemAxon Ltd.; Dotmatics; OpenEye Scientific Software (Cadence); Optibrium; Revvity Signals Software; Elsevier; BioSolveIT GmbH; MolSoft LLC; Thermo Fisher Scientific; Agilent Technologies; Jubilant Biosys |
| No. of Pages | 337 |
Segmentation
By Product
- Software
- Services
- Others
By Application
- Chemical Analysis
- Drug Discovery & Validation
- Virtual Screening
- Other Applications
By End User
- Academic Institutions
- Biotechnology Companies
- Chemical Companies
- Contract Research Organizations
- Pharmaceutical Companies
By Region
- North America
- U.S.
- Canada
- Mexico
- Europe
- Germany
- France
- U.K.
- Italy
- Spain
- Rest of Europe
- Asia Pacific
- China
- Japan
- India
- South Korea
- South-east Asia
- Rest of Asia Pacific
- Latin America
- Brazil
- Argentina
- Rest of Latin America
- Middle East & Africa
- GCC Countries
- South Africa
- Rest of the Middle East and Africa
Request a Free Sample
Fill in your details and we'll send you a free sample report.
- Sample data tables & charts
- Research methodology
Need a Custom Version of This Report?
Tailor the scope, geography, or segments to your exact requirements.
- Custom geography or segment scope
- Direct access to our analyst team
Frequently Asked Questions
What is the market size and forecast for Chemoinformatics Market?
What is the CAGR for Chemoinformatics Market during 2025–2032?
Which is the largest segment in Chemoinformatics Market?
What factors are driving Chemoinformatics Market growth?
Who are the leading companies in Chemoinformatics Market?
Which region leads Chemoinformatics Market?
Table of Content
Chapter 1. Report Introduction
- 1.1 Report Description & Purpose
- 1.1.1 Report Title & Market Definition
- 1.1.2 Unique Selling Propositions (USP) & Key Differentiators
- 1.1.3 Value Proposition for Stakeholders
- 1.2 Research Objectives
- 1.2.1 Market Sizing Objectives (Volume & Revenue)
- 1.2.2 Segmentation Objectives
- 1.2.3 Competitive Intelligence Objectives
- 1.2.4 Forecast & Scenario Objectives
- 1.3 Report Scope
- 1.3.1 Chemoinformatics Scope – Types & Subtypes Covered
- 1.3.2 Geographic Scope – Regions & Countries Covered
- 1.3.3 Historical Period, Base Year & Forecast Period (2025; forecast to 2032)
- 1.3.4 Inclusions & Exclusions
- 1.4 HS Code & Classification Framework
- 1.5 Currency, Units & Pricing Basis
- 1.6 Target Stakeholders
- 1.7 Limitations & Assumptions
Chapter 2. Executive Summary
- 2.1 Global Chemoinformatics Market Snapshot
- 2.1.1 Market Size – Historical (2025) & Forecast (2025-2032) (2025: USD 4,453 million → 2032: USD 5,979 million)
- 2.1.2 Volume & Revenue – Global Totals
- 2.1.3 Key Market Highlights – Top Five Facts
- 2.2 Chemoinformatics Market Segmentation Snapshot
- 2.2.1 Market Split by Region – 2025 vs. 2032
- 2.3 Competitive Snapshot
- 2.3.1 Top 10 Players by Revenue Share – 2025
- 2.3.2 Top 10 Players by Volume Share – 2025
- 2.3.3 Recent Strategic Developments (18-Month Summary)
- 2.4 Key Investment Highlights & Strategic Conclusions
Chapter 3. Chemoinformatics Market Dynamics & Industry Analysis
- 3.1 Market Overview & Context
- 3.1.1 Chemoinformatics Market Position in the Broader Automotive Value Chain
- 3.1.2 OEM vs. Replacement Market Dynamics
- 3.1.3 Market Maturity & Development Stage by Region
- 3.2 Chemoinformatics Market Drivers
- 3.3 Chemoinformatics Market Restraints & Challenges
- 3.4 Chemoinformatics Market Opportunities
- 3.5 Porter's Five Forces Analysis
- 3.5.1 Threat of New Entrants
- 3.5.2 Bargaining Power of Suppliers
- 3.5.3 Bargaining Power of Buyers
- 3.5.4 Threat of Substitutes
- 3.5.5 Competitive Rivalry – Intensity Assessment
- 3.6 Chemoinformatics Value Chain Analysis
- 3.6.1 Upstream – Raw Material/Input Suppliers
- 3.6.1.1 Raw Material/Input 1
- 3.6.1.2 Raw Material/Input 2
- 3.6.1.3 Raw Material/Input 3
- 3.6.2 Midstream – Production/Manufacturing/Service Delivery
- 3.6.2.1 Production/Process Overview
- 3.6.2.2 Key Facility Locations & Capacity by Manufacturer
- 3.6.3 Downstream – Distribution & End Consumer
- 3.6.3.1 Primary Channel – B2B/OEM
- 3.6.3.2 Secondary Channels – Dealer, Retail, Online, Direct
- 3.6.4 Value Chain Profitability Analysis
- 3.6.1 Upstream – Raw Material/Input Suppliers
- 3.7 PESTEL Analysis
- 3.7.1 Political Factors
- 3.7.2 Economic Factors
- 3.7.3 Social Factors
- 3.7.4 Technological Factors
- 3.7.5 Environmental Factors
- 3.7.6 Legal Factors
- 3.8 Chemoinformatics Supply Chain Analysis
- 3.8.1 Raw Material/Input Supply Risk Assessment
- 3.8.2 Manufacturing Concentration Risk (Geographic Exposure)
- 3.8.3 Trade Disruption Impact Analysis
- 3.9 Regulatory & Policy Landscape
Note: The regulatory and policy landscape section covers regulations based on their applicability to the market, Chemoinformatics category, geography, and scope of the study. Only regulatory frameworks with a material impact on operations, compliance, trade, sustainability, or market access are analyzed in detail.
Chapter 4. Key Investment Pockets & Opportunity Analysis
- 4.1 Chemoinformatics Market Attractiveness Analysis
- 4.1.1 By Region – Investment Attractiveness Matrix (Volume × CAGR)
- 4.2 Absolute Revenue Growth Opportunity
- 4.2.1 By Region – Absolute USD Growth Through 2032
- 4.3 Incremental Volume Opportunity
- 4.3.1 By Region – Incremental Volume Through 2032
- 4.3.2 Segment – Incremental Volume
- 4.4 Emerging Submarket Opportunity Deep Dive (Subject to Applicability)
- 4.5 Emerging Market Opportunity Scorecards
- 4.5.1 United States
- 4.5.2 Europe
- 4.5.3 Asia
- 4.5.4 Middle East & Africa
Note: Emerging Market Opportunity Scorecards will be included based on relevance and strategic importance. Regions listed are indicative and may vary depending on data availability and market dynamics.
Chapter 5. Chemoinformatics Import-Export Analysis & Trade Flows
- 5.1 Global Trade Overview
- 5.1.1 Global Export Value by Country (2025)
- 5.1.2 Global Export Volume by Country (2025)
- 5.1.3 Global Import Value by Country (2025)
- 5.1.4 Global Import Volume by Country (2025)
- 5.1.5 Net Trade Balance by Country (2025)
- 5.2 Export Analysis – Segment
- 5.2.1 Type 1 (HS Code)
- 5.2.2 Type 2 (HS Code)
- 5.2.3 Type 3 (HS Code)
- 5.2.4 Type 4 (HS Code)
- 5.2.5 Type 5 (HS Code)
- 5.3 Import Analysis – Segment
- 5.3.1 Type 1 (HS Code)
- 5.3.2 Type 2 (HS Code)
- 5.3.3 Type 3 (HS Code)
- 5.3.4 Type 4 (HS Code)
- 5.3.5 Type 5 (HS Code)
- 5.4 Average Unit Trade Prices
- 5.4.1 Average Export Price – Segment & Country
- 5.4.2 Average Import Price – Segment & Source Country
- 5.4.3 Price Trends (2025)
- 5.5 Key Trade Route Analysis
- 5.5.1 Trade Route 1
- 5.5.2 Trade Route 2
- 5.5.3 Trade Route 3
- 5.5.4 Trade Route 4
- 5.5.5 Trade Route 5
- 5.6 Trade Policy Impact Assessment
- 5.6.1 US Anti-Dumping & Section 301 Tariffs
- 5.6.2 EU Customs Union Impact
- 5.6.3 Major Free Trade Agreements
- 5.6.4 USMCA Rules of Origin
Note: Trade policy analysis will be included only where relevant to the Chemoinformatics market.
Chapter 6. Competitive Landscape & Company Benchmarking
- 6.1 Chemoinformatics Market Concentration & Structure
- 6.1.1 Herfindahl-Hirschman Index (HHI) – vs. 2025
- 6.1.2 Tier 1, Tier 2 & Tier 3 Market Structure
- 6.1.3 Global, Regional & Local Player Dynamics
- 6.2 Chemoinformatics Market Share Analysis – 2025
- 6.2.1 Global Revenue Share by Company
- 6.2.2 Global Volume Share by Company
- 6.2.3 Regional Revenue Share
- 6.2.4 Market Share Evolution ( vs. 2025)
- 6.2.5 OEM Segment Share by Company
- 6.2.6 Replacement Segment Share by Company
- 6.3 Production/Delivery Capacity & Facility Analysis
- 6.3.1 Global Installed Capacity
- 6.3.2 Capacity Utilization Rates
- 6.3.3 Production/Output Volume
- 6.3.4 Facility Locations & Capacity Map
- 6.3.5 Planned Capacity Additions
- 6.4 Chemoinformatics Competitive Benchmarking Matrix
- 6.4.1 Revenue, Volume, CAGR & Profitability Comparison
- 6.4.2 Channel Revenue Mix
- 6.4.3 Geographic Revenue Exposure
- 6.4.4 R&D Intensity
- 6.4.5 Sustainability Maturity
- 6.5 Strategic Developments in Chemoinformatics (Last 24 Months)
- 6.5.1 Mergers, Acquisitions & Divestments
- 6.5.2 New Chemoinformatics Launches
- 6.5.3 Facility Expansions
- 6.5.4 Strategic Alliances, Joint Ventures & Partnerships
- 6.5.5 Distribution Expansion & Market Entry
- 6.5.6 Sustainability & ESG Initiatives
- 6.6 Competitive Strategy Mapping
- 6.6.1 Leader, Challenger, Follower & Niche Classification
- 6.6.2 Pricing Strategy Comparison
- 6.6.3 Channel Strategy Matrix
Note: Strategic developments are included based on their materiality and the availability of reliable information.
Chapter 7. Global Chemoinformatics Market – By Distribution Channel
- 7.1 Segment Overview
- 7.1.1 Volume & Revenue Split by Channel (2025 & 2032)
- 7.1.2 Channel Mix Evolution (2025-2032)
Chapter 8. Regional Market Analysis – Global Overview
- 8.1 Global Regional Overview
- 8.1.1 Regional Volume Share
- 8.1.2 Regional Revenue Share
- 8.1.3 Regional Volume by Region
- 8.1.4 Regional Revenue by Region
- 8.1.5 Regional Forecast Through 2032
- 8.2 Cross-Regional Segment Analysis
- 8.2.1 By Distribution Channel
- 8.2.2 By Brand/Price Tier
Chapter 9. North America Chemoinformatics Market
- 9.1 United States
- 9.2 Canada
- 9.3 Mexico
Chapter 10. Europe Chemoinformatics Market
- 10.1 Germany
- 10.2 France
- 10.3 Italy
- 10.4 United Kingdom
- 10.5 Spain
- 10.6 Poland
- 10.7 Russia
- 10.8 Netherlands
- 10.9 Belgium
- 10.10 Sweden
- 10.11 Denmark
- 10.12 Norway
- 10.13 Rest of Europe
Chapter 11. Asia Pacific Chemoinformatics Market
- 11.1 China
- 11.2 India
- 11.3 Japan
- 11.4 South Korea
- 11.5 Thailand
- 11.6 Indonesia
- 11.7 Vietnam
- 11.8 Malaysia
- 11.9 Australia
- 11.10 Rest of Asia Pacific
Chapter 12. Latin America Chemoinformatics Market
- 12.1 Brazil
- 12.2 Argentina
- 12.3 Colombia
- 12.4 Chile
- 12.5 Rest of Latin America
Chapter 13. Middle East Chemoinformatics Market
- 13.1 Saudi Arabia
- 13.2 United Arab Emirates
- 13.3 Turkey
- 13.4 Israel
- 13.5 Iran
- 13.6 Rest of the Middle East
Chapter 14. Africa Chemoinformatics Market
- 14.1 South Africa
- 14.2 Egypt
- 14.3 Nigeria
- 14.4 Morocco
- 14.5 Rest of Africa
Chapter 15. Chemoinformatics Company Profiles
- 15.1 [Company 01]
- 15.1.1 Company Overview
- 15.1.2 Key Management Personnel
- 15.1.3 Products & Services Portfolio
- 15.1.4 Financial Performance
- 15.1.5 Key Market Focus & Geographic Presence
- 15.1.6 Recent Developments & Strategic Initiatives
Note: The company profile list is preliminary and may change based on research findings, market developments, data availability, and client requirements.
Chapter 16. Appendices
- Appendix A – List of Abbreviations & Acronyms
- Appendix B – Industry Classification Code Reference – Full Series
- Appendix C – Production & Capacity Data Tables
- Appendix D – End-Use & Demand Base Tables
- Appendix E – Consumption & Replacement Rate Assumptions
- Appendix F – ASP Reference Tables
- Appendix G – Manufacturing & Facility Database
- Appendix H – Import-Export Data Tables
- Appendix I – Regulatory Summary Tables
- Appendix J – Primary Research Participant List (Anonymized)
- Appendix K – Primary Research Questionnaire Framework
- Appendix L – Data Sources & Bibliography
- Appendix M – Market Size Divergence & Source Comparison
Chapter 17. Research Methodology
- 17.1 Research Framework & Philosophy
- 17.2 Secondary Research – Sources, Hierarchy & Data Extraction
- 17.3 Data Modeling – Bottom-Up & Top-Down Market Sizing
- 17.4 Primary Research – Stakeholder Framework, LOI & Sample Sizes
- 17.5 Forecast Methodology – Regression, Scenario & Sensitivity Analysis
- 17.6 Quality Control – Four-Layer Validation Framework
- 17.7 Limitations & Standard Assumptions
- 17.8 Disclaimer
