
Market Overview
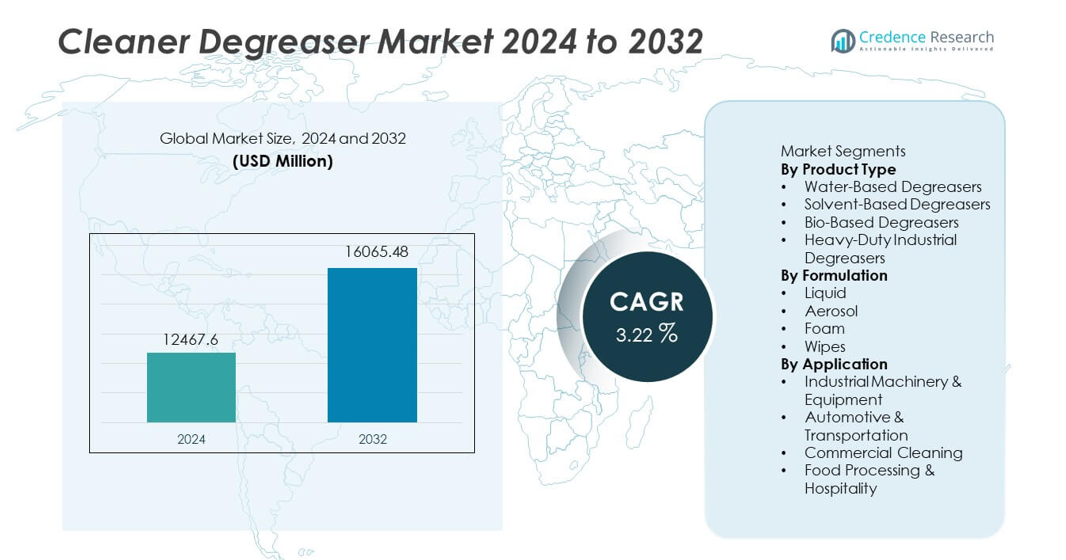
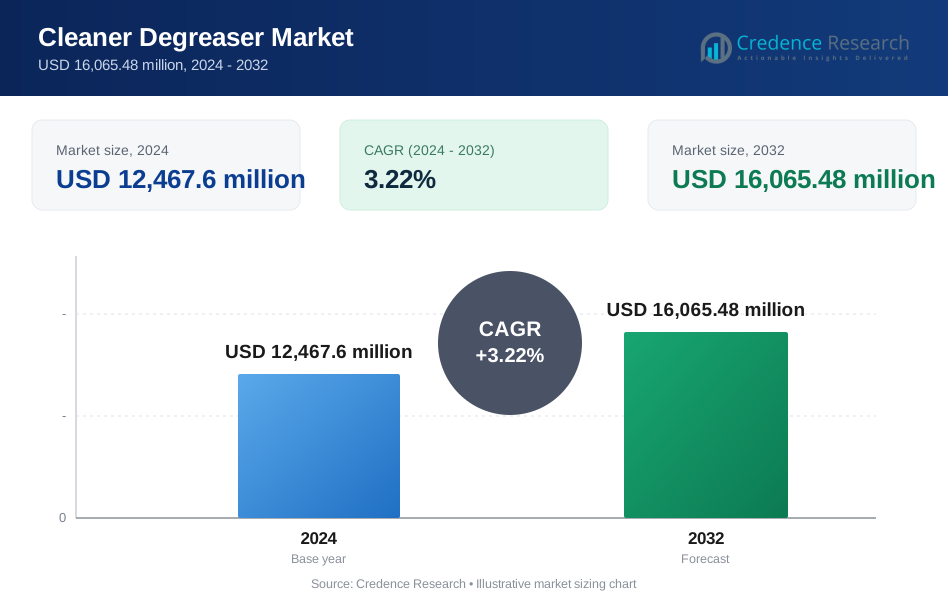
The Cleaner Degreaser market reached USD 12,467.6 million in 2024 and is projected to reach USD 16,065.48 million by 2032, growing at a CAGR of 3.22% during the forecast period.
| REPORT ATTRIBUTE | DETAILS |
|---|---|
| Historical Period | 2020-2023 |
| Base Year | 2024 |
| Forecast Period | 2025-2032 |
| Cleaner Degreaser Market Size 2024 | USD 12,467.6 million |
| Cleaner Degreaser Market , CAGR | 3.22% |
| Cleaner Degreaser Market Size 2032 | USD 16,065.48 million |
The Cleaner Degreaser market is driven by major players such as 3M, Zep Inc., WD-40 Company, Simple Green, BASF SE, Evonik Industries, Henkel AG, Clorox Company, Rust-Oleum, and Reckitt Benckiser, all of which focus on developing high-performance, eco-friendly, and regulatory-compliant cleaning solutions for industrial, automotive, and commercial use. These companies strengthen their position through product innovation, wider distribution networks, and expansion into bio-based and water-based formulations. Asia Pacific leads the market with a 34% share, followed by North America at 32% and Europe at 28%, driven by strong industrial activity, rising hygiene standards, and increasing adoption of sustainable cleaning technologies.
Market Insights
- The Cleaner Degreaser market reached USD 12,467.6 million in 2024 and will reach USD 16,065.48 million by 2032 at a CAGR of 3.22%, supported by rising demand across industrial and commercial sectors.
- Strong growth comes from industrial maintenance needs, with Water-Based Degreasers holding 42% share as companies prioritize safer, eco-friendly cleaning solutions under stricter regulatory standards.
- Key trends include wider adoption of biodegradable, low-VOC formulations and increased use of precision cleaning technologies driven by automation and high-performance manufacturing requirements.
- Competitive intensity rises as 3M, Zep, WD-40 Company, Henkel, and BASF expand product portfolios and invest in sustainable chemistries, while price-sensitive markets challenge premium players.
- Asia Pacific leads with 34% share, followed by North America at 32% and Europe at 28%, supported by expanding industrial bases, growing hygiene awareness, and rising regulatory focus on safe cleaning practices.
Market Segmentation Analysis:
By Product Type
Water-Based Degreasers lead the Cleaner Degreaser market with a 42% share, driven by strong demand for safer, non-flammable, and eco-friendly cleaning solutions across industrial and commercial environments. These formulations meet rising regulatory standards and reduce exposure to harmful chemicals, making them preferred in manufacturing, automotive, and food processing facilities. Solvent-Based Degreasers maintain demand in heavy-duty applications where fast evaporation and strong grease-cutting performance are required. Bio-Based Degreasers grow steadily as sustainability initiatives expand. Heavy-Duty Industrial Degreasers remain essential for machinery maintenance, but safety and compliance trends keep Water-Based formulations dominant.
- For instance, 3M offers a water-based cleaning portfolio with solutions formulated for performance across various common industrial materials, including metals, plastics, and composite materials, ensuring broad compatibility in plant operations.
By Formulation
Liquid formulations dominate the market with a 56% share, supported by their versatility, ease of application, and strong cleaning efficiency across metal surfaces, machinery parts, and automotive components. Liquids are widely used in industrial workshops and maintenance operations, driving consistent demand. Aerosol formats also perform well due to their convenience and controlled spray application for hard-to-reach areas. Foam formulations gain traction in vertical surfaces and food-safe environments where cling and reduced runoff are important. Wipes expand usage in commercial cleaning and quick-service applications. The broad functional range of liquids keeps them the primary choice across major industries.
- For instance, WD-40 Company engineered its Smart Straw delivery system to deliver a narrow stream for precision application or a wide spray for area coverage into hard-to-reach spaces and confined mechanical joints.
By Application
Industrial Machinery & Equipment holds a 41% share, driven by ongoing maintenance requirements in manufacturing plants, metalworking facilities, and heavy-duty workshops. Degreasers help remove oils, lubricants, and residues that affect machine efficiency and safety, making them essential in routine operations. Automotive & Transportation follows closely as vehicle repair, detailing, and fleet maintenance rely on strong degreasing performance. Commercial Cleaning grows steadily with rising hygiene standards in offices, retail, and public facilities. Food Processing & Hospitality adopt degreasers for strict sanitation compliance. Industrial demand remains highest due to constant equipment wear, residue buildup, and operational intensity.
Key Growth Drivers
Increasing Demand for Eco-Friendly and Water-Based Solutions
Growing awareness of workplace safety and environmental protection drives strong demand for water-based and biodegradable cleaner degreasers. Industries shift away from harsh solvents to comply with regulatory standards governing VOC emissions and hazardous chemicals. Manufacturers develop low-toxicity formulations that deliver strong cleaning performance while reducing employee exposure risks. Rising adoption across automotive workshops, food processing units, and manufacturing plants supports market expansion. This shift toward safer, greener chemistry remains a major force shaping product development and purchasing decisions.
- For instance, Evonik Industries introduced a biodegradable surfactant system whose primary component showed a 96-hour LC50 value above 100 mg/L in aquatic toxicity testing, confirming low environmental impact and suitability for eco-friendly degreasers.
Expansion of Industrial and Automotive Maintenance Activities
Rising industrial output and continuous machinery operation increase the need for routine degreasing to prevent equipment wear, overheating, and breakdowns. Automotive repair centers and fleet maintenance operations depend on strong degreasers for engines, components, and metal surfaces. Growth in logistics, transportation, and manufacturing further boosts usage frequency. Companies prioritize efficient cleaning processes to reduce downtime and improve operational reliability. As industries modernize and expand capacity, demand for high-performance cleaner degreasers increases steadily.
- For instance, Henkel AG validates its industrial degreaser efficiency through rigorous product testing and customer case studies on various steel components, demonstrating effective performance within automated wash systems.
Growth in Commercial Cleaning and Hygiene Standards
Higher sanitation expectations across commercial facilities, hospitality, and retail sectors strengthen demand for multipurpose degreasing solutions. Businesses adopt efficient cleaners to maintain hygiene, remove residue, and support safety compliance. Increased focus on visible cleanliness in kitchens, food service areas, and equipment surfaces drives steady usage. Degreasers with faster action and broad material compatibility gain preference as service providers seek productivity improvements. Rising facility management services and contract cleaning operations contribute to consistent market growth.
Key Trends & Opportunities
Shift Toward Bio-Based and Non-Toxic Formulations
Consumers and industries show growing interest in plant-derived and non-hazardous degreasers that reduce environmental impact without compromising effectiveness. Manufacturers invest in renewable raw materials and advanced surfactant technologies to improve biodegradability and safety. This trend creates opportunities for brands offering certified green products that appeal to health-sensitive and sustainability-focused markets. Bio-based degreasers gain traction in food processing, hospitality, and residential applications, where chemical exposure is a key concern. Continued regulatory pressure supports long-term adoption.
- For instance, BASF SE developed an alkyl polyglucoside surfactant derived from 100% renewable glucose and fatty alcohol, validated through OECD 301F testing to biodegrade fully within 28 days, making it suitable for non-toxic degreaser formulations.
Rising Automation and Use of Precision Cleaning Solutions
Automation in manufacturing and maintenance increases demand for degreasers that work efficiently with automated cleaning systems, ultrasonic cleaners, and spray-wash equipment. Industries seek formulations that leave minimal residue and support consistent performance across advanced machinery. This creates opportunities for specialized high-purity and low-foaming degreasers tailored to automated workflows. As precision engineering, electronics, and high-tech manufacturing expand, demand for controlled-performance degreasers with enhanced material compatibility grows significantly.
- For instance, Branson Ultrasonics (Emerson Electric Co.) provides equipment that helps improve cleaning throughput by processing metal parts in an ultrasonic tank using an industrial degreaser or aqueous solutions, often utilizing automated systems to boost efficiency and consistency.
Key Challenges
Stringent Environmental and Chemical Safety Regulations
Manufacturers must comply with strict rules governing VOC levels, chemical toxicity, and environmental impact, increasing reformulation costs and compliance burden. Solvent-based degreasers face pressure due to hazardous air pollutant restrictions. Regulatory variation across regions complicates product standardization and distribution. Companies must balance performance with sustainability expectations, making innovation more resource-intensive. These regulatory hurdles slow adoption of certain formulations and require ongoing investment.
Price Sensitivity and Competition from Low-Cost Alternatives
The market faces strong competition from low-cost generic degreasers, particularly in regions with limited regulatory enforcement. Price-sensitive industrial users may choose cheaper formulations despite lower safety or environmental performance. Premium eco-friendly or high-tech degreasers often struggle to justify their higher price points. Manufacturers must differentiate through performance, safety, and long-term cost benefits to compete effectively. High competition pressures margins and limits rapid adoption of advanced formulations.
Regional Analysis
North America
North America holds a 32% share of the Cleaner Degreaser market, supported by strong demand across industrial maintenance, automotive services, and commercial cleaning sectors. The region adopts high-performance and eco-friendly formulations driven by strict environmental regulations and workplace safety standards. Industrial facilities prioritize water-based and low-VOC degreasers to meet compliance requirements. The U.S. leads due to large-scale manufacturing, automotive repair networks, and strong facility management services. Rising demand for biodegradable and non-toxic products further drives innovation, keeping North America a key market for advanced cleaning solutions.
Europe
Europe accounts for a 28% share, driven by stringent chemical safety regulations and high adoption of sustainable cleaning solutions across industrial and commercial environments. Manufacturers shift toward biodegradable, solvent-free, and low-emission degreasers to comply with REACH and other regulatory frameworks. Heavy machinery, automotive production, and food processing industries contribute significantly to demand. Countries such as Germany, France, and the U.K. lead growth through strong industrial bases and widespread use of automated cleaning technologies. Sustainability-focused purchasing behavior and corporate hygiene standards continue to support market expansion across the region.
Asia Pacific
Asia Pacific leads the market with a 34% share, fueled by rapid industrialization, strong manufacturing output, and expanding automotive and transportation sectors. China and India drive significant consumption as factories adopt degreasers for machinery upkeep, process cleaning, and metalworking applications. Growing food processing and commercial cleaning industries also contribute to rising demand. The region sees increasing adoption of cost-effective and water-based formulations as regulatory frameworks strengthen. Fast-growing industrial hubs and increasing awareness of workplace hygiene support sustained market momentum across Asia Pacific.
Latin America
Latin America holds a 4% share, supported by rising industrial activities and growing demand for cleaning solutions in automotive, food processing, and commercial sectors. Countries such as Brazil and Mexico lead adoption due to large industrial bases and expanding maintenance needs. Economic development and modernization of manufacturing facilities support increased use of cleaner degreasers. However, price sensitivity drives preference for lower-cost formulations. Gradual adoption of eco-friendly products is emerging as regulations strengthen, contributing to steady long-term market growth.
Middle East & Africa
The Middle East & Africa region accounts for a 3% share, driven by increasing industrial expansion in oil and gas, manufacturing, and transportation. Demand rises as facilities adopt degreasers for equipment maintenance and operational cleaning. Gulf countries lead adoption through strong industrial infrastructure and rising emphasis on workplace safety. Africa shows growing usage as industrialization progresses and hygiene awareness improves. Limited regulatory pressure slows the transition to eco-friendly formulations, but gradual modernization and investment in industrial sectors support steady market advancement.Market Segmentations:
By Product Type
- Water-Based Degreasers
- Solvent-Based Degreasers
- Bio-Based Degreasers
- Heavy-Duty Industrial Degreasers
By Formulation
- Liquid
- Aerosol
- Foam
- Wipes
By Application
- Industrial Machinery & Equipment
- Automotive & Transportation
- Commercial Cleaning
- Food Processing & Hospitality
By Geography
- North America
- U.S.
- Canada
- Mexico
- Europe
- Germany
- France
- U.K.
- Italy
- Spain
- Rest of Europe
- Asia Pacific
- China
- Japan
- India
- South Korea
- South-east Asia
- Rest of Asia Pacific
- Latin America
- Brazil
- Argentina
- Rest of Latin America
- Middle East & Africa
- GCC Countries
- South Africa
- Rest of the Middle East and Africa
Competitive Landscape
Competitive landscape features leading companies such as 3M, Zep Inc., WD-40 Company, Simple Green, BASF SE, Evonik Industries, Henkel AG, Clorox Company, Rust-Oleum, and Reckitt Benckiser. These players compete by expanding product portfolios, focusing on eco-friendly formulations, and developing high-performance degreasers for industrial, automotive, and commercial applications. Many companies invest in water-based, biodegradable, and low-VOC solutions to meet rising regulatory and sustainability requirements. Innovation in heavy-duty and fast-acting formulations strengthens differentiation, while strategic partnerships with industrial users enhance market penetration. Global brands leverage strong distribution networks, whereas regional manufacturers compete through cost-effective offerings and localized product customization. Growing demand for safer, non-toxic, and high-efficiency cleaning solutions continues to shape competitive strategies across the market.
Key Player Analysis
- 3M
- Zep Inc.
- WD-40 Company
- Simple Green (Sunshine Makers Inc.)
- BASF SE
- Evonik Industries
- Henkel AG
- Clorox Company
- Rust-Oleum
- Reckitt Benckiser
Recent Developments
- In September 2024, Zep, Inc. launched new Heavy-Duty Citrus Degreaser & Cleaner Mist and Industrial Purple Degreaser & Cleaner Mist, using Flairosol spray bottles that work upside-down for hard-to-reach areas.
- In June 2025, Zep Inc. introduced Cherry Bomb Auto+ Degreaser & Cleaner, a ready-to-use formula with cherry scent designed to remove oil, grease, and grime from vehicles, tools, and surfaces, available at Walmart and online.
- In 2023, WD-40 Company released WD-40 Specialist Degreaser and Cleaner EZ-Pods, a customizable concentrated formula that dissolves in water for adjustable degreasing strength on metals, plastics, and painted surfaces without residue or fumes.
Report Coverage
The research report offers an in-depth analysis based on Product Type, Formulation, Application and Geography. It details leading market players, providing an overview of their business, product offerings, investments, revenue streams, and key applications. Additionally, the report includes insights into the competitive environment, SWOT analysis, current market trends, as well as the primary drivers and constraints. Furthermore, it discusses various factors that have driven market expansion in recent years. The report also explores market dynamics, regulatory scenarios, and technological advancements that are shaping the industry. It assesses the impact of external factors and global economic changes on market growth. Lastly, it provides strategic recommendations for new entrants and established companies to navigate the complexities of the market.
Future Outlook
- Demand for eco-friendly, biodegradable degreasers will continue to rise across industries.
- Water-based formulations will gain further market share as regulations tighten.
- Advanced degreasers for automated and precision cleaning systems will see higher adoption.
- Industrial maintenance growth will drive steady demand for heavy-duty solutions.
- Automotive and transportation sectors will expand usage due to increased service requirements.
- Manufacturers will invest more in low-VOC and non-toxic chemical technologies.
- Bio-based raw materials will become a stronger focus for product development.
- Cost-effective degreasers will remain important in price-sensitive regions.
- Digital monitoring of cleaning processes will emerge in smart manufacturing environments.
- Global players will strengthen partnerships to expand reach in developing markets.
Request a Free Sample
Fill in your details and we'll send you a free sample report.
- Sample data tables & charts
- Research methodology
Need a Custom Version of This Report?
Tailor the scope, geography, or segments to your exact requirements.
- Custom geography or segment scope
- Direct access to our analyst team
Frequently Asked Questions
What is the current market size for the Cleaner Degreaser market, and what is its projected size in 2032?
At what Compound Annual Growth Rate is the Cleaner Degreaser market projected to grow between 2025 and 2032?
Which Cleaner Degreaser market segment held the largest share in 2024?
What are the primary factors fueling the growth of the Cleaner Degreaser market?
Who are the leading companies in the Cleaner Degreaser market?
Table of Content
Chapter 1. Report Introduction
- 1.1 Report Description & Purpose
- 1.1.1 Report Title & Market Definition
- 1.1.2 Unique Selling Propositions (USP) & Key Differentiators
- 1.1.3 Value Proposition for Stakeholders
- 1.2 Research Objectives
- 1.2.1 Market Sizing Objectives (Volume & Revenue)
- 1.2.2 Segmentation Objectives
- 1.2.3 Competitive Intelligence Objectives
- 1.2.4 Forecast & Scenario Objectives
- 1.3 Report Scope
- 1.3.1 Cleaner Degreaser Scope – Types & Subtypes Covered
- 1.3.2 Geographic Scope – Regions & Countries Covered
- 1.3.3 Historical Period, Base Year & Forecast Period (2024; forecast to 2032)
- 1.3.4 Inclusions & Exclusions
- 1.4 HS Code & Classification Framework
- 1.5 Currency, Units & Pricing Basis
- 1.6 Target Stakeholders
- 1.7 Limitations & Assumptions
Chapter 2. Executive Summary
- 2.1 Global Cleaner Degreaser Market Snapshot
- 2.1.1 Market Size – Historical (2024) & Forecast (2024-2032) (2024: USD 12,467.6 million → 2032: USD 16,065.48 million)
- 2.1.2 Volume & Revenue – Global Totals
- 2.1.3 Key Market Highlights – Top Five Facts
- 2.2 Cleaner Degreaser Market Segmentation Snapshot
- 2.2.1 Market Split by Region – 2024 vs. 2032
- 2.3 Competitive Snapshot
- 2.3.1 Top 10 Players by Revenue Share – 2024
- 2.3.2 Top 10 Players by Volume Share – 2024
- 2.3.3 Recent Strategic Developments (18-Month Summary)
- 2.4 Key Investment Highlights & Strategic Conclusions
Chapter 3. Cleaner Degreaser Market Dynamics & Industry Analysis
- 3.1 Market Overview & Context
- 3.1.1 Cleaner Degreaser Market Position in the Broader Automotive Value Chain
- 3.1.2 OEM vs. Replacement Market Dynamics
- 3.1.3 Market Maturity & Development Stage by Region
- 3.2 Cleaner Degreaser Market Drivers
- 3.3 Cleaner Degreaser Market Restraints & Challenges
- 3.4 Cleaner Degreaser Market Opportunities
- 3.5 Porter's Five Forces Analysis
- 3.5.1 Threat of New Entrants
- 3.5.2 Bargaining Power of Suppliers
- 3.5.3 Bargaining Power of Buyers
- 3.5.4 Threat of Substitutes
- 3.5.5 Competitive Rivalry – Intensity Assessment
- 3.6 Cleaner Degreaser Value Chain Analysis
- 3.6.1 Upstream – Raw Material/Input Suppliers
- 3.6.1.1 Raw Material/Input 1
- 3.6.1.2 Raw Material/Input 2
- 3.6.1.3 Raw Material/Input 3
- 3.6.2 Midstream – Production/Manufacturing/Service Delivery
- 3.6.2.1 Production/Process Overview
- 3.6.2.2 Key Facility Locations & Capacity by Manufacturer
- 3.6.3 Downstream – Distribution & End Consumer
- 3.6.3.1 Primary Channel – B2B/OEM
- 3.6.3.2 Secondary Channels – Dealer, Retail, Online, Direct
- 3.6.4 Value Chain Profitability Analysis
- 3.6.1 Upstream – Raw Material/Input Suppliers
- 3.7 PESTEL Analysis
- 3.7.1 Political Factors
- 3.7.2 Economic Factors
- 3.7.3 Social Factors
- 3.7.4 Technological Factors
- 3.7.5 Environmental Factors
- 3.7.6 Legal Factors
- 3.8 Cleaner Degreaser Supply Chain Analysis
- 3.8.1 Raw Material/Input Supply Risk Assessment
- 3.8.2 Manufacturing Concentration Risk (Geographic Exposure)
- 3.8.3 Trade Disruption Impact Analysis
- 3.9 Regulatory & Policy Landscape
Note: The regulatory and policy landscape section covers regulations based on their applicability to the market, Cleaner Degreaser category, geography, and scope of the study. Only regulatory frameworks with a material impact on operations, compliance, trade, sustainability, or market access are analyzed in detail.
Chapter 4. Key Investment Pockets & Opportunity Analysis
- 4.1 Cleaner Degreaser Market Attractiveness Analysis
- 4.1.1 By Region – Investment Attractiveness Matrix (Volume × CAGR)
- 4.2 Absolute Revenue Growth Opportunity
- 4.2.1 By Region – Absolute USD Growth Through 2032
- 4.3 Incremental Volume Opportunity
- 4.3.1 By Region – Incremental Volume Through 2032
- 4.3.2 Segment – Incremental Volume
- 4.4 Emerging Submarket Opportunity Deep Dive (Subject to Applicability)
- 4.5 Emerging Market Opportunity Scorecards
- 4.5.1 United States
- 4.5.2 Europe
- 4.5.3 Asia
- 4.5.4 Middle East & Africa
Note: Emerging Market Opportunity Scorecards will be included based on relevance and strategic importance. Regions listed are indicative and may vary depending on data availability and market dynamics.
Chapter 5. Cleaner Degreaser Import-Export Analysis & Trade Flows
- 5.1 Global Trade Overview
- 5.1.1 Global Export Value by Country (2024)
- 5.1.2 Global Export Volume by Country (2024)
- 5.1.3 Global Import Value by Country (2024)
- 5.1.4 Global Import Volume by Country (2024)
- 5.1.5 Net Trade Balance by Country (2024)
- 5.2 Export Analysis – Segment
- 5.2.1 Type 1 (HS Code)
- 5.2.2 Type 2 (HS Code)
- 5.2.3 Type 3 (HS Code)
- 5.2.4 Type 4 (HS Code)
- 5.2.5 Type 5 (HS Code)
- 5.3 Import Analysis – Segment
- 5.3.1 Type 1 (HS Code)
- 5.3.2 Type 2 (HS Code)
- 5.3.3 Type 3 (HS Code)
- 5.3.4 Type 4 (HS Code)
- 5.3.5 Type 5 (HS Code)
- 5.4 Average Unit Trade Prices
- 5.4.1 Average Export Price – Segment & Country
- 5.4.2 Average Import Price – Segment & Source Country
- 5.4.3 Price Trends (2024)
- 5.5 Key Trade Route Analysis
- 5.5.1 Trade Route 1
- 5.5.2 Trade Route 2
- 5.5.3 Trade Route 3
- 5.5.4 Trade Route 4
- 5.5.5 Trade Route 5
- 5.6 Trade Policy Impact Assessment
- 5.6.1 US Anti-Dumping & Section 301 Tariffs
- 5.6.2 EU Customs Union Impact
- 5.6.3 Major Free Trade Agreements
- 5.6.4 USMCA Rules of Origin
Note: Trade policy analysis will be included only where relevant to the Cleaner Degreaser market.
Chapter 6. Competitive Landscape & Company Benchmarking
- 6.1 Cleaner Degreaser Market Concentration & Structure
- 6.1.1 Herfindahl-Hirschman Index (HHI) – vs. 2024
- 6.1.2 Tier 1, Tier 2 & Tier 3 Market Structure
- 6.1.3 Global, Regional & Local Player Dynamics
- 6.2 Cleaner Degreaser Market Share Analysis – 2024
- 6.2.1 Global Revenue Share by Company
- 6.2.2 Global Volume Share by Company
- 6.2.3 Regional Revenue Share
- 6.2.4 Market Share Evolution ( vs. 2024)
- 6.2.5 OEM Segment Share by Company
- 6.2.6 Replacement Segment Share by Company
- 6.3 Production/Delivery Capacity & Facility Analysis
- 6.3.1 Global Installed Capacity
- 6.3.2 Capacity Utilization Rates
- 6.3.3 Production/Output Volume
- 6.3.4 Facility Locations & Capacity Map
- 6.3.5 Planned Capacity Additions
- 6.4 Cleaner Degreaser Competitive Benchmarking Matrix
- 6.4.1 Revenue, Volume, CAGR & Profitability Comparison
- 6.4.2 Channel Revenue Mix
- 6.4.3 Geographic Revenue Exposure
- 6.4.4 R&D Intensity
- 6.4.5 Sustainability Maturity
- 6.5 Strategic Developments in Cleaner Degreaser (Last 24 Months)
- 6.5.1 Mergers, Acquisitions & Divestments
- 6.5.2 New Cleaner Degreaser Launches
- 6.5.3 Facility Expansions
- 6.5.4 Strategic Alliances, Joint Ventures & Partnerships
- 6.5.5 Distribution Expansion & Market Entry
- 6.5.6 Sustainability & ESG Initiatives
- 6.6 Competitive Strategy Mapping
- 6.6.1 Leader, Challenger, Follower & Niche Classification
- 6.6.2 Pricing Strategy Comparison
- 6.6.3 Channel Strategy Matrix
Note: Strategic developments are included based on their materiality and the availability of reliable information.
Chapter 7. Global Cleaner Degreaser Market – By Distribution Channel
- 7.1 Segment Overview
- 7.1.1 Volume & Revenue Split by Channel (2024 & 2032)
- 7.1.2 Channel Mix Evolution (2024-2032)
Chapter 8. Regional Market Analysis – Global Overview
- 8.1 Global Regional Overview
- 8.1.1 Regional Volume Share
- 8.1.2 Regional Revenue Share
- 8.1.3 Regional Volume by Region
- 8.1.4 Regional Revenue by Region
- 8.1.5 Regional Forecast Through 2032
- 8.2 Cross-Regional Segment Analysis
- 8.2.1 By Distribution Channel
- 8.2.2 By Brand/Price Tier
Chapter 9. North America Cleaner Degreaser Market
- 9.1 United States
- 9.2 Canada
- 9.3 Mexico
Chapter 10. Europe Cleaner Degreaser Market
- 10.1 Germany
- 10.2 France
- 10.3 Italy
- 10.4 United Kingdom
- 10.5 Spain
- 10.6 Poland
- 10.7 Russia
- 10.8 Netherlands
- 10.9 Belgium
- 10.10 Sweden
- 10.11 Denmark
- 10.12 Norway
- 10.13 Rest of Europe
Chapter 11. Asia Pacific Cleaner Degreaser Market
- 11.1 China
- 11.2 India
- 11.3 Japan
- 11.4 South Korea
- 11.5 Thailand
- 11.6 Indonesia
- 11.7 Vietnam
- 11.8 Malaysia
- 11.9 Australia
- 11.10 Rest of Asia Pacific
Chapter 12. Latin America Cleaner Degreaser Market
- 12.1 Brazil
- 12.2 Argentina
- 12.3 Colombia
- 12.4 Chile
- 12.5 Rest of Latin America
Chapter 13. Middle East Cleaner Degreaser Market
- 13.1 Saudi Arabia
- 13.2 United Arab Emirates
- 13.3 Turkey
- 13.4 Israel
- 13.5 Iran
- 13.6 Rest of the Middle East
Chapter 14. Africa Cleaner Degreaser Market
- 14.1 South Africa
- 14.2 Egypt
- 14.3 Nigeria
- 14.4 Morocco
- 14.5 Rest of Africa
Chapter 15. Cleaner Degreaser Company Profiles
- 15.1 [Company 01]
- 15.1.1 Company Overview
- 15.1.2 Key Management Personnel
- 15.1.3 Products & Services Portfolio
- 15.1.4 Financial Performance
- 15.1.5 Key Market Focus & Geographic Presence
- 15.1.6 Recent Developments & Strategic Initiatives
Note: The company profile list is preliminary and may change based on research findings, market developments, data availability, and client requirements.
Chapter 16. Appendices
- Appendix A – List of Abbreviations & Acronyms
- Appendix B – Industry Classification Code Reference – Full Series
- Appendix C – Production & Capacity Data Tables
- Appendix D – End-Use & Demand Base Tables
- Appendix E – Consumption & Replacement Rate Assumptions
- Appendix F – ASP Reference Tables
- Appendix G – Manufacturing & Facility Database
- Appendix H – Import-Export Data Tables
- Appendix I – Regulatory Summary Tables
- Appendix J – Primary Research Participant List (Anonymized)
- Appendix K – Primary Research Questionnaire Framework
- Appendix L – Data Sources & Bibliography
- Appendix M – Market Size Divergence & Source Comparison
Chapter 17. Research Methodology
- 17.1 Research Framework & Philosophy
- 17.2 Secondary Research – Sources, Hierarchy & Data Extraction
- 17.3 Data Modeling – Bottom-Up & Top-Down Market Sizing
- 17.4 Primary Research – Stakeholder Framework, LOI & Sample Sizes
- 17.5 Forecast Methodology – Regression, Scenario & Sensitivity Analysis
- 17.6 Quality Control – Four-Layer Validation Framework
- 17.7 Limitations & Standard Assumptions
- 17.8 Disclaimer
