
Market Overview
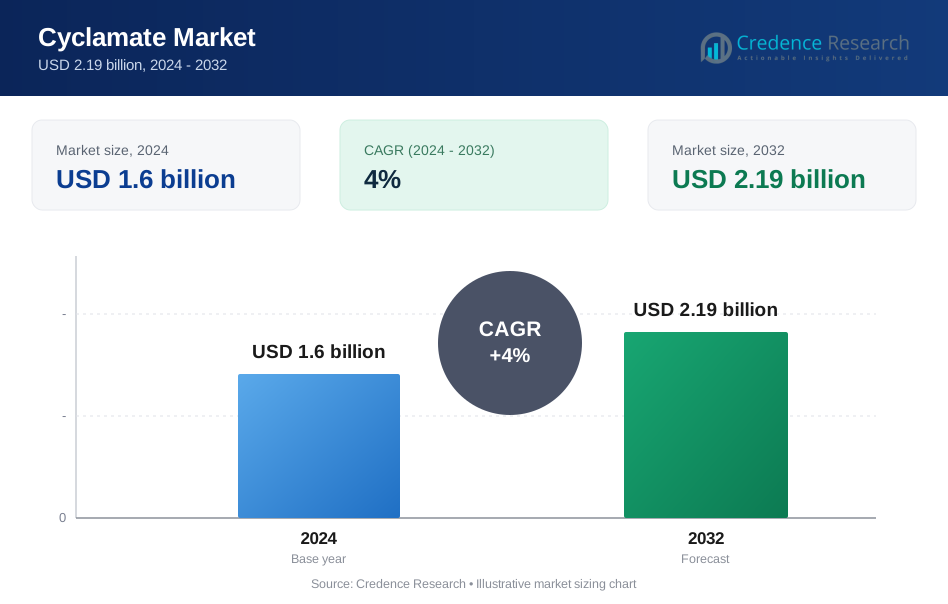
Cyclamate market size was valued USD 1.6 Billion in 2024 and is anticipated to reach USD 2.19 Billion by 2032, at a CAGR of 4% during the forecast period.
| REPORT ATTRIBUTE | DETAILS |
|---|---|
| Historical Period | 2020-2023 |
| Base Year | 2024 |
| Forecast Period | 2025-2032 |
| Cyclamate Market Size 2024 | USD 1.6 Billion |
| Cyclamate Market, CAGR | 4% |
| Cyclamate Market Size 2032 | USD 2.19 Billion |
The cyclamate market is led by major players such as Cargill, Tate & Lyle PLC, Beneo, Dow Chemical Company, Archer Daniels Midland Company, Kerry Group, Tereos, Ingredion Incorporated, and E. I. du Pont de Nemours and Company. These companies focus on large-scale manufacturing, regulatory compliance, and application-specific solutions for food, beverage, and pharmaceutical sectors. Asia-Pacific dominates the global cyclamate market with a 52% share in 2024, driven by strong local production, favorable regulations, and rising demand for low-cost sweeteners. Europe follows with 22%, supported by widespread use in diet food and drinks. Latin America holds 12%, while North America and the Middle East & Africa contribute 8% and 6%, respectively, with varying levels of adoption and regulation.
Market Insights
- The cyclamate market was valued at USD 1.6 billion in 2024 and is projected to reach USD 2.19 billion by 2032, growing at a CAGR of 4%.
- Rising demand for low-calorie sweeteners and sugar-reduction regulations are driving widespread cyclamate adoption in food and beverage products.
- A key trend is the growing use of cyclamate in multi-sweetener blends to improve taste and cost-efficiency across processed foods and drinks.
- Leading players focus on formulation support, capacity expansion, and regulatory compliance to remain competitive amid rising interest in natural alternatives.
- Asia-Pacific leads with 52% market share, followed by Europe at 22% and Latin America at 12%; sodium cyclamate holds over 60% of the product type segment share.
Market Segmentation Analysis:
By Type
Sodium cyclamate holds the dominant share in the cyclamate market, accounting for over 60% in 2024. Its wide use as a non-nutritive sweetener in food and beverages, due to high heat stability and 30–50 times the sweetness of sucrose, drives adoption. Sodium cyclamate is preferred in tabletop sweeteners, processed foods, and pharmaceutical syrups. Cyclamic acid, a key precursor, supports sodium and calcium cyclamate production, while calcium cyclamate remains niche, favored in low-sodium diets and specific pharmaceutical formulations. Regulatory acceptance in Asian and South American markets also boosts sodium cyclamate demand.
- For instance, PT Batang Alum Industrie reports sodium cyclamate production capacity of 4,800 metric tons per year, supporting global food and beverage supply chains. This facility also produces 600 metric tons per year of sodium saccharin, highlighting its focus on sweetener manufacturing.
By End User
The food and beverage segment dominates the cyclamate market with a market share of over 70% in 2024, led by its extensive application in diet beverages, baked goods, and confectionery. The rise in diabetic and calorie-conscious consumers supports demand for low-calorie sweeteners like cyclamate. In healthcare, cyclamate is used in oral syrups and lozenges to improve taste without adding sugar. Cosmetic applications remain limited but growing, especially in flavored lip care and dental products. The ongoing trend toward sugar reduction across F&B industries is the key driver for segment growth.
- For instance, Jiangsu Winshine Industrial Co., Ltd. confirms an annual production of 20,000 tons of sodium cyclamate, which is supplied to leading beverage and pharmaceutical companies worldwide. This scale of production reinforces the dominance of the food and beverage end-user segment.

Key Growth Drivers
Rising Demand for Low-Calorie Sweeteners
One of the key growth drivers for the cyclamate market is the increasing demand for low-calorie sweeteners. Growing health awareness, rising diabetes prevalence, and global efforts to reduce sugar intake are driving manufacturers to adopt alternatives like cyclamate. Its high sweetness intensity and cost-effectiveness make it ideal for mass-market products. The food and beverage industry, especially in Asia-Pacific and Latin America, is actively incorporating cyclamate into carbonated drinks, desserts, and packaged snacks. Regulatory approvals in multiple countries further support cyclamate's penetration in health-focused product lines.
- For instance, PepsiCo achieved its goal in 2024, a year ahead of schedule, that 67% of its beverage portfolio volume contains fewer than 100 calories from added sugars per 12-ounce serving.
Expanding Use in Pharmaceuticals and Healthcare Products
The healthcare industry’s growing use of sweeteners to improve the taste of oral medicines supports the market. Cyclamate is commonly added to syrups, chewable tablets, and throat lozenges, offering palatability without sugar. Its compatibility with other ingredients and heat stability enhances its value in pharmaceutical formulations. The demand for sugar-free medications and increasing geriatric populations are key contributing factors. Additionally, cyclamate’s non-cariogenic nature makes it suitable for pediatric and dental products, widening its use beyond traditional applications in beverages.
- For instance, Buckley’s Original Mixture (Haleon, Canada) lists sodium cyclamate as a sweetener in its cough syrup, sold in 100 mL and 200 mL bottles with dosage guidance of 5–10 mL every 2–3 hours. This demonstrates cyclamate’s approved use in OTC medicines.
Regulatory Approvals in Emerging Markets
Expansion in regulatory approval across developing economies, especially in Southeast Asia, the Middle East, and parts of Africa, is a major growth catalyst. Countries such as Indonesia, Vietnam, and Brazil allow the use of cyclamate in food and beverages, creating fresh growth opportunities for local and global manufacturers. Regulatory clarity and harmonization of food additive codes in these regions are accelerating product launches. As more countries align with Codex Alimentarius standards, international trade and adoption of cyclamate are expected to grow steadily.
Key Trends & Opportunities
Rising Consumer Shift Toward Sugar Reduction
A significant trend in the market is the global consumer shift toward sugar-reduced and sugar-free diets. This transition is fueled by concerns over obesity, diabetes, and cardiovascular health. Governments and health bodies continue to push sugar taxes and encourage reformulation of processed foods. As a result, cyclamate is gaining traction as a low-cost, stable, and effective sugar substitute. Food and beverage producers are responding by reformulating legacy brands and launching new “diet” or “light” product variants.
- For instance, Tate & Lyle reported that its ingredients helped remove 6.0 million tonnes of sugar from consumers’ diets (cumulative through March 2023), underlining the industry-wide push toward reduced-sugar formulations.
Product Innovation with Sweetener Blends
Another emerging opportunity lies in innovation through sweetener blends. Cyclamate is often combined with saccharin or acesulfame K to mimic sugar’s taste profile more closely. These blends help mask bitter aftertastes and improve consumer acceptance in processed foods and drinks. Product development teams are exploring multi-sweetener systems to tailor sweetness levels and reduce dependency on high-cost ingredients. This trend supports cyclamate’s continued use in global markets as part of blended formulations targeting both cost-efficiency and taste.
- For instance, Hermesetas Liquid is a tabletop sweetener made from a blend of sodium cyclamate and sodium saccharin. The manufacturer specifies that 10 drops of the liquid have the same sweetening power as one teaspoon of sugar, which is commonly equated to approximately 5 grams of sugar. This precise dosing allows for controlled sweetness in various food and beverage applications.
Growth in Functional Beverages and Nutraceuticals
Cyclamate is increasingly used in functional drinks, protein shakes, and dietary supplements. As demand for nutraceuticals and energy beverages grows, so does the need for sweeteners that are heat-stable and non-fermentable. Cyclamate’s ability to withstand processing conditions without altering taste or nutrition makes it attractive in such formulations. It enables the development of health-oriented beverages that maintain flavor while meeting dietary regulations. This rising use in wellness products adds a new dimension to cyclamate’s market potential.
Key Challenges
Regulatory Bans and Usage Restrictions in Some Countries
One major challenge for the cyclamate market is the continued ban or restriction of its use in several developed countries. For instance, cyclamate remains banned in the United States due to unresolved health concerns, despite its approval in over 100 other nations. This limits access to key markets and restricts potential growth. Regulatory uncertainties can also affect investment and R&D efforts. The lack of global harmonization in food additive regulations presents a major roadblock for broader adoption.
Growing Competition from Natural Sweeteners
The rise of natural sweeteners like stevia and monk fruit poses a competitive threat to cyclamate. Health-conscious consumers increasingly prefer plant-based, “clean-label” ingredients, challenging synthetic sweeteners’ market position. These natural alternatives are supported by major food producers and are often marketed as safer and more eco-friendly. The shift toward natural formulations in premium and organic product categories may limit cyclamate’s appeal, especially in North America and Europe, where consumer scrutiny of ingredients is high.
Regional Analysis
North America
North America accounts for 8% of the global cyclamate market in 2024. The U.S. maintains restrictions on food-grade cyclamate, confining its use to limited pharmaceutical and cosmetic applications. Canada permits cyclamate in some food formulations, but adoption remains modest. Growth is largely driven by demand for sugar-free medications and export-focused production. Key companies like Cargill and Dow Chemical serve industrial and healthcare use cases. However, the region continues to face pressure from consumer demand for natural sweeteners and strict regulatory oversight, limiting further expansion of synthetic sweeteners in mainstream food products.
Europe
Europe holds approximately 22% market share in the cyclamate industry, supported by widespread approval across EU member states. Cyclamate is commonly used in low-calorie sweeteners, soft drinks, and processed foods. Countries such as Germany, France, and Spain drive demand due to consumer acceptance and health-driven reforms. Tate & Lyle PLC and Beneo are major players supplying cyclamate-based ingredients in this region. Sugar tax initiatives and regulatory support for sugar reduction strategies have created a favorable environment. However, rising preference for clean-label products may present a shift toward more natural alternatives in the coming years.
Asia-Pacific
Asia-Pacific leads the global cyclamate market with a dominant 52% share in 2024. China, Indonesia, and Vietnam account for the majority of production and consumption. The region’s strong food processing sector, combined with cost-effective production, supports bulk use of cyclamate in beverages, bakery, and confectionery. Companies such as Tereos, Archer Daniels Midland Company, and Ingredion Incorporated have strong supply chains in the region. Regulatory acceptance and demand for low-cost, heat-stable sweeteners support growth. Rising health awareness and rapid urbanization further accelerate adoption in packaged food and drink categories.
Latin America
Latin America contributes around 12% to the global cyclamate market, with Brazil leading consumption. Cyclamate is widely used in carbonated drinks, table-top sweeteners, and dairy-based products due to low cost and local regulatory support. Kerry Group and DuPont cater to local and regional demand. The region’s sugar reduction initiatives and high per capita consumption of sweetened beverages support cyclamate use. Though natural sweeteners are gaining attention, affordability and existing formulations keep cyclamate popular in mass-market applications. Regional suppliers focus on retail and institutional food service sectors to drive growth.
Middle East and Africa
The Middle East and Africa hold a 6% share of the cyclamate market in 2024, with growing uptake in countries such as Saudi Arabia, UAE, and South Africa. Market expansion is supported by urbanization and increased demand for diabetic-friendly products. E. I. du Pont de Nemours and Kerry Group are expanding their product presence in this region. Cyclamate is commonly used in flavored drink powders and low-cost processed snacks. Despite limited local manufacturing, demand is growing due to a rise in health awareness. Import dependence and lack of regional regulations remain mild restraints.
Market Segmentations:
By Type:
- cyclamic acid
- sodium cyclamate
- calcium cyclamate
By End User:
- food and beverage
- healthcare
- cosmetics
By Geography
- North America
- U.S.
- Canada
- Mexico
- Europe
- Germany
- France
- U.K.
- Italy
- Spain
- Rest of Europe
- Asia Pacific
- China
- Japan
- India
- South Korea
- South-east Asia
- Rest of Asia Pacific
- Latin America
- Brazil
- Argentina
- Rest of Latin America
- Middle East & Africa
- GCC Countries
- South Africa
- Rest of the Middle East and Africa
Competitive Landscape
The cyclamate market features a competitive landscape shaped by key players such as Cargill, Incorporated, Tate & Lyle PLC, Beneo, Dow Chemical Company, Archer Daniels Midland Company, Kerry Group, Tereos, Ingredion Incorporated, and E. I. du Pont de Nemours and Company. These companies focus on product consistency, regulatory compliance, and cost-effective production to maintain market positions. Strategic efforts include backward integration for raw materials, investment in high-purity variants, and expansion of production units across Asia-Pacific and Latin America. Market participants prioritize application-specific customization for beverages, pharmaceuticals, and dietary supplements to meet regional needs. Competitive intensity is driven by growing demand for low-calorie sweeteners and pressure from emerging natural alternatives. Companies differentiate through R&D in multi-sweetener systems, formulation support services, and collaborations with local distributors. Additionally, players aim to secure long-term contracts with food and pharmaceutical manufacturers to stabilize revenue. Product quality, global supply networks, and compliance with region-specific food codes remain critical competitive levers.
Key Player Analysis
- Cargill, Incorporated
- Beneo
- Tate Lyle PLC
- Tereos
- Ingredion Incorporated
- Dow Chemical Company
- Archer Daniels Midland Company
- Kerry Group
- I. du Pont de Nemours and Company
Recent Developments
- In 2025, Dow announced a strategic investment in Xycle, a chemical recycling firm based in Rotterdam, alongside other investors. This investment will support the construction of Xycle's first large-scale pyrolysis plant in the Port of Rotterdam.
- In 2024, Cargill, Incorporated opened a new, transformed Innovation Center in Singapore to advance food innovation across the Asia-Pacific region, including new sweetener applications
- In 2024, Kerry Group launched a new digital innovation hub focused on supplements, offering clinical research, consumer insights, and product information geared toward health-focused ingredient solutions
Report Coverage
The research report offers an in-depth analysis based on Type, End-User and Geography. It details leading market players, providing an overview of their business, product offerings, investments, revenue streams, and key applications. Additionally, the report includes insights into the competitive environment, SWOT analysis, current market trends, as well as the primary drivers and constraints. Furthermore, it discusses various factors that have driven market expansion in recent years. The report also explores market dynamics, regulatory scenarios, and technological advancements that are shaping the industry. It assesses the impact of external factors and global economic changes on market growth. Lastly, it provides strategic recommendations for new entrants and established companies to navigate the complexities of the market.
Future Outlook
- The cyclamate market is expected to grow steadily due to rising demand for low-calorie sweeteners.
- Asia-Pacific will remain the leading region, supported by strong production and consumption trends.
- Regulatory approvals in emerging markets will open new growth opportunities for manufacturers.
- Food and beverage applications will continue to drive the bulk of global cyclamate consumption.
- Blended sweetener formulations will gain traction to improve taste profiles and reduce cost.
- Pharmaceutical and healthcare industries will increase cyclamate use in sugar-free medicines.
- Rising obesity and diabetes cases worldwide will boost adoption of non-nutritive sweeteners.
- Natural sweeteners will pose competition, leading to increased innovation in synthetic blends.
- Global suppliers will invest in capacity expansion to meet rising demand in Latin America and Africa.
- Continued focus on regulatory compliance and food safety standards will shape market strategies.
Request a Free Sample
Fill in your details and we'll send you a free sample report.
- Sample data tables & charts
- Research methodology
Need a Custom Version of This Report?
Tailor the scope, geography, or segments to your exact requirements.
- Custom geography or segment scope
- Direct access to our analyst team
Frequently Asked Questions
What is the current market size for Cyclamate market, and what is its projected size in 2032?
At what Compound Annual Growth Rate is the Cyclamate market projected to grow between 2025 and 2032?
Which Cyclamate market segment held the largest share in 2024?
What are the primary factors fueling the growth of the Cyclamate market?
Who are the leading companies in the Cyclamate market?
Which region commanded the largest share of the Cyclamate market in 2024?
Table of Content
Chapter 1. Report Introduction
- 1.1 Report Description & Purpose
- 1.1.1 Report Title & Market Definition
- 1.1.2 Unique Selling Propositions (USP) & Key Differentiators
- 1.1.3 Value Proposition for Stakeholders
- 1.2 Research Objectives
- 1.2.1 Market Sizing Objectives (Volume & Revenue)
- 1.2.2 Segmentation Objectives
- 1.2.3 Competitive Intelligence Objectives
- 1.2.4 Forecast & Scenario Objectives
- 1.3 Report Scope
- 1.3.1 Cyclamate Scope – Types & Subtypes Covered
- 1.3.2 Geographic Scope – Regions & Countries Covered
- 1.3.3 Historical Period, Base Year & Forecast Period (2024; forecast to 2032)
- 1.3.4 Inclusions & Exclusions
- 1.4 HS Code & Classification Framework
- 1.5 Currency, Units & Pricing Basis
- 1.6 Target Stakeholders
- 1.7 Limitations & Assumptions
Chapter 2. Executive Summary
- 2.1 Global Cyclamate Market Snapshot
- 2.1.1 Market Size – Historical (2024) & Forecast (2024-2032) (2024: USD 1.6 billion → 2032: USD 2.19 billion)
- 2.1.2 Volume & Revenue – Global Totals
- 2.1.3 Key Market Highlights – Top Five Facts
- 2.2 Cyclamate Market Segmentation Snapshot
- 2.2.1 Market Split by Region – 2024 vs. 2032
- 2.3 Competitive Snapshot
- 2.3.1 Top 10 Players by Revenue Share – 2024
- 2.3.2 Top 10 Players by Volume Share – 2024
- 2.3.3 Recent Strategic Developments (18-Month Summary)
- 2.4 Key Investment Highlights & Strategic Conclusions
Chapter 3. Cyclamate Market Dynamics & Industry Analysis
- 3.1 Market Overview & Context
- 3.1.1 Cyclamate Market Position in the Broader Automotive Value Chain
- 3.1.2 OEM vs. Replacement Market Dynamics
- 3.1.3 Market Maturity & Development Stage by Region
- 3.2 Cyclamate Market Drivers
- 3.3 Cyclamate Market Restraints & Challenges
- 3.4 Cyclamate Market Opportunities
- 3.5 Porter's Five Forces Analysis
- 3.5.1 Threat of New Entrants
- 3.5.2 Bargaining Power of Suppliers
- 3.5.3 Bargaining Power of Buyers
- 3.5.4 Threat of Substitutes
- 3.5.5 Competitive Rivalry – Intensity Assessment
- 3.6 Cyclamate Value Chain Analysis
- 3.6.1 Upstream – Raw Material/Input Suppliers
- 3.6.1.1 Raw Material/Input 1
- 3.6.1.2 Raw Material/Input 2
- 3.6.1.3 Raw Material/Input 3
- 3.6.2 Midstream – Production/Manufacturing/Service Delivery
- 3.6.2.1 Production/Process Overview
- 3.6.2.2 Key Facility Locations & Capacity by Manufacturer
- 3.6.3 Downstream – Distribution & End Consumer
- 3.6.3.1 Primary Channel – B2B/OEM
- 3.6.3.2 Secondary Channels – Dealer, Retail, Online, Direct
- 3.6.4 Value Chain Profitability Analysis
- 3.6.1 Upstream – Raw Material/Input Suppliers
- 3.7 PESTEL Analysis
- 3.7.1 Political Factors
- 3.7.2 Economic Factors
- 3.7.3 Social Factors
- 3.7.4 Technological Factors
- 3.7.5 Environmental Factors
- 3.7.6 Legal Factors
- 3.8 Cyclamate Supply Chain Analysis
- 3.8.1 Raw Material/Input Supply Risk Assessment
- 3.8.2 Manufacturing Concentration Risk (Geographic Exposure)
- 3.8.3 Trade Disruption Impact Analysis
- 3.9 Regulatory & Policy Landscape
Note: The regulatory and policy landscape section covers regulations based on their applicability to the market, Cyclamate category, geography, and scope of the study. Only regulatory frameworks with a material impact on operations, compliance, trade, sustainability, or market access are analyzed in detail.
Chapter 4. Key Investment Pockets & Opportunity Analysis
- 4.1 Cyclamate Market Attractiveness Analysis
- 4.1.1 By Region – Investment Attractiveness Matrix (Volume × CAGR)
- 4.2 Absolute Revenue Growth Opportunity
- 4.2.1 By Region – Absolute USD Growth Through 2032
- 4.3 Incremental Volume Opportunity
- 4.3.1 By Region – Incremental Volume Through 2032
- 4.3.2 Segment – Incremental Volume
- 4.4 Emerging Submarket Opportunity Deep Dive (Subject to Applicability)
- 4.5 Emerging Market Opportunity Scorecards
- 4.5.1 United States
- 4.5.2 Europe
- 4.5.3 Asia
- 4.5.4 Middle East & Africa
Note: Emerging Market Opportunity Scorecards will be included based on relevance and strategic importance. Regions listed are indicative and may vary depending on data availability and market dynamics.
Chapter 5. Cyclamate Import-Export Analysis & Trade Flows
- 5.1 Global Trade Overview
- 5.1.1 Global Export Value by Country (2024)
- 5.1.2 Global Export Volume by Country (2024)
- 5.1.3 Global Import Value by Country (2024)
- 5.1.4 Global Import Volume by Country (2024)
- 5.1.5 Net Trade Balance by Country (2024)
- 5.2 Export Analysis – Segment
- 5.2.1 Type 1 (HS Code)
- 5.2.2 Type 2 (HS Code)
- 5.2.3 Type 3 (HS Code)
- 5.2.4 Type 4 (HS Code)
- 5.2.5 Type 5 (HS Code)
- 5.3 Import Analysis – Segment
- 5.3.1 Type 1 (HS Code)
- 5.3.2 Type 2 (HS Code)
- 5.3.3 Type 3 (HS Code)
- 5.3.4 Type 4 (HS Code)
- 5.3.5 Type 5 (HS Code)
- 5.4 Average Unit Trade Prices
- 5.4.1 Average Export Price – Segment & Country
- 5.4.2 Average Import Price – Segment & Source Country
- 5.4.3 Price Trends (2024)
- 5.5 Key Trade Route Analysis
- 5.5.1 Trade Route 1
- 5.5.2 Trade Route 2
- 5.5.3 Trade Route 3
- 5.5.4 Trade Route 4
- 5.5.5 Trade Route 5
- 5.6 Trade Policy Impact Assessment
- 5.6.1 US Anti-Dumping & Section 301 Tariffs
- 5.6.2 EU Customs Union Impact
- 5.6.3 Major Free Trade Agreements
- 5.6.4 USMCA Rules of Origin
Note: Trade policy analysis will be included only where relevant to the Cyclamate market.
Chapter 6. Competitive Landscape & Company Benchmarking
- 6.1 Cyclamate Market Concentration & Structure
- 6.1.1 Herfindahl-Hirschman Index (HHI) – vs. 2024
- 6.1.2 Tier 1, Tier 2 & Tier 3 Market Structure
- 6.1.3 Global, Regional & Local Player Dynamics
- 6.2 Cyclamate Market Share Analysis – 2024
- 6.2.1 Global Revenue Share by Company
- 6.2.2 Global Volume Share by Company
- 6.2.3 Regional Revenue Share
- 6.2.4 Market Share Evolution ( vs. 2024)
- 6.2.5 OEM Segment Share by Company
- 6.2.6 Replacement Segment Share by Company
- 6.3 Production/Delivery Capacity & Facility Analysis
- 6.3.1 Global Installed Capacity
- 6.3.2 Capacity Utilization Rates
- 6.3.3 Production/Output Volume
- 6.3.4 Facility Locations & Capacity Map
- 6.3.5 Planned Capacity Additions
- 6.4 Cyclamate Competitive Benchmarking Matrix
- 6.4.1 Revenue, Volume, CAGR & Profitability Comparison
- 6.4.2 Channel Revenue Mix
- 6.4.3 Geographic Revenue Exposure
- 6.4.4 R&D Intensity
- 6.4.5 Sustainability Maturity
- 6.5 Strategic Developments in Cyclamate (Last 24 Months)
- 6.5.1 Mergers, Acquisitions & Divestments
- 6.5.2 New Cyclamate Launches
- 6.5.3 Facility Expansions
- 6.5.4 Strategic Alliances, Joint Ventures & Partnerships
- 6.5.5 Distribution Expansion & Market Entry
- 6.5.6 Sustainability & ESG Initiatives
- 6.6 Competitive Strategy Mapping
- 6.6.1 Leader, Challenger, Follower & Niche Classification
- 6.6.2 Pricing Strategy Comparison
- 6.6.3 Channel Strategy Matrix
Note: Strategic developments are included based on their materiality and the availability of reliable information.
Chapter 7. Global Cyclamate Market – By Distribution Channel
- 7.1 Segment Overview
- 7.1.1 Volume & Revenue Split by Channel (2024 & 2032)
- 7.1.2 Channel Mix Evolution (2024-2032)
Chapter 8. Regional Market Analysis – Global Overview
- 8.1 Global Regional Overview
- 8.1.1 Regional Volume Share
- 8.1.2 Regional Revenue Share
- 8.1.3 Regional Volume by Region
- 8.1.4 Regional Revenue by Region
- 8.1.5 Regional Forecast Through 2032
- 8.2 Cross-Regional Segment Analysis
- 8.2.1 By Distribution Channel
- 8.2.2 By Brand/Price Tier
Chapter 9. North America Cyclamate Market
- 9.1 United States
- 9.2 Canada
- 9.3 Mexico
Chapter 10. Europe Cyclamate Market
- 10.1 Germany
- 10.2 France
- 10.3 Italy
- 10.4 United Kingdom
- 10.5 Spain
- 10.6 Poland
- 10.7 Russia
- 10.8 Netherlands
- 10.9 Belgium
- 10.10 Sweden
- 10.11 Denmark
- 10.12 Norway
- 10.13 Rest of Europe
Chapter 11. Asia Pacific Cyclamate Market
- 11.1 China
- 11.2 India
- 11.3 Japan
- 11.4 South Korea
- 11.5 Thailand
- 11.6 Indonesia
- 11.7 Vietnam
- 11.8 Malaysia
- 11.9 Australia
- 11.10 Rest of Asia Pacific
Chapter 12. Latin America Cyclamate Market
- 12.1 Brazil
- 12.2 Argentina
- 12.3 Colombia
- 12.4 Chile
- 12.5 Rest of Latin America
Chapter 13. Middle East Cyclamate Market
- 13.1 Saudi Arabia
- 13.2 United Arab Emirates
- 13.3 Turkey
- 13.4 Israel
- 13.5 Iran
- 13.6 Rest of the Middle East
Chapter 14. Africa Cyclamate Market
- 14.1 South Africa
- 14.2 Egypt
- 14.3 Nigeria
- 14.4 Morocco
- 14.5 Rest of Africa
Chapter 15. Cyclamate Company Profiles
- 15.1 [Company 01]
- 15.1.1 Company Overview
- 15.1.2 Key Management Personnel
- 15.1.3 Products & Services Portfolio
- 15.1.4 Financial Performance
- 15.1.5 Key Market Focus & Geographic Presence
- 15.1.6 Recent Developments & Strategic Initiatives
Note: The company profile list is preliminary and may change based on research findings, market developments, data availability, and client requirements.
Chapter 16. Appendices
- Appendix A – List of Abbreviations & Acronyms
- Appendix B – Industry Classification Code Reference – Full Series
- Appendix C – Production & Capacity Data Tables
- Appendix D – End-Use & Demand Base Tables
- Appendix E – Consumption & Replacement Rate Assumptions
- Appendix F – ASP Reference Tables
- Appendix G – Manufacturing & Facility Database
- Appendix H – Import-Export Data Tables
- Appendix I – Regulatory Summary Tables
- Appendix J – Primary Research Participant List (Anonymized)
- Appendix K – Primary Research Questionnaire Framework
- Appendix L – Data Sources & Bibliography
- Appendix M – Market Size Divergence & Source Comparison
Chapter 17. Research Methodology
- 17.1 Research Framework & Philosophy
- 17.2 Secondary Research – Sources, Hierarchy & Data Extraction
- 17.3 Data Modeling – Bottom-Up & Top-Down Market Sizing
- 17.4 Primary Research – Stakeholder Framework, LOI & Sample Sizes
- 17.5 Forecast Methodology – Regression, Scenario & Sensitivity Analysis
- 17.6 Quality Control – Four-Layer Validation Framework
- 17.7 Limitations & Standard Assumptions
- 17.8 Disclaimer
