Executive Summary & Core Metrics
The global soluble fibers market was valued at USD 3,227.5 million in 2024 and is projected to reach USD 5,666.83 million by 2032, expanding at a compound annual growth rate (CAGR) of 7.29% during the forecast period, according to Credence Research.
| REPORT ATTRIBUTE | DETAILS |
|---|---|
| Historical Period | 2020-2023 |
| Base Year | 2024 |
| Forecast Period | 2025-2032 |
| Soluble Fibers Market Size 2024 | USD 3,227.5 million |
| Soluble Fibers Market, CAGR | 7.29% |
| Soluble Fibers Market Size 2032 | USD 5,666.83 million |
This growth reflects rising demand for digestive health solutions, plant-based nutrition, clean-label ingredients, sugar reduction systems and prebiotic fiber formulations across food, beverages, dietary supplements, pharmaceuticals and animal nutrition.
The global soluble fibers market is characterized by the presence of major ingredient suppliers, specialty nutrition companies and plant-based formulation providers competing on solubility, taste, digestive health functionality, clean-label positioning and processing consistency. Leading players focus on inulin, pectin, polydextrose and specialty plant-derived soluble fibers sourced from fruits and vegetables, cereals and grains, legumes and other plant materials. Strategic priorities across the sector include prebiotic ingredient development, microbiome-focused innovation, sugar reduction solutions, plant-based applications, sustainable sourcing, clinical validation and partnerships with food manufacturers and supplement brands.
Strategic Market Insights
- Market growth is primarily driven by rising interest in digestive health, plant-based nutrition, sugar reduction and clean-label food formulations.
- Dominant industry trends highlight the expansion of prebiotic ingredients, microbiome-focused products, plant-based fibers and natural formulations targeting gut health and metabolic wellness.
- The competitive landscape is defined by major players expanding natural fiber portfolios, prebiotic ingredients, extraction technologies and ingredient standardization capabilities.
- According to Credence Research regional mapping, North America represents the largest market, accounting for a definitive 31.4% share due to strong functional food consumption, supplement demand and high consumer spending on wellness products.
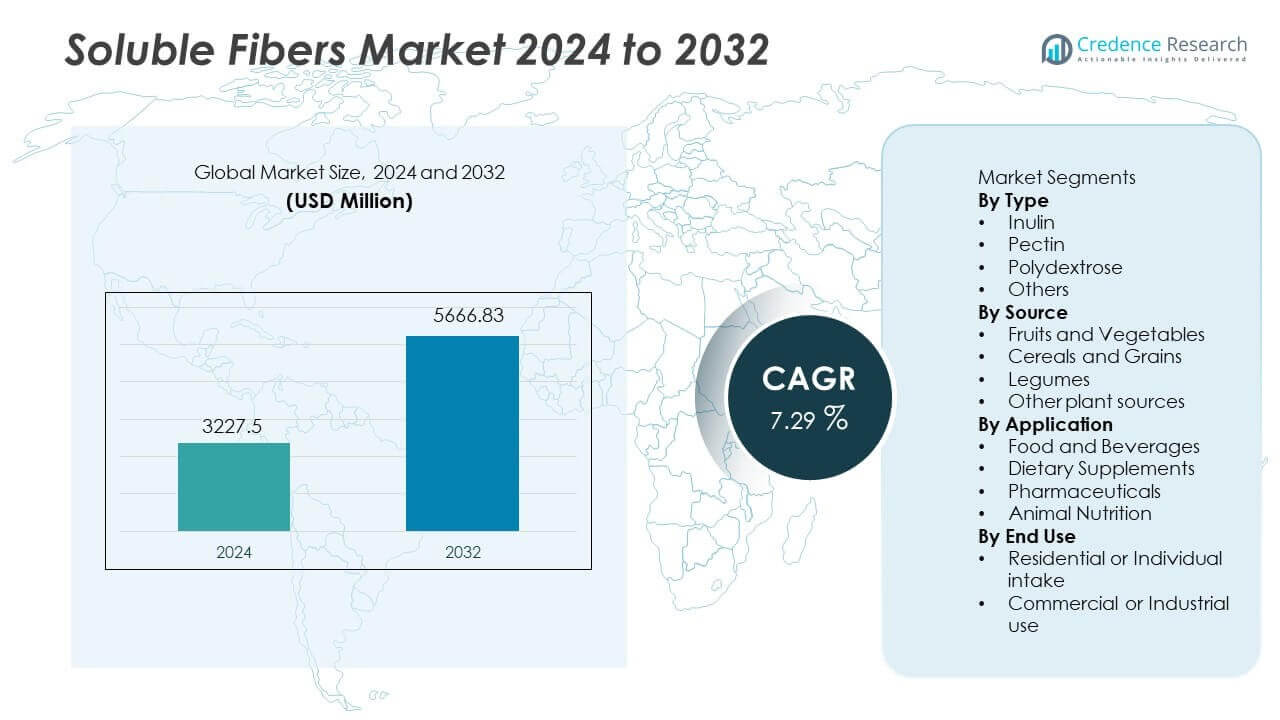
Market Segmentation Analysis
By Type
- Inulin
- Pectin
- Polydextrose
- Others
Inulin dominates the soluble fibers market with near 41% share in 2024. Its leadership is supported by strong prebiotic functionality, texture enhancement and wide use in functional foods and beverages. Food manufacturers use inulin to improve digestive health positioning, reduce calories and enhance mouthfeel in dairy alternatives, bakery products, nutrition bars and fortified beverages. Its ability to support sugar reduction while improving product texture makes it an important ingredient in modern clean-label formulations.
Pectin holds near 24% share, driven by demand across jams, confectionery, fruit preparations and gelling applications. Polydextrose accounts for near 18% share due to its fiber-enhancing capabilities in beverages, snacks and reduced-sugar products. Other soluble fibers contribute the remaining near 17% across specialty nutrition, supplements and formulation-specific uses. Growth across all types is supported by rising consumer focus on gut health, weight management and healthier product labels.
Cargill improved its Oliggo-Fiber inulin line through a production upgrade by its supplier that significantly expanded production capacity, enabling broader supply for bakery and beverage clients.
By Source
- Fruits and Vegetables
- Cereals and Grains
- Legumes
- Other plant sources
Fruits and vegetables lead the source segment with near 46% share in 2024. Their dominance is supported by commercial extraction of inulin and pectin, clean-label demand and consumer preference for plant-derived supplements and food ingredients. These sources help brands position products around natural origin, digestive health and better-for-you nutrition. Fruit- and vegetable-derived fibers are widely used in beverages, dairy alternatives, bakery products and supplements.
Cereals and grains account for near 28% share, supported by beta-glucan and other cereal-based soluble fibers used in fortified foods and heart-health formulations. Legumes hold near 17% share due to high fiber density and increasing use in plant-based nutrition. Other plant sources represent near 9% share, reflecting ingredient innovation and wider use of regional crops in specialty fiber development.
BENEO increased chicory root processing at its Chile site by 20,000 metric tons to meet higher inulin demand from nutrition and beverage manufacturers.
By Application
- Food and Beverages
- Dietary Supplements
- Pharmaceuticals
- Animal Nutrition
Food and beverages dominate the soluble fibers market with near 57% share in 2024. This leadership is driven by rising use in bakery, dairy products, beverages, functional snacks and plant-based products that require fiber enrichment, sugar reduction and improved texture. Food manufacturers increasingly add soluble fibers to support digestive health claims, clean-label positioning and low-calorie formulations.
Dietary supplements account for near 22% share, supported by growing digestive health awareness and demand for gut-health products. Pharmaceuticals represent near 13% share because soluble fibers support metabolic health, cholesterol management and therapeutic formulations. Animal nutrition holds near 8% share as feed producers adopt fiber additives for digestive performance in poultry, swine and companion animals. Across applications, food and beverages remain the main growth engine due to daily consumption patterns and broad formulation flexibility.
By End Use
- Residential or Individual intake
- Commercial or Industrial use
Residential or individual intake represents a growing end-use category as consumers increasingly purchase fiber-fortified foods, supplements, beverages and digestive health products for daily wellness. Rising awareness of gut health, weight management and preventive nutrition supports demand across retail channels and direct-to-consumer wellness products.
Commercial or industrial use remains important because food manufacturers, beverage producers, supplement companies and pharmaceutical formulators use soluble fibers as functional ingredients. These users require consistency, solubility, taste neutrality, processing stability and clean-label compatibility. Industrial demand continues to expand as brands reformulate products for sugar reduction, fiber fortification and plant-based positioning.
Key Market Dynamics
Primary Market Drivers
Rising Demand for Functional and Digestive Health Foods
Growing consumer focus on gut health, immunity and weight management is increasing demand for soluble fibers in daily diets. Food manufacturers add inulin, pectin and other soluble fibers to improve digestive balance and support low-calorie product lines in beverages, dairy alternatives and snacks. Rising interest in prebiotic ingredients further strengthens consumption across functional foods. Ingredion invested in expanding capacity at its San Juan del Río plant in Mexico to support demand for core and specialty ingredients, including digestive health and prebiotic formulations.
Expanding Use in Sugar Reduction and Texture Enhancement
Soluble fibers provide sweetness, bulking and texture functions that support reduced-sugar formulations. They allow food producers to lower sugar and fat content while maintaining taste, mouthfeel and product stability. This functionality drives wider use in snacks, bakery products, dairy alternatives and beverages. Tate & Lyle expanded its polydextrose production capacity at its Nantong facility in China to meet growing global demand for soluble fibers used in food and beverage applications.
Growing Incorporation in Personalized and Preventive Nutrition
Soluble fibers are increasingly used in dietary supplements and specialized nutrition products targeting metabolic health, cholesterol control and blood glucose management. Personalized nutrition platforms promote customized fiber intake for long-term wellness. Pharmaceutical and supplement companies are increasing research and product development around targeted soluble fiber formulations. This driver strengthens demand in supplements, functional beverages and clinical nutrition products.
Key Trends & Structural Opportunities
Increasing Development of Prebiotic and Gut-Health Ingredients
Soluble fibers continue gaining traction as natural prebiotics that support gut microbiota and digestive balance. Growing research linking gut health with immunity and metabolic wellness creates opportunities for new formulations in supplements, functional beverages and fortified foods. Food brands emphasize microbiome benefits and clean-label positioning to strengthen consumer trust. Nexira expanded acacia fiber processing capacity in Rouen by 35,000 metric tons through new purification units that deliver higher-molecular-weight prebiotic fibers for beverages and supplement blends.
Rising Adoption of Plant-Based and Clean-Label Ingredients
Consumers increasingly prefer plant-based functional ingredients in dairy alternatives, fortified beverages and plant-protein foods. The clean-label movement expands demand for fruit-, vegetable- and grain-derived fibers with natural-origin claims and minimal processing. Brands are investing in transparent sourcing and sustainability-focused ingredient choices. Roquette upgraded its pea processing line at Vic-sur-Aisne with an added extraction module that raised pea fiber output by 8,000 metric tons, enabling wider use in plant-based dairy and clean-label nutrition products.
Growth of Microbiome-Focused Functional Products
Microbiome-focused product development is creating new opportunities for soluble fiber suppliers. Food, beverage and supplement brands increasingly position fiber ingredients around gut health, metabolic wellness and digestive comfort. Product launches in fortified drinks, gummies, powders, nutrition bars and dairy alternatives support stronger commercial adoption. Credence Research identifies microbiome-focused nutrition as a key opportunity as consumers seek preventive health products with recognizable plant-based ingredients.
Industry Challenges
High Cost of Extraction and Purification Processes
Commercial production of soluble fibers requires specialized extraction facilities, reliable raw material supply and controlled processing standards. These requirements increase production cost and influence pricing across food and supplement applications. Smaller food producers may struggle to adopt soluble fibers due to cost barriers, especially in price-sensitive categories. High extraction and purification costs can also limit competitive penetration in emerging markets.
Variable Supply and Functional Performance Across Sources
Different plant sources and processing methods can create variability in taste, solubility, viscosity and digestive performance. These differences complicate formulation and standardization in functional food development. Manufacturers often need additional testing and reformulation to ensure product consistency. Variability also affects scale-up, labeling claims and consumer acceptance, making ingredient standardization an important challenge for suppliers.
Detailed Regional Analysis
| Region | Market Share (%) | Strategic Regional Catalysts & Insights |
| North America | 31.4% | Global leader. Driven by functional food consumption, strong supplement demand, digestive health awareness and high consumer spending on wellness products. |
| Europe | 28.7% | Mature regional market. Supported by dietary fiber awareness, regulatory support, clean-label food development and strong use of fruit- and grain-derived fibers. |
| Asia Pacific | 27.9% | High-growth regional market. Driven by functional beverages, supplement intake, plant-based nutrition and preventive health demand across China, India and Japan. |
| Latin America | 6.4% | Developing regional market. Supported by natural ingredient demand, digestive health awareness and sugar reduction trends in Brazil, Mexico and Argentina. |
| Middle East & Africa | 5.6% | Emerging territory. Driven by urbanization, modern retail growth, fortified dairy products, functional beverages and rising wellness product availability. |
North America leads the global soluble fibers market with a 31.4% share, according to Credence Research. The region benefits from rising demand for functional foods, strong supplement consumption and increased awareness of digestive health benefits. Food manufacturers incorporate inulin, pectin and polydextrose into bakery products, dairy alternatives and beverages to support sugar reduction and gut health requirements. Growth in plant-based products and clean-label beverages strengthens adoption across the region. High consumer spending on nutrition and wellness continues to encourage innovation among food producers.
Europe accounts for 28.7% of the global soluble fibers market, supported by strong regulatory support for dietary fiber intake, large functional food consumption and emphasis on metabolic and cardiovascular health. The region benefits from established supplement markets and widespread use of fruit- and grain-derived soluble fibers in food formulations. European consumers increasingly prefer natural and prebiotic ingredients, which supports demand for inulin and pectin in plant-based nutrition. The strong presence of clean-label food companies further supports regional growth.
Asia Pacific captures 27.9% share of the global market, driven by rapid expansion in functional beverages, supplement intake and digestive health awareness across China, India and Japan. Rising disposable income and increased interest in preventive health encourage adoption of fortified foods. Strong demand for plant-based dairy alternatives and nutritional drinks increases soluble fiber application across local and multinational brands. Expanding food and beverage manufacturing capacity supports commercial use across the region.
Competitive Landscape & Recent Developments
The soluble fibers market includes leading companies such as Cargill Incorporated, Tate & Lyle PLC, Ingredion Incorporated, ADM, Roquette Frères, Nexira, Kerry Group, BENEO GmbH, DuPont Nutrition & Biosciences and Cosucra Groupe Warcoing. These companies compete through functional fiber portfolios, clean-label offerings, plant-based formulations, prebiotic ingredients and sugar-reduction solutions across global food and beverage categories.
Market leaders invest in extraction technologies, clinical validation and ingredient standardization to improve solubility, taste and nutritional performance. Strategic partnerships with food manufacturers, supplement brands and nutrition researchers help strengthen market penetration and specialized application development. Companies also increase sourcing from fruits, grains, legumes and sustainable plant materials to align with natural-ingredient and sustainability trends. Personalized nutrition and preventive wellness continue to encourage R&D in metabolic health and microbiome-focused fiber solutions.
Recent Industry Developments (2025)
- In December 2025, BENEO GmbH showcased functional ingredient solutions to boost protein and fiber in food and drinks at Fi Europe 2025, with a focus on improving nutritional profiles.
- In September 2025, DuPont Nutrition & Biosciences introduced a new range of soluble fibers with high viscosity for sugar reduction in bakery and confectionery products, enabling healthier formulations without compromising texture.
- In August 2025, ADM expanded its soluble dietary fiber portfolio with citrus- and oat-derived fibers targeting beverages and snacks.

Request a Free Sample
Fill in your details and we'll send you a free sample report.
- Sample data tables & charts
- Research methodology
Need a Custom Version of This Report?
Tailor the scope, geography, or segments to your exact requirements.
- Custom geography or segment scope
- Direct access to our analyst team
Frequently Asked Questions
What is the current and projected size of the global soluble fibers market?
What is the projected growth rate of the soluble fibers industry over the forecast period?
Which type segment holds the maximum market share within the soluble fibers industry?
Which source segment dominates the soluble fibers market?
Which application segment leads the soluble fibers market?
Which region commands the highest market share in the global soluble fibers space?
Table of Content
Chapter 1 Market Segmentation
- 1.1 Segmentation Framework
- 1.1.1 Product and Service Classification
- 1.1.2 Application and End-Use Classification
- 1.1.3 Technology and Solution Classification
- 1.1.4 Customer and Distribution Channel Classification
- 1.1.5 Geographic Segmentation
- 1.1.6 Market Segment Definitions and Boundaries
Chapter 2 Introduction
- 2.1 Report Objectives and Scope
- 2.2 Product Definition and Industry Terminology
- 2.3 Market Inclusions and Exclusions
- 2.4 Research Process
- 2.4.1 Primary Research and Expert Interviews
- 2.4.2 Secondary Research and Source Review
- 2.4.3 Top-Down and Bottom-Up Estimation
- 2.4.4 Data Triangulation and Verification
- 2.5 Market Size Measurement Basis
- 2.5.1 2024: USD 3,227.5 million → 2032: USD 5,666.83 million
- 2.6 Historical and Forecast Reference Periods
- 2.6.1 Base Year: 2024
- 2.6.2 Forecast Period: 2024-2032
- 2.7 Research Assumptions and Limitations
Chapter 3 Executive Summary
- 3.1 Market Snapshot and Key Findings
- 3.2 Base-Year Market Size, 2024
- 3.3 Forecast Market Size, 2032
- 3.4 Revenue and Volume Growth Outlook
- 3.5 Key Demand and Supply Indicators
- 3.6 Leading Market Segments
- 3.7 Fastest-Growing Market Opportunities
- 3.8 Regional Performance Highlights
- 3.9 Technology and Industry Transformation
- 3.10 Competitive Landscape Summary
- 3.11 Analyst View and Strategic Implications
Chapter 4 Global Soluble Fibers Market Trends and Developments
- 4.1 Historical Industry Development
- 4.2 Recent Market Trends and Developments
- 4.3 Demand and Customer Behavior Trends
- 4.4 Technology and Product Innovation
- 4.5 Artificial Intelligence, Automation and Digitalization
- 4.6 Local Manufacturing and Supply Chain Realignment
- 4.7 Industry Partnerships, Mergers and Acquisitions
- 4.8 Sustainability and Circular Economy Developments
- 4.9 Government and Private Sector Investment Trends
- 4.10 Emerging Business Models and Commercialization
- 4.11 Industry Developments and Announcements
Chapter 5 Global Soluble Fibers Market Production, Supply and Demand Analysis
- 5.1 Demand Trend and Consumption Analysis
- 5.2 Demand Forecast, 2024-2032
- 5.3 Production and Output Trend
- 5.4 Production and Output Forecast, 2024-2032
- 5.5 Installed Capacity and Capacity Utilization
- 5.6 Company-Wise Production Plants and Statistics
- 5.6.1 Installed Production Capacity
- 5.6.2 Actual Production
- 5.6.3 Planned Capacity and Expansion Targets
- 5.7 Supply Chain Structure and Procurement Trends
- 5.8 Supply-Demand Gap and Bottlenecks
- 5.9 Import Dependence and Sourcing Structure
- 5.10 Contract Manufacturing and Outsourcing
- 5.11 Regional Supply and Demand Concentration
Chapter 6 Global Soluble Fibers Market Pricing Analysis
- 6.1 Pricing Structure and Measurement
- 6.2 Historical Pricing Trends
- 6.3 Pricing Outlook, 2024-2032
- 6.4 Average Selling Price and Unit Economics
- 6.5 Pricing by Product and Market Segment
- 6.6 Geographic Pricing Differences
- 6.7 Key Input, Energy, Labor and Logistics Costs
- 6.8 Contract Pricing and Purchasing Models
- 6.9 Pricing Sensitivity and Competitive Positioning
- 6.10 Price, Margin and Profitability Implications
Chapter 7 Global Soluble Fibers Market Dynamics
- 7.1 Market Growth Drivers
- 7.1.1 Demand-Side Drivers
- 7.1.2 Technology and Innovation Drivers
- 7.1.3 Infrastructure and Investment Drivers
- 7.1.4 Regulatory and Policy Drivers
- 7.2 Market Restraints
- 7.2.1 Cost and Affordability Constraints
- 7.2.2 Technology and Adoption Barriers
- 7.2.3 Supply Chain and Operational Constraints
- 7.3 Market Challenges
- 7.3.1 Competitive Pressure and Margin Erosion
- 7.3.2 Skills, Infrastructure and Implementation Gaps
- 7.4 Emerging Market Opportunities
- 7.5 Market Dynamics Impact and Time-Horizon Assessment
Chapter 8 Global Soluble Fibers Value Chain Analysis
- 8.1 Industry Value Chain Overview
- 8.2 Upstream Suppliers and Critical Inputs
- 8.3 Technology and Component Providers
- 8.4 Manufacturing or Service Delivery
- 8.5 Distribution, Channel Partners and Integrators
- 8.6 Downstream Applications and End Users
- 8.7 Value Addition and Profit Pools
- 8.8 Vertical Integration and Outsourcing
- 8.9 Supplier Concentration and Risk
- 8.10 Supply Chain Localization and Resilience
Chapter 9 Global Soluble Fibers Market Regulations and Policies
- 9.1 Relevant Laws, Standards and Compliance Frameworks
- 9.2 Product, Service, Safety and Quality Requirements
- 9.3 Government Policies, Incentives and Subsidies
- 9.4 Imports, Exports and Trade Barriers
- 9.5 Public Procurement and Local Content Requirements
- 9.6 Environmental and Sustainability Compliance
- 9.7 Upcoming Policy Changes and Market Implications
Chapter 10 Global Soluble Fibers Market Hotspots and Opportunities
- 10.1 Market Opportunity Mapping and Growth Hotspots
- 10.2 High-Growth Applications and Customer Groups
- 10.3 Underserved Markets and White-Space Opportunities
- 10.4 Emerging Technology and Product Opportunities
- 10.5 New Capacity and Investment Hotspots
- 10.6 Market Entry and Expansion Opportunities
- 10.7 Distribution and Partnership Opportunities
- 10.8 Near-Term and Long-Term Commercial Potential
- 10.9 Opportunity Attractiveness and Execution Risks
Chapter 11 Global Soluble Fibers Market Outlook, 2024-2032
- 11.1 Market Size and Analysis
- 11.1.1 Revenue (Market Measurement: 2024: USD 3,227.5 million → 2032: USD 5,666.83 million)
- 11.1.2 Market Volume and Quantity Sold
- 11.1.3 Historical Market Size
- 11.1.4 Base-Year Market Size, 2024
- 11.2 Market Forecast, 2024-2032
- 11.2.1 Revenue Forecast to 2032
- 11.2.2 Volume Forecast to 2032
- 11.2.3 CAGR and Year-on-Year Growth
- 11.2.4 Incremental Revenue Opportunity
- 11.3 Forecast Assumptions and Scenario Analysis
- 11.3.1 Base-Case Forecast
- 11.3.2 Optimistic and Conservative Scenarios
- 11.3.3 Technology, Pricing and Policy Sensitivities
- 11.4 Market Attractiveness and Growth Outlook
Chapter 12 Global Soluble Fibers Market Segmentation and Outlook
- 12.1 Segmentation Summary and Market Shares, 2024
- 12.2 Largest and Fastest-Growing Segments
- 12.3 Segment Growth Comparison
- 12.4 Segment Attractiveness and Priority Matrix
Chapter 13 Global Soluble Fibers Geographic Market Outlook, 2024-2032
- 13.1 Regional Market Size and Share, 2024
- 13.2 Regional Market Forecast, 2024-2032
- 13.3 Regional Pricing, Production and Demand Differences
- 13.4 North America
- 13.4.1 United States
- 13.4.2 Canada
- 13.4.3 Mexico
- 13.5 Europe
- 13.5.1 Germany
- 13.5.2 France
- 13.5.3 Italy
- 13.5.4 United Kingdom
- 13.5.5 Spain
- 13.5.6 Poland
- 13.5.7 Russia
- 13.5.8 Netherlands
- 13.5.9 Belgium
- 13.5.10 Sweden
- 13.5.11 Denmark
- 13.5.12 Norway
- 13.5.13 Rest of Europe
- 13.6 Asia Pacific
- 13.6.1 China
- 13.6.2 India
- 13.6.3 Japan
- 13.6.4 South Korea
- 13.6.5 Thailand
- 13.6.6 Indonesia
- 13.6.7 Vietnam
- 13.6.8 Malaysia
- 13.6.9 Australia
- 13.6.10 Rest of Asia Pacific
- 13.7 Latin America
- 13.7.1 Brazil
- 13.7.2 Argentina
- 13.7.3 Colombia
- 13.7.4 Chile
- 13.7.5 Rest of Latin America
- 13.8 Middle East
- 13.8.1 Saudi Arabia
- 13.8.2 United Arab Emirates
- 13.8.3 Turkey
- 13.8.4 Israel
- 13.8.5 Iran
- 13.8.6 Rest of the Middle East
- 13.9 Africa
- 13.9.1 South Africa
- 13.9.2 Egypt
- 13.9.3 Nigeria
- 13.9.4 Morocco
- 13.9.5 Rest of Africa
- 13.10 Regional Investment, Policy and Supply Chain Differences
- 13.11 Regional Competitive Landscape
- 13.12 Geographic Growth Hotspots
Chapter 14 Global Soluble Fibers Technology, Innovation and Sustainability Outlook
- 14.1 Technology Landscape and Maturity
- 14.2 Product, Process and Service Innovation
- 14.3 AI, Automation and Digital Tools in the Industry
- 14.4 Technology Adoption and Performance Benchmarking
- 14.5 Innovation Pipeline and R&D Investment
- 14.6 Patent and Intellectual Property Trends
- 14.7 Energy Efficiency and Resource Management
- 14.8 Sustainability, Recycling and Circularity
- 14.9 Technology Roadmap, 2024-2032
- 14.10 Risks of Obsolescence and Technology Substitution
Chapter 15 Global Soluble Fibers Market Key Strategic Imperatives
- 15.1 Growth and Market Entry Priorities
- 15.2 High-Return Products and Segments
- 15.3 Pricing, Profitability and Cost Optimization
- 15.4 Technology Investment and Product Differentiation
- 15.5 Supply Chain Localization and Resilience
- 15.6 Distribution and Customer Acquisition
- 15.7 Partnership, Acquisition and Capacity Strategy
- 15.8 Regional Expansion Priorities
- 15.9 Short-, Medium- and Long-Term Actions
Chapter 16 Competition Outlook
- 16.1 Industry Competition Characteristics
- 16.2 Market Structure and Concentration
- 16.3 Market Share and Competitive Positioning, 2024
- 16.4 Company-Wise Revenue and Product Benchmarking
- 16.5 Production and Service Capacity Benchmarking
- 16.6 Technology, Pricing and Differentiation
- 16.7 Regional Footprint and Distribution Strength
- 16.8 Mergers, Acquisitions and Strategic Alliances
- 16.9 New Entrants and Competitive Threats
- 16.10 Porter's Five Forces and Industry Attractiveness
- 16.11 Competitive Outlook, 2024-2032
Chapter 17 Company Profiles
- 17.1 Company Coverage and Selection Criteria
- 17.2 Leading Market Participants – Standard Profile Structure
- 17.2.1 Business Description
- 17.2.2 Company Ownership and Geographic Presence
- 17.2.3 Product and Service Portfolio
- 17.2.4 Manufacturing and Operating Footprint
- 17.2.5 Production Capacity and Expansion Plans
- 17.2.6 Financial Performance and Investment
- 17.2.7 Market Share and Competitive Position
- 17.2.8 Technology and Innovation Capabilities
- 17.2.9 Strategic Alliances or Partnerships
- 17.2.10 Recent Developments
- 17.2.11 Growth Strategy and Outlook
- 17.3 Other Relevant Market Participants
Note: Every listed company is profiled on the structure shown under the first company. The company list is preliminary and may change based on research findings, market developments, data availability and client requirements.
Chapter 18 Disclaimer
- 18.1 Research and Forecast Disclaimer
- 18.2 Data Source and Estimation Limitations
Note: The depth of individual sections depends on data availability for this market. Volume, capacity, trade and other unit-based metrics are included where applicable.