
Digital Pathology Image Analysis Market
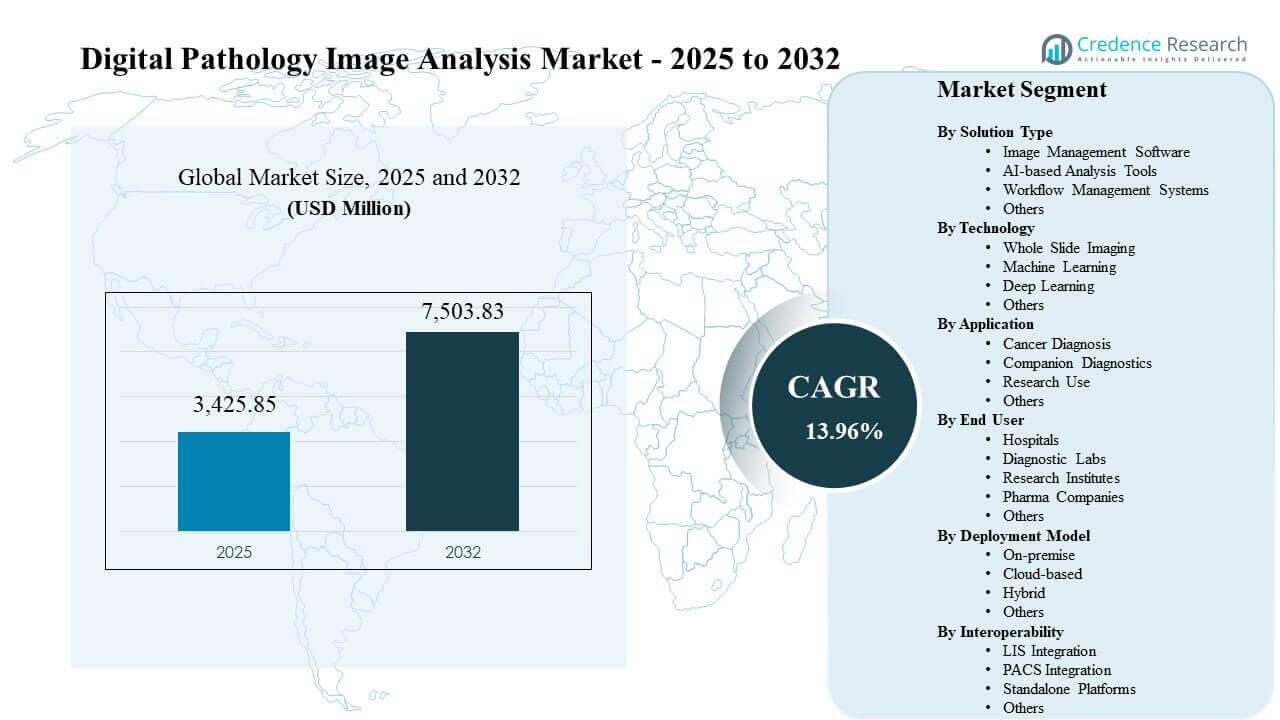
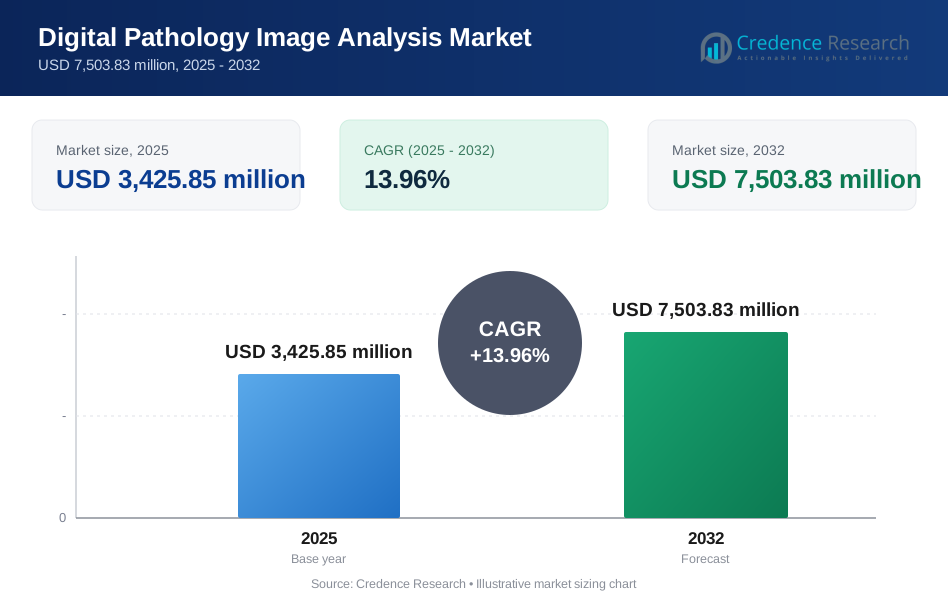
The global Digital Pathology Image Analysis Market size was estimated at USD 3,425.85 million in 2025 and is expected to reach USD 7,503.83 million by 2032, growing at a CAGR of 13.96% from 2025 to 2032. Growth is anchored in the shift from manual microscopy to algorithm-assisted workflows that improve consistency, expand quantitative biomarker scoring, and support faster case review under increasing workload pressure. Adoption also accelerates as enterprise pathology programs standardize digital slide access across multi-site hospital networks and research collaborations, supporting broader utilization of image analysis in oncology and translational studies.
| REPORT ATTRIBUTE | DETAILS |
|---|---|
| Historical Period | 2021-2024 |
| Base Year | 2025 |
| Forecast Period | 2026-2032 |
| Digital Pathology Image Analysis Market Size 2025 | USD 3,425.85 million |
| Digital Pathology Image Analysis Market, CAGR | 13.96% |
| Digital Pathology Image Analysis Market Size 2032 | USD 7,503.83 million |
Key Market Trends & Insights
- The Digital Pathology Image Analysis Market is projected to expand from USD 3,425.85 million (2025) to USD 7,503.83 million (2032), reflecting a 13.96% CAGR (2025–2032).
- North America accounted for 46.80% share in 2025, supported by higher digital pathology penetration and earlier commercialization of clinical-grade software.
- AI-based Analysis Tools held the leading share of 39.60% in 2025 as laboratories prioritized automated quantification and decision-support capabilities.
- Cancer Diagnosis represented 48.90% share in 2025, reflecting the concentration of high-volume oncology workloads and biomarker-driven pathways.
- Hospitals led end-user adoption with a 44.70% share in 2025 as integrated delivery networks scaled standardized image access and reporting.
Segment Analysis
Digital pathology image analysis demand is shaped by the need to standardize tissue interpretation, improve turnaround time, and expand quantitative outputs for high-impact diagnostic use cases. Laboratory leaders increasingly evaluate platforms based on workflow fit, scalability for whole-slide file volumes, and evidence that analytics improves reproducibility across sites and readers. Adoption remains strongest where organizations can operationalize validation, change management, and governance requirements without disrupting routine operations.
Buying behavior also reflects a shift toward connected ecosystems that link scanning, image management, and computational pathology applications. Clinical and research stakeholders value interoperability with laboratory workflows and enterprise imaging strategies, particularly when distributed review and collaboration are required. Cloud enablement is gaining attention for remote access and multi-site standardization, although data residency, privacy rules, and institutional policies continue to influence deployment decisions.
By Solution Type Insights
AI-based Analysis Tools accounted for the largest share of 39.60% in 2025. Leadership is reinforced by rising demand for automated tissue feature extraction and quantitative scoring to improve reproducibility across readers and sites. Laboratories also prioritize solutions that reduce manual review burden and improve throughput during peak oncology volumes. Platform strategies that connect image management and algorithms in a unified workflow further strengthen adoption.
By Technology Insights
Digital Pathology Image Analysis Market technology adoption is shaped by digitization readiness and the ability to operationalize computational workflows at scale. Whole-slide imaging expands accessible image volumes and creates a foundation for machine learning and deep learning pipelines. Machine learning supports classification and segmentation tasks that improve standardized scoring across routine and research workflows. Deep learning adoption expands where validation frameworks and compute capacity support consistent performance across diverse slide conditions.
By Application Insights
Cancer Diagnosis accounted for the largest share of 48.90% in 2025. Leadership reflects the strong fit between oncology workflows and quantitative tissue analytics that improves consistency in biomarker interpretation. Clinical programs benefit when image analysis supports standardized reporting and supports multi-site care delivery. The Digital Pathology Image Analysis Market also sees expanding traction in trial-related pathology workflows where quantitative endpoints improve comparability.
By End User Insights
Hospitals accounted for the largest share of 44.70% in 2025. Hospital adoption is supported by integrated pathology programs that prioritize standardized workflows, traceability, and quality control across multi-site operations. Hospital-based teams also benefit from remote consultation and distributed review capabilities that improve service continuity. Health system procurement favors platforms that integrate smoothly with laboratory operations and support scalable enterprise deployment.
By Deployment Model Insights
Digital Pathology Image Analysis Market deployment decisions typically balance governance requirements with scalability needs. On-premise models remain important where strict data residency rules and local performance constraints shape architecture choices. Cloud-based models gain traction when multi-site access, centralized archives, and elastic compute improve operational flexibility. Hybrid approaches expand when compute-intensive analytics is managed locally while storage and collaboration services are centralized.
By Interoperability Insights
Interoperability is a central purchasing theme in the Digital Pathology Image Analysis Market because digital pathology sits between laboratory workflows and enterprise imaging governance. LIS integration supports specimen-to-report traceability and reduces re-entry burden across operational steps. PACS integration aligns pathology images with broader enterprise imaging strategies and centralized governance. Standalone platforms continue to appear in research-heavy environments and smaller laboratories that prioritize rapid deployment and specialized analytics.
Digital Pathology Image Analysis Market Drivers
Rising oncology workloads and biomarker-driven care pathways
Digital Pathology Image Analysis Market growth is supported by increasing oncology testing volumes and the need for consistent biomarker interpretation. Quantitative scoring improves reproducibility across pathologists, sites, and trials, supporting more standardized decision-making. Laboratory leaders also value analytics for workflow quality control and case triage to manage rising throughput demands. The shift toward companion diagnostics reinforces demand for validated algorithms integrated into routine pathology workflows.
- For instance, Roche’s uPath HER2 image analysis algorithm for breast cancer standardizes interpretation into the clinically used HER2 scoring bands of 0, 1+, 2+, and 3+, helping laboratories align digital scoring with routine biomarker-driven care pathways.
Operational pressure on pathology services and the need for productivity gains
Pathology services face capacity constraints that drive adoption of tools that reduce manual review effort and improve turnaround time. Digital Pathology Image Analysis Market deployments often prioritize analytics that automate segmentation, counting, and scoring tasks that consume specialist time. Centralized review and remote access support distributed staffing models and multi-site networks. Efficiency benefits are strongest where workflow design includes change management, training, and quality assurance.
- For instance, Leica Biosystems states that its Aperio GT 450 DX can load 450 slides and scan up to 81 slides per hour at 40×, a throughput benchmark that directly supports high-volume laboratories seeking measurable productivity gains.
Expansion of translational research and clinical trial digitalization
Biopharma and research institutes increasingly rely on digitized tissue workflows to scale studies and standardize endpoints. Digital Pathology Image Analysis Market usage grows when research programs require consistent quantification across cohorts and sites. Image analysis supports biomarker discovery, patient stratification, and response monitoring using repeatable computational outputs. Integrated ecosystems that connect scanners, image management, and validated analytics reduce friction and expand research throughput.
Platform ecosystem maturation and better integration across workflows
Ecosystem strategies help laboratories operationalize image analysis across diverse environments and vendor stacks. Digital Pathology Image Analysis Market adoption improves when solutions support interoperability and standardized data handling across acquisition, storage, and analytics layers. Vendors increasingly differentiate through deployment support, lifecycle management, and validated app distribution models. These capabilities reduce complexity for buyers and accelerate enterprise rollouts across health systems and reference labs.
Digital Pathology Image Analysis Market Challenges
Digital Pathology Image Analysis Market scaling is constrained by validation timelines and the operational burden of changing routine workflows. Laboratories must establish governance, quality control, and performance monitoring for analytics outputs across varied stains, scanners, and slide conditions. Data privacy and residency requirements can slow cloud adoption and complicate cross-site collaboration. Budget constraints and the need for clear return-on-investment evidence can also delay procurement in cost-sensitive settings.
- For instance, Paige reported in the clinical study submitted to the U.S. FDA for Paige Prostate that pathologists improved sensitivity from 89.5% to 96.8%, reduced false-negative diagnoses by 70%, and reduced false-positive diagnoses by 24%, highlighting the level of quantified validation evidence laboratories increasingly require before integrating AI into routine diagnostic workflows.
Interoperability gaps and fragmented systems remain persistent obstacles for broad implementation. Digital Pathology Image Analysis Market deployments often require integration across LIS, storage, scanners, and reporting environments, increasing project scope and timeline risk. Whole-slide files drive heavy storage and network demands that raise total cost of ownership. Variation in reimbursement and regulatory expectations across countries adds uncertainty for multi-region expansion strategies.
Digital Pathology Image Analysis Market Trends and Opportunities
AI operationalization is shifting from pilot projects to scalable enterprise deployments that emphasize traceability, monitoring, and consistent performance management. Digital Pathology Image Analysis Market buyers increasingly seek platforms that support validated algorithm use across multiple sites, including centralized policy control and audit-ready workflows. Multi-site collaborations and remote review models are expanding routine utilization and strengthening the business case. Standardized data models and open ecosystems create opportunities for broader app adoption.
- For instance, Philips states that more than 35 pathology labs are already using its digital pathology solution in combination with Ibex AI, and that the combined setup has delivered productivity gains of up to 37%.
Cloud and hybrid strategies are creating new opportunities for remote access, centralized archives, and elastic compute for analytics workloads. Digital Pathology Image Analysis Market vendors can win by offering deployment flexibility and governance-ready architectures that fit institutional constraints. Growth opportunities also expand through partnerships that connect companion diagnostics, trial pathology, and computational biomarker pipelines. Emerging markets present upside where digitization accelerates in leading urban centers and reference laboratories.
Regional Insights
North America
Digital Pathology Image Analysis Market leadership in North America reflects earlier commercialization of digital pathology software, a larger installed base of enterprise healthcare systems, and stronger alignment with biomarker-driven oncology workflows. North America accounted for 46.80% share in 2025, supported by high adoption of standardized quality programs and multi-site review requirements. Procurement patterns often favor integrated ecosystems that connect scanning, image management, and validated analytics. Clinical and research demand is reinforced by translational programs and trial-related pathology use cases.
Europe
Digital Pathology Image Analysis Market demand in Europe is supported by strong academic pathology networks and structured healthcare systems that emphasize standardization and careful validation. Europe held 25.90% share in 2025, with adoption stronger in health systems that prioritize cross-site collaboration and harmonized reporting. Buyers tend to focus on interoperability, compliance readiness, and long-term operating efficiency. Expansion is also influenced by country-level procurement models and variation in digital health pathways.
Asia Pacific
Digital Pathology Image Analysis Market growth in Asia Pacific is supported by large pathology volumes, expanding hospital modernization programs, and rising oncology burden. Asia Pacific held 20.80% share in 2025, with adoption concentrated in major urban centers and large diagnostic networks. Scaling depends on infrastructure maturity, budget capacity, and the ability to integrate analytics into routine workflows. Cloud and hybrid strategies can support distributed review models where specialist access remains uneven across geographies.
Latin America
Digital Pathology Image Analysis Market adoption in Latin America remains concentrated in large reference laboratories and leading hospital groups. Latin America accounted for 3.90% share in 2025, reflecting slower enterprise conversion and tighter capital budgets. Deployments often prioritize targeted use cases that provide measurable workflow improvements. Growth potential increases where national cancer programs and private diagnostic networks invest in digitization and standardized reporting.
Middle East & Africa
Digital Pathology Image Analysis Market uptake in the Middle East & Africa is anchored in selective deployments across well-funded healthcare hubs. Middle East & Africa represented 2.60% share in 2025, with growth influenced by investment cycles, infrastructure readiness, and specialist availability. Adoption improves where institutions use digital workflows to enable remote consultation and cross-site collaboration. Procurement decisions typically emphasize governance, reliability, and long-term support capabilities.
Competitive Landscape
Digital Pathology Image Analysis Market competition centers on platform breadth, enterprise deployment capability, and the ability to integrate analytics into laboratory workflows without operational disruption. Vendors compete through ecosystem strategies that connect scanning, image management, and computational pathology applications while supporting interoperability requirements. Differentiation also comes from validated algorithm libraries, deployment flexibility across on-premise and cloud environments, and services that accelerate implementation and workflow standardization.
Philips Healthcare competes through enterprise digital pathology workflows designed to support scalable image access, consistent review practices, and integration-ready deployments across hospital networks. Philips Healthcare positioning commonly emphasizes workflow standardization and the ability to support broad clinical and research use cases through platform partnerships. Philips Healthcare strategy aligns with health system buyers that prioritize governance, traceability, and multi-site collaboration. Philips Healthcare deployments benefit when ecosystems connect scanning, storage, and analytics layers with operational support for change management.
The industry research and growth report includes detailed analyses of the competitive landscape of the market and information about key companies, including:
- Philips Healthcare
- Roche Diagnostics
- Leica Biosystems
- Indica Labs
- Proscia
- Sectra
- Visiopharm
- Hamamatsu Photonics
- 3DHISTECH
- Inspirata
Qualitative and quantitative analysis of companies has been conducted to help clients understand the wider business environment as well as the strengths and weaknesses of key industry players. Data is qualitatively analyzed to categorize companies as pure play, category-focused, industry-focused, and diversified; it is quantitatively analyzed to categorize companies as dominant, leading, strong, tentative, and weak.
Recent Developments
- In March 2026, Leica Biosystems expanded its clinical software offering with Aperio HALO AP Dx, developed in partnership with Indica Labs, to provide an integrated digital pathology image management and primary diagnosis solution that fits into a broader AI‑enabled pathology ecosystem.
- In January 2026, AstraZeneca announced an agreement to acquire Modella AI, a developer of multimodal and agentic AI foundation models, to embed advanced AI‑driven pathology and imaging analytics into its oncology R&D programs and support biomarker discovery and clinical development that relies on rich pathology image analysis.
- In August 2025, Evident finalized the acquisition of Pramana, Inc., a digital pathology company specializing in autonomous whole‑slide imaging systems, to fuse Evident’s microscopy strengths with Pramana’s digital pathology and analysis technologies and thereby advance “digital pathology 2.0” capabilities.
- In August 2025, Tempus AI announced the acquisition of Paige, an AI company specializing in digital pathology, in an approximately 81 million dollar deal to expand Tempus’s dataset, bolster its technical team, and secure industry‑leading AI pathology tools for image‑based cancer analysis.
Report Scope
| Report Attribute | Details |
| Market size value in 2025 | USD 3,425.85 million |
| Revenue forecast in 2032 | USD 7,503.83 million |
| Growth rate (CAGR) | 13.96% (2025–2032) |
| Base year | 2025 |
| Forecast period | 2026–2032 |
| Quantitative units | USD million |
| Segments covered | By Solution Type Outlook: Image Management Software, AI-based Analysis Tools, Workflow Management Systems, Others; By Technology Outlook: Whole Slide Imaging, Machine Learning, Deep Learning, Others; By Application Outlook: Cancer Diagnosis, Companion Diagnostics, Research Use, Others; By End User Outlook: Hospitals, Diagnostic Labs, Research Institutes, Pharma Companies, Others; By Deployment Model Outlook: On-premise, Cloud-based, Hybrid, Others; By Interoperability Outlook: LIS Integration, PACS Integration, Standalone Platforms, Others |
| Regional scope | North America, Europe, Asia Pacific, Latin America, Middle East & Africa |
| Key companies profiled | Philips Healthcare, Roche Diagnostics, Leica Biosystems, Indica Labs, Proscia, Sectra, Visiopharm, Hamamatsu Photonics, 3DHISTECH, Inspirata |
| No. of Pages | 346 |
Segmentation
By Solution Type
- Image Management Software
- AI-based Analysis Tools
- Workflow Management Systems
- Others
By Technology
- Whole Slide Imaging
- Machine Learning
- Deep Learning
- Others
By Application
- Cancer Diagnosis
- Companion Diagnostics
- Research Use
- Others
By End User
- Hospitals
- Diagnostic Labs
- Research Institutes
- Pharma Companies
- Others
By Deployment Model
- On-premise
- Cloud-based
- Hybrid
- Others
By Interoperability
- LIS Integration
- PACS Integration
- Standalone Platforms
- Others
By Region
- North America
- Europe
- Asia Pacific
- Latin America
- Middle East and Africa
Request a Free Sample
Fill in your details and we'll send you a free sample report.
- Sample data tables & charts
- Research methodology
Need a Custom Version of This Report?
Tailor the scope, geography, or segments to your exact requirements.
- Custom geography or segment scope
- Direct access to our analyst team
Frequently Asked Questions
What is the market size of the Digital Pathology Image Analysis Market in 2025 and the forecast for 2032?
What is the CAGR for the Digital Pathology Image Analysis Market during 2025–2032?
What is the largest segment in 2025 within the Digital Pathology Image Analysis Market?
What factors are driving growth in the Digital Pathology Image Analysis Market?
Which companies are leading in the Digital Pathology Image Analysis Market?
Which region leads the Digital Pathology Image Analysis Market in 2025?
Table of Content
Chapter 1. Report Introduction
- 1.1 Report Description & Purpose
- 1.1.1 Report Title & Market Definition
- 1.1.2 Unique Selling Propositions (USP) & Key Differentiators
- 1.1.3 Value Proposition for Stakeholders
- 1.2 Research Objectives
- 1.2.1 Market Sizing Objectives (Volume & Revenue)
- 1.2.2 Segmentation Objectives
- 1.2.3 Competitive Intelligence Objectives
- 1.2.4 Forecast & Scenario Objectives
- 1.3 Report Scope
- 1.3.1 Digital Pathology Image Analysis Scope – Types & Subtypes Covered
- 1.3.2 Geographic Scope – Regions & Countries Covered
- 1.3.3 Historical Period, Base Year & Forecast Period (2025; forecast to 2032)
- 1.3.4 Inclusions & Exclusions
- 1.4 HS Code & Classification Framework
- 1.5 Currency, Units & Pricing Basis
- 1.6 Target Stakeholders
- 1.7 Limitations & Assumptions
Chapter 2. Executive Summary
- 2.1 Global Digital Pathology Image Analysis Market Snapshot
- 2.1.1 Market Size – Historical (2025) & Forecast (2025-2032) (2025: USD 3,425.85 million → 2032: USD 7,503.83 million)
- 2.1.2 Volume & Revenue – Global Totals
- 2.1.3 Key Market Highlights – Top Five Facts
- 2.2 Digital Pathology Image Analysis Market Segmentation Snapshot
- 2.2.1 Market Split by Region – 2025 vs. 2032
- 2.3 Competitive Snapshot
- 2.3.1 Top 10 Players by Revenue Share – 2025
- 2.3.2 Top 10 Players by Volume Share – 2025
- 2.3.3 Recent Strategic Developments (18-Month Summary)
- 2.4 Key Investment Highlights & Strategic Conclusions
Chapter 3. Digital Pathology Image Analysis Market Dynamics & Industry Analysis
- 3.1 Market Overview & Context
- 3.1.1 Digital Pathology Image Analysis Market Position in the Broader Automotive Value Chain
- 3.1.2 OEM vs. Replacement Market Dynamics
- 3.1.3 Market Maturity & Development Stage by Region
- 3.2 Digital Pathology Image Analysis Market Drivers
- 3.3 Digital Pathology Image Analysis Market Restraints & Challenges
- 3.4 Digital Pathology Image Analysis Market Opportunities
- 3.5 Porter's Five Forces Analysis
- 3.5.1 Threat of New Entrants
- 3.5.2 Bargaining Power of Suppliers
- 3.5.3 Bargaining Power of Buyers
- 3.5.4 Threat of Substitutes
- 3.5.5 Competitive Rivalry – Intensity Assessment
- 3.6 Digital Pathology Image Analysis Value Chain Analysis
- 3.6.1 Upstream – Raw Material/Input Suppliers
- 3.6.1.1 Raw Material/Input 1
- 3.6.1.2 Raw Material/Input 2
- 3.6.1.3 Raw Material/Input 3
- 3.6.2 Midstream – Production/Manufacturing/Service Delivery
- 3.6.2.1 Production/Process Overview
- 3.6.2.2 Key Facility Locations & Capacity by Manufacturer
- 3.6.3 Downstream – Distribution & End Consumer
- 3.6.3.1 Primary Channel – B2B/OEM
- 3.6.3.2 Secondary Channels – Dealer, Retail, Online, Direct
- 3.6.4 Value Chain Profitability Analysis
- 3.6.1 Upstream – Raw Material/Input Suppliers
- 3.7 PESTEL Analysis
- 3.7.1 Political Factors
- 3.7.2 Economic Factors
- 3.7.3 Social Factors
- 3.7.4 Technological Factors
- 3.7.5 Environmental Factors
- 3.7.6 Legal Factors
- 3.8 Digital Pathology Image Analysis Supply Chain Analysis
- 3.8.1 Raw Material/Input Supply Risk Assessment
- 3.8.2 Manufacturing Concentration Risk (Geographic Exposure)
- 3.8.3 Trade Disruption Impact Analysis
- 3.9 Regulatory & Policy Landscape
Note: The regulatory and policy landscape section covers regulations based on their applicability to the market, Digital Pathology Image Analysis category, geography, and scope of the study. Only regulatory frameworks with a material impact on operations, compliance, trade, sustainability, or market access are analyzed in detail.
Chapter 4. Key Investment Pockets & Opportunity Analysis
- 4.1 Digital Pathology Image Analysis Market Attractiveness Analysis
- 4.1.1 By Region – Investment Attractiveness Matrix (Volume × CAGR)
- 4.2 Absolute Revenue Growth Opportunity
- 4.2.1 By Region – Absolute USD Growth Through 2032
- 4.3 Incremental Volume Opportunity
- 4.3.1 By Region – Incremental Volume Through 2032
- 4.3.2 Segment – Incremental Volume
- 4.4 Emerging Submarket Opportunity Deep Dive (Subject to Applicability)
- 4.5 Emerging Market Opportunity Scorecards
- 4.5.1 United States
- 4.5.2 Europe
- 4.5.3 Asia
- 4.5.4 Middle East & Africa
Note: Emerging Market Opportunity Scorecards will be included based on relevance and strategic importance. Regions listed are indicative and may vary depending on data availability and market dynamics.
Chapter 5. Digital Pathology Image Analysis Import-Export Analysis & Trade Flows
- 5.1 Global Trade Overview
- 5.1.1 Global Export Value by Country (2025)
- 5.1.2 Global Export Volume by Country (2025)
- 5.1.3 Global Import Value by Country (2025)
- 5.1.4 Global Import Volume by Country (2025)
- 5.1.5 Net Trade Balance by Country (2025)
- 5.2 Export Analysis – Segment
- 5.2.1 Type 1 (HS Code)
- 5.2.2 Type 2 (HS Code)
- 5.2.3 Type 3 (HS Code)
- 5.2.4 Type 4 (HS Code)
- 5.2.5 Type 5 (HS Code)
- 5.3 Import Analysis – Segment
- 5.3.1 Type 1 (HS Code)
- 5.3.2 Type 2 (HS Code)
- 5.3.3 Type 3 (HS Code)
- 5.3.4 Type 4 (HS Code)
- 5.3.5 Type 5 (HS Code)
- 5.4 Average Unit Trade Prices
- 5.4.1 Average Export Price – Segment & Country
- 5.4.2 Average Import Price – Segment & Source Country
- 5.4.3 Price Trends (2025)
- 5.5 Key Trade Route Analysis
- 5.5.1 Trade Route 1
- 5.5.2 Trade Route 2
- 5.5.3 Trade Route 3
- 5.5.4 Trade Route 4
- 5.5.5 Trade Route 5
- 5.6 Trade Policy Impact Assessment
- 5.6.1 US Anti-Dumping & Section 301 Tariffs
- 5.6.2 EU Customs Union Impact
- 5.6.3 Major Free Trade Agreements
- 5.6.4 USMCA Rules of Origin
Note: Trade policy analysis will be included only where relevant to the Digital Pathology Image Analysis market.
Chapter 6. Competitive Landscape & Company Benchmarking
- 6.1 Digital Pathology Image Analysis Market Concentration & Structure
- 6.1.1 Herfindahl-Hirschman Index (HHI) – vs. 2025
- 6.1.2 Tier 1, Tier 2 & Tier 3 Market Structure
- 6.1.3 Global, Regional & Local Player Dynamics
- 6.2 Digital Pathology Image Analysis Market Share Analysis – 2025
- 6.2.1 Global Revenue Share by Company
- 6.2.2 Global Volume Share by Company
- 6.2.3 Regional Revenue Share
- 6.2.4 Market Share Evolution ( vs. 2025)
- 6.2.5 OEM Segment Share by Company
- 6.2.6 Replacement Segment Share by Company
- 6.3 Production/Delivery Capacity & Facility Analysis
- 6.3.1 Global Installed Capacity
- 6.3.2 Capacity Utilization Rates
- 6.3.3 Production/Output Volume
- 6.3.4 Facility Locations & Capacity Map
- 6.3.5 Planned Capacity Additions
- 6.4 Digital Pathology Image Analysis Competitive Benchmarking Matrix
- 6.4.1 Revenue, Volume, CAGR & Profitability Comparison
- 6.4.2 Channel Revenue Mix
- 6.4.3 Geographic Revenue Exposure
- 6.4.4 R&D Intensity
- 6.4.5 Sustainability Maturity
- 6.5 Strategic Developments in Digital Pathology Image Analysis (Last 24 Months)
- 6.5.1 Mergers, Acquisitions & Divestments
- 6.5.2 New Digital Pathology Image Analysis Launches
- 6.5.3 Facility Expansions
- 6.5.4 Strategic Alliances, Joint Ventures & Partnerships
- 6.5.5 Distribution Expansion & Market Entry
- 6.5.6 Sustainability & ESG Initiatives
- 6.6 Competitive Strategy Mapping
- 6.6.1 Leader, Challenger, Follower & Niche Classification
- 6.6.2 Pricing Strategy Comparison
- 6.6.3 Channel Strategy Matrix
Note: Strategic developments are included based on their materiality and the availability of reliable information.
Chapter 7. Global Digital Pathology Image Analysis Market – By Distribution Channel
- 7.1 Segment Overview
- 7.1.1 Volume & Revenue Split by Channel (2025 & 2032)
- 7.1.2 Channel Mix Evolution (2025-2032)
Chapter 8. Regional Market Analysis – Global Overview
- 8.1 Global Regional Overview
- 8.1.1 Regional Volume Share
- 8.1.2 Regional Revenue Share
- 8.1.3 Regional Volume by Region
- 8.1.4 Regional Revenue by Region
- 8.1.5 Regional Forecast Through 2032
- 8.2 Cross-Regional Segment Analysis
- 8.2.1 By Distribution Channel
- 8.2.2 By Brand/Price Tier
Chapter 9. North America Digital Pathology Image Analysis Market
- 9.1 United States
- 9.2 Canada
- 9.3 Mexico
Chapter 10. Europe Digital Pathology Image Analysis Market
- 10.1 Germany
- 10.2 France
- 10.3 Italy
- 10.4 United Kingdom
- 10.5 Spain
- 10.6 Poland
- 10.7 Russia
- 10.8 Netherlands
- 10.9 Belgium
- 10.10 Sweden
- 10.11 Denmark
- 10.12 Norway
- 10.13 Rest of Europe
Chapter 11. Asia Pacific Digital Pathology Image Analysis Market
- 11.1 China
- 11.2 India
- 11.3 Japan
- 11.4 South Korea
- 11.5 Thailand
- 11.6 Indonesia
- 11.7 Vietnam
- 11.8 Malaysia
- 11.9 Australia
- 11.10 Rest of Asia Pacific
Chapter 12. Latin America Digital Pathology Image Analysis Market
- 12.1 Brazil
- 12.2 Argentina
- 12.3 Colombia
- 12.4 Chile
- 12.5 Rest of Latin America
Chapter 13. Middle East Digital Pathology Image Analysis Market
- 13.1 Saudi Arabia
- 13.2 United Arab Emirates
- 13.3 Turkey
- 13.4 Israel
- 13.5 Iran
- 13.6 Rest of the Middle East
Chapter 14. Africa Digital Pathology Image Analysis Market
- 14.1 South Africa
- 14.2 Egypt
- 14.3 Nigeria
- 14.4 Morocco
- 14.5 Rest of Africa
Chapter 15. Digital Pathology Image Analysis Company Profiles
- 15.1 [Company 01]
- 15.1.1 Company Overview
- 15.1.2 Key Management Personnel
- 15.1.3 Products & Services Portfolio
- 15.1.4 Financial Performance
- 15.1.5 Key Market Focus & Geographic Presence
- 15.1.6 Recent Developments & Strategic Initiatives
Note: The company profile list is preliminary and may change based on research findings, market developments, data availability, and client requirements.
Chapter 16. Appendices
- Appendix A – List of Abbreviations & Acronyms
- Appendix B – Industry Classification Code Reference – Full Series
- Appendix C – Production & Capacity Data Tables
- Appendix D – End-Use & Demand Base Tables
- Appendix E – Consumption & Replacement Rate Assumptions
- Appendix F – ASP Reference Tables
- Appendix G – Manufacturing & Facility Database
- Appendix H – Import-Export Data Tables
- Appendix I – Regulatory Summary Tables
- Appendix J – Primary Research Participant List (Anonymized)
- Appendix K – Primary Research Questionnaire Framework
- Appendix L – Data Sources & Bibliography
- Appendix M – Market Size Divergence & Source Comparison
Chapter 17. Research Methodology
- 17.1 Research Framework & Philosophy
- 17.2 Secondary Research – Sources, Hierarchy & Data Extraction
- 17.3 Data Modeling – Bottom-Up & Top-Down Market Sizing
- 17.4 Primary Research – Stakeholder Framework, LOI & Sample Sizes
- 17.5 Forecast Methodology – Regression, Scenario & Sensitivity Analysis
- 17.6 Quality Control – Four-Layer Validation Framework
- 17.7 Limitations & Standard Assumptions
- 17.8 Disclaimer
