
Direct Lithium Extraction Market Overview:
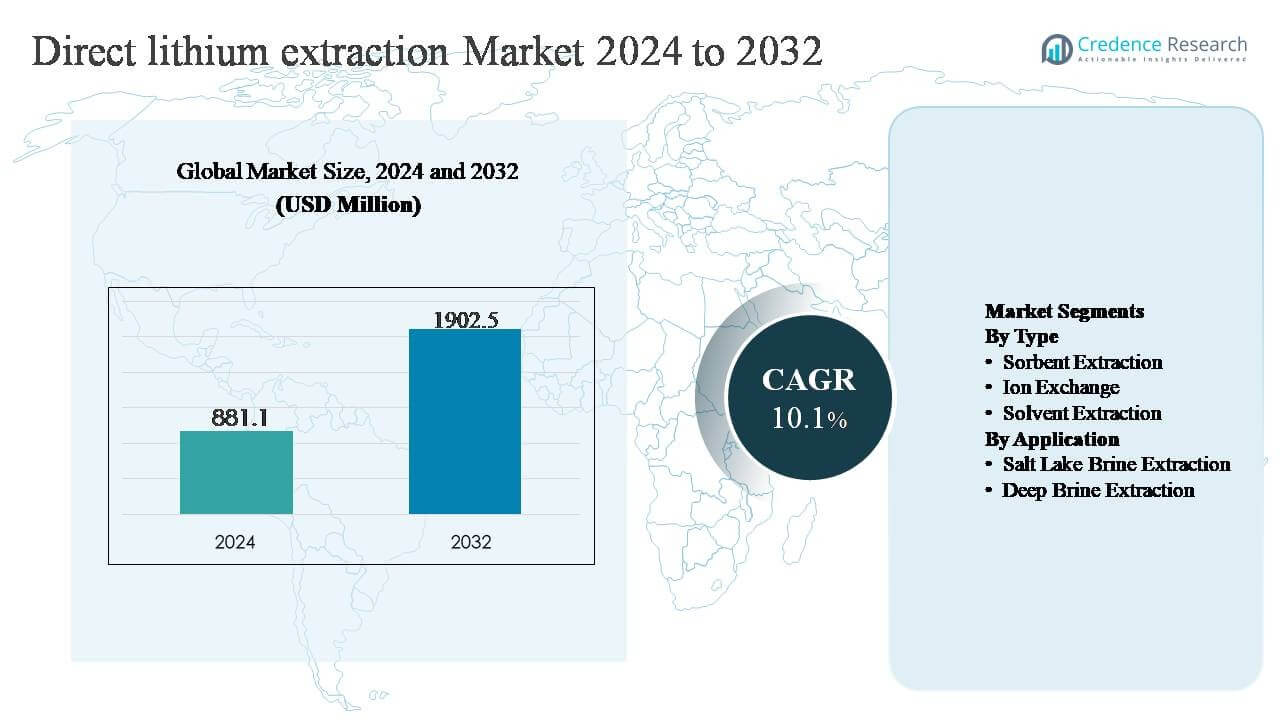
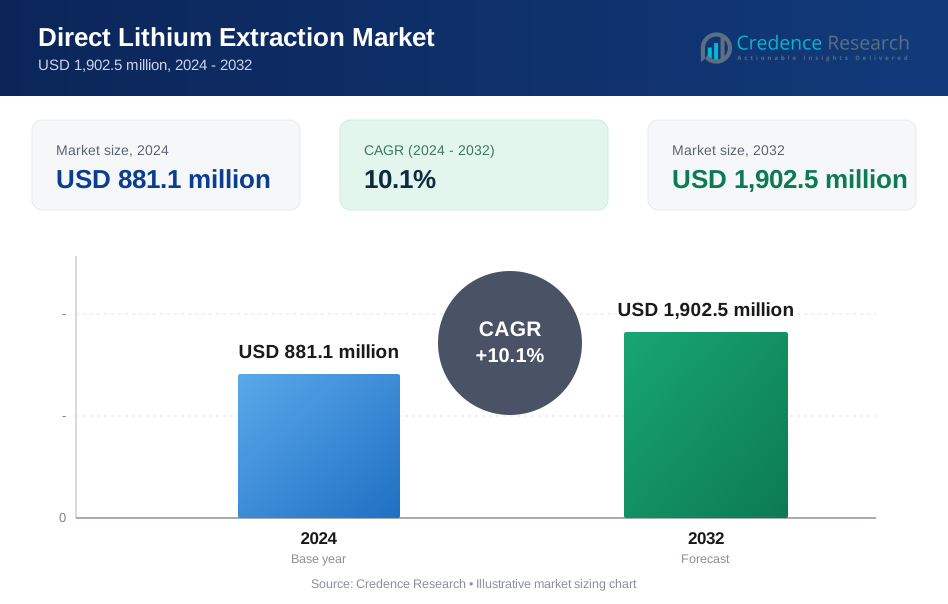
The Direct Lithium Extraction (DLE) market was valued at USD 881.1 million in 2024 and is projected to reach USD 1,902.5 million by 2032, expanding at a CAGR of 10.1% during the forecast period.
| REPORT ATTRIBUTE | DETAILS |
|---|---|
| Historical Period | 2020-2023 |
| Base Year | 2024 |
| Forecast Period | 2025-2032 |
| Direct Lithium Extraction Market Size 2024 | USD 881.1 million |
| Direct Lithium Extraction Market, CAGR | 10.1% |
| Direct Lithium Extraction Market Size 2032 | USD 1,902.5 million |
Direct Lithium Extraction Market Insights
- Market growth is strongly supported by the need for faster lithium production cycles, higher recovery rates, and lower water consumption compared to evaporation ponds, with sorbent extraction emerging as the dominant segment due to superior selectivity and scalability.
- Key market trends include increasing integration of DLE with geothermal and deep brine resources, growing pilot-to-commercial transitions, and stronger partnerships between technology providers and lithium producers to secure long-term supply.
- Competitive dynamics are shaped by innovation in sorbents, membranes, and ion-exchange systems, while high capital costs, brine variability, and long-term performance validation act as notable market restraints.
- Regionally, North America leads with about 32% market share, followed by Latin America at 28%, Asia Pacific at 24%, Europe at 10%, and Middle East & Africa at 6%, reflecting resource availability and policy support.
Direct Lithium Extraction Market Segmentation Analysis:
By Type:
By type, sorbent extraction represents the dominant sub-segment, accounting for the largest market share due to its high lithium selectivity, rapid extraction kinetics, and compatibility with diverse brine chemistries. Sorbent-based systems, including lithium-selective adsorbents and ion-sieves, enable recovery efficiencies exceeding those of conventional methods while significantly shortening processing time. Their scalability and lower reagent consumption make them attractive for commercial deployment. Ion exchange follows, driven by modular system designs and operational stability, while solvent extraction remains a niche solution, primarily adopted where specific brine compositions justify higher chemical handling and process complexity.
- For instance, Lilac Solutions has demonstrated lithium-selective ion-exchange beads capable of completing adsorption–desorption cycles in under 2 hours, compared with evaporation pond processes that typically require 12-18 months, while maintaining stable performance over 5,000+ operational cycles.
By Application:
By application, salt lake brine extraction dominates the market, holding the majority share due to the abundance of lithium-rich salar resources in regions such as South America and parts of Asia. DLE adoption in salt lake brines is driven by the need to accelerate lithium production while reducing land use and freshwater depletion associated with evaporation ponds. Deep brine extraction is gaining traction as a high-growth sub-segment, supported by rising interest in geothermal-linked lithium recovery and oilfield brines, where DLE enables lithium production alongside existing energy infrastructure with improved economic viability.
- For instance, SQM has reported that pilot-scale DLE trials at the Salar de Atacama reduced lithium concentration time from multiple months to less than 24 hours, while operating on brines with lithium concentrations around 1,500 milligrams per liter.
Key Growth Drivers
Rapid Expansion of Electric Vehicle and Energy Storage Supply Chains
The accelerating global adoption of electric vehicles (EVs) and grid-scale energy storage systems is a primary driver for direct lithium extraction (DLE) technologies. Battery manufacturers increasingly require consistent, high-purity lithium supplies to support large-scale cell production, placing pressure on upstream producers to shorten project timelines and improve yield reliability. DLE enables lithium recovery within hours or days instead of the multi-year evaporation cycles associated with traditional brine ponds. This speed advantage aligns well with the fast-paced expansion of battery gigafactories and long-term offtake agreements. As automakers vertically integrate battery supply chains, lithium producers are adopting DLE to meet delivery commitments, enhance supply security, and respond quickly to demand fluctuations.
- For instance, Tesla’s lithium hydroxide refinery in Texas is designed with a target capacity to support one million electric vehicles annually equivalent to approximately 50,000 metric tons of Lithium Carbonate Equivalent (LCE). To achieve this, the facility utilizes a proprietary acid-free refining process designed to convert spodumene concentrate (hard rock) from global suppliers into battery-grade lithium hydroxide."
Environmental and Water Sustainability Requirements
Stricter environmental regulations and growing scrutiny of water usage in mining operations are significantly driving DLE adoption. Conventional evaporation-based lithium extraction consumes large land areas and disrupts fragile ecosystems, particularly in arid salt lake regions. DLE technologies reduce surface footprint, minimize freshwater consumption, and enable reinjection of processed brine, supporting more sustainable resource management. Governments, investors, and downstream customers increasingly favor low-impact lithium production methods, making DLE a strategic solution for meeting environmental, social, and governance (ESG) expectations. Sustainability-linked financing and permitting advantages further strengthen the business case for DLE-based projects.
- For instance, Arcadium Lithium (formerly Livent) utilizes a proprietary Direct Lithium Extraction (DLE) technology that, in specialized pilot-scale testing and optimized technical models, has demonstrated the potential for a freshwater intensity as low as 5 to 10 \(m^{3}\) per metric ton of lithium carbonate equivalent (LCE).
Technological Maturation and Commercial Scalability
Advancements in sorbent materials, ion-exchange resins, and process automation are accelerating the commercialization of DLE systems. Improved lithium selectivity, higher recovery rates, and longer material lifecycles have enhanced operational reliability and reduced operating costs. Pilot projects are transitioning into commercial-scale deployments, demonstrating technical feasibility across varied brine chemistries. Modular plant designs enable flexible capacity expansion and faster project execution. These technological improvements reduce investment risk and increase confidence among lithium producers, making DLE a viable alternative to conventional extraction methods.
Key Trends & Opportunities
Integration of DLE with Geothermal and Oilfield Brines
A key trend shaping the DLE market is its integration with geothermal power plants and oilfield brine operations. These applications allow lithium extraction from existing brine streams without developing new mining infrastructure. Co-producing lithium alongside energy generation improves overall project economics and resource efficiency. This approach also enables access to lithium resources in regions without traditional salt lakes, expanding the geographic scope of lithium production. As energy companies seek to diversify revenue streams, DLE presents a compelling opportunity to monetize underutilized brine assets.
- For instance, Controlled Thermal Resources’ Hell’s Kitchen Lithium and Power project in California integrates Direct Lithium Extraction (DLE) with a geothermal facility. The first stage of the project is designed to deliver 50 megawatts of baseload geothermal power with plans to expand to 350 megawatts across future stages while processing geothermal brines flowing at rates above 4,000 gallons per minute, from which lithium is extracted before reinjection.
Strategic Partnerships and Vertical Integration
Lithium producers, technology developers, and battery manufacturers are increasingly forming strategic partnerships to accelerate DLE deployment. Technology licensing agreements, joint ventures, and long-term supply contracts are becoming common as stakeholders aim to de-risk projects and secure lithium supply. Vertical integration strategies allow battery and automotive companies to gain upstream control while supporting technology optimization for battery-grade lithium production. These collaborations create opportunities for faster innovation cycles and more predictable market growth.
- For instance, General Motors has entered long-term lithium supply and development collaborations linked to DLE projects designed to deliver tens of thousands of metric tons per year of lithium hydroxide equivalent for North American battery plants, aligning extraction chemistry with cathode production requirements.
Key Challenges
High Capital Intensity and Project Economics Uncertainty
Despite its advantages, DLE faces challenges related to high upfront capital costs and uncertain long-term operating economics. Advanced materials, specialized equipment, and process control systems require significant initial investment. Variability in brine composition can impact performance, making site-specific customization necessary. These factors complicate cost forecasting and project financing, particularly for early-stage developers. Achieving consistent economic returns across different resource types remains a key hurdle for widespread adoption.
Technology Validation and Long-Term Performance Risks
Another critical challenge is the limited track record of large-scale, long-duration DLE operations. Many technologies have demonstrated success at pilot or demonstration scale, but long-term performance data under continuous operation is still emerging. Material degradation, fouling, and selectivity loss over time can affect recovery efficiency and operating costs. Lithium producers remain cautious, often requiring extended validation periods before full-scale deployment. Overcoming these technical uncertainties is essential to building broader industry confidence in DLE solutions.
Regional Analysis
North America
North America accounts for approximately 32% of the direct lithium extraction (DLE) market, supported by strong policy backing for critical minerals and rapid expansion of domestic battery manufacturing. The United States leads regional activity, with DLE projects linked to geothermal brines and oilfield resources gaining momentum due to their lower environmental footprint. Federal incentives for EV supply chain localization and clean energy infrastructure continue to accelerate investment. Canada complements growth through pilot-scale developments and technology partnerships. The region’s emphasis on supply security, fast permitting, and ESG-aligned lithium production reinforces its leadership position.
Latin America
Latin America represents nearly 28% of the global DLE market, driven by its extensive lithium-rich salt lake brines across Chile, Argentina, and Bolivia. While evaporation ponds remain common, increasing regulatory scrutiny over water usage is accelerating DLE adoption. Argentina leads regional deployment due to favorable investment frameworks and active pilot projects, while Chile is selectively integrating DLE to enhance recovery and sustainability. The region benefits from established lithium infrastructure and growing international partnerships, positioning DLE as a strategic solution to improve production efficiency and environmental compliance.
Asia Pacific
Asia Pacific holds around 24% of the direct lithium extraction market, underpinned by strong downstream demand from battery and electric vehicle manufacturing. China dominates regional activity, deploying DLE technologies across salt lake and industrial brine resources to secure domestic lithium supply. Government-backed research programs and state-owned enterprises support rapid scale-up and commercialization. Japan and South Korea focus on technology development and overseas project participation. The region’s integrated battery ecosystem and rising energy storage demand continue to drive steady expansion of DLE adoption.
Europe
Europe accounts for approximately 10% of the global DLE market, driven by strategic initiatives to localize lithium supply for its growing EV and battery sectors. The region prioritizes geothermal and deep brine extraction, particularly in Germany and France, where DLE aligns with strict environmental regulations. Public funding, pilot projects, and cross-border collaborations support technology validation. Although market share remains moderate, Europe’s emphasis on sustainable sourcing and regulatory compliance positions DLE as a preferred extraction method for future lithium projects.
Middle East & Africa
The Middle East & Africa region holds nearly 6% of the direct lithium extraction market, reflecting early-stage development and emerging interest. In the Middle East, DLE is being explored for deep brine and oilfield-associated lithium resources, leveraging existing energy infrastructure. Africa remains focused on hard rock lithium mining, though DLE is gaining attention for future brine-based opportunities. Limited infrastructure and project financing currently constrain adoption, but long-term resource potential supports gradual market participation.
Direct Lithium Extraction Market Segmentations:
By Type
- Sorbent Extraction
- Ion Exchange
- Solvent Extraction
By Application
- Salt Lake Brine Extraction
- Deep Brine Extraction
By Geography
- North America
- U.S.
- Canada
- Mexico
- Europe
- Germany
- France
- U.K.
- Italy
- Spain
- Rest of Europe
- Asia Pacific
- China
- Japan
- India
- South Korea
- South-east Asia
- Rest of Asia Pacific
- Latin America
- Brazil
- Argentina
- Rest of Latin America
- Middle East & Africa
- GCC Countries
- South Africa
- Rest of the Middle East and Africa
Competitive Landscape
The competitive landscape of the direct lithium extraction (DLE) market is characterized by a mix of specialized technology developers, established lithium producers, and strategic industrial partners focused on accelerating commercialization. Competition centers on lithium recovery efficiency, selectivity across diverse brine chemistries, scalability, and long-term operational stability. Companies are differentiating through proprietary sorbent materials, ion-exchange resins, and integrated process designs that reduce water consumption and shorten production timelines. Strategic collaborations between DLE technology providers and lithium mining companies are common, enabling pilot-to-commercial scale transitions and risk sharing. Licensing agreements and joint ventures are increasingly favored to fast-track deployment and secure offtake commitments from battery manufacturers. Regional players leverage local brine resources and regulatory support, while global participants pursue portfolio diversification across multiple extraction technologies. Continuous innovation, field validation, and ESG alignment remain central to sustaining competitive advantage in this evolving market.
Key Player Analysis
- SLB (U.S.)
- Summit Nanotech (Canada)
- Jiuwu Hi-tech (China)
- E3 Lithium (Canada)
- Lilac Solutions (U.S.)
Recent Developments
- In October 30, 2025, Summit Nanotech announced a major milestone in water usage efficiency for its DLE technology, independently validated to use significantly less freshwater than traditional ponds and DLE benchmarks, while maintaining high lithium recovery rates.
- In September 2024, SLB announced it had proven its sustainable lithium production solution at scale at its demonstration facility in Clayton Valley, Nevada, integrating DLE, brine concentration, and conversion technologies to produce lithium using brine feedstocks with improved operational performance.
- In June 2024, SLB detailed its Well-to-Product Integrated Lithium Solutions, highlighting advanced technology capable of enhancing lithium extraction yields above 90 %, significantly improving efficiency versus conventional methods.
Report Coverage
The research report offers an in-depth analysis based on Type, Application and Geography. It details leading market players, providing an overview of their business, product offerings, investments, revenue streams, and key applications. Additionally, the report includes insights into the competitive environment, SWOT analysis, current market trends, as well as the primary drivers and constraints. Furthermore, it discusses various factors that have driven market expansion in recent years. The report also explores market dynamics, regulatory scenarios, and technological advancements that are shaping the industry. It assesses the impact of external factors and global economic changes on market growth. Lastly, it provides strategic recommendations for new entrants and established companies to navigate the complexities of the market.
Future Outlook
- Direct lithium extraction will increasingly replace evaporation-based methods as producers prioritize faster production cycles and lower environmental impact.
- Commercial-scale deployments will expand as pilot projects transition into long-term operations across diverse brine chemistries.
- Sorbent-based technologies will remain dominant due to their high lithium selectivity and operational flexibility.
- Integration of DLE with geothermal and oilfield brines will open new resource pathways beyond traditional salt lakes.
- Technology providers will focus on improving material durability and regeneration efficiency to reduce operating costs.
- Strategic partnerships between lithium producers, technology firms, and battery manufacturers will intensify.
- Regulatory support for sustainable mining practices will further accelerate DLE adoption.
- Modular and standardized DLE plant designs will enable faster project execution and scalable capacity expansion.
- Geographic diversification of lithium supply will increase as DLE unlocks previously uneconomic resources.
- Continuous performance validation and data transparency will strengthen investor confidence in DLE projects.
Request a Free Sample
Fill in your details and we'll send you a free sample report.
- Sample data tables & charts
- Research methodology
Need a Custom Version of This Report?
Tailor the scope, geography, or segments to your exact requirements.
- Custom geography or segment scope
- Direct access to our analyst team
Frequently Asked Questions
What is the current market size for Direct Lithium Extraction, and what is its projected size in 2032?
At what Compound Annual Growth Rate is the Direct Lithium Extraction market projected to grow between 2024 and 2032?
Which Direct Lithium Extraction segment held the largest share in 2024?
What are the primary factors fueling the growth of the Direct Lithium Extraction market?
Who are the leading companies in the Direct Lithium Extraction market?
Which region commanded the largest share of the Direct Lithium Extraction market in 2024?
Table of Content
Chapter 1. Report Introduction
- 1.1 Report Description & Purpose
- 1.1.1 Report Title & Market Definition
- 1.1.2 Unique Selling Propositions (USP) & Key Differentiators
- 1.1.3 Value Proposition for Stakeholders
- 1.2 Research Objectives
- 1.2.1 Market Sizing Objectives (Volume & Revenue)
- 1.2.2 Segmentation Objectives
- 1.2.3 Competitive Intelligence Objectives
- 1.2.4 Forecast & Scenario Objectives
- 1.3 Report Scope
- 1.3.1 Direct Lithium Extraction Scope – Types & Subtypes Covered
- 1.3.2 Geographic Scope – Regions & Countries Covered
- 1.3.3 Historical Period, Base Year & Forecast Period (2024; forecast to 2032)
- 1.3.4 Inclusions & Exclusions
- 1.4 HS Code & Classification Framework
- 1.5 Currency, Units & Pricing Basis
- 1.6 Target Stakeholders
- 1.7 Limitations & Assumptions
Chapter 2. Executive Summary
- 2.1 Global Direct Lithium Extraction Market Snapshot
- 2.1.1 Market Size – Historical (2024) & Forecast (2024-2032) (2024: USD 881.1 million → 2032: USD 1,902.5 million)
- 2.1.2 Volume & Revenue – Global Totals
- 2.1.3 Key Market Highlights – Top Five Facts
- 2.2 Direct Lithium Extraction Market Segmentation Snapshot
- 2.2.1 Market Split by Region – 2024 vs. 2032
- 2.3 Competitive Snapshot
- 2.3.1 Top 10 Players by Revenue Share – 2024
- 2.3.2 Top 10 Players by Volume Share – 2024
- 2.3.3 Recent Strategic Developments (18-Month Summary)
- 2.4 Key Investment Highlights & Strategic Conclusions
Chapter 3. Direct Lithium Extraction Market Dynamics & Industry Analysis
- 3.1 Market Overview & Context
- 3.1.1 Direct Lithium Extraction Market Position in the Broader Automotive Value Chain
- 3.1.2 OEM vs. Replacement Market Dynamics
- 3.1.3 Market Maturity & Development Stage by Region
- 3.2 Direct Lithium Extraction Market Drivers
- 3.3 Direct Lithium Extraction Market Restraints & Challenges
- 3.4 Direct Lithium Extraction Market Opportunities
- 3.5 Porter's Five Forces Analysis
- 3.5.1 Threat of New Entrants
- 3.5.2 Bargaining Power of Suppliers
- 3.5.3 Bargaining Power of Buyers
- 3.5.4 Threat of Substitutes
- 3.5.5 Competitive Rivalry – Intensity Assessment
- 3.6 Direct Lithium Extraction Value Chain Analysis
- 3.6.1 Upstream – Raw Material/Input Suppliers
- 3.6.1.1 Raw Material/Input 1
- 3.6.1.2 Raw Material/Input 2
- 3.6.1.3 Raw Material/Input 3
- 3.6.2 Midstream – Production/Manufacturing/Service Delivery
- 3.6.2.1 Production/Process Overview
- 3.6.2.2 Key Facility Locations & Capacity by Manufacturer
- 3.6.3 Downstream – Distribution & End Consumer
- 3.6.3.1 Primary Channel – B2B/OEM
- 3.6.3.2 Secondary Channels – Dealer, Retail, Online, Direct
- 3.6.4 Value Chain Profitability Analysis
- 3.6.1 Upstream – Raw Material/Input Suppliers
- 3.7 PESTEL Analysis
- 3.7.1 Political Factors
- 3.7.2 Economic Factors
- 3.7.3 Social Factors
- 3.7.4 Technological Factors
- 3.7.5 Environmental Factors
- 3.7.6 Legal Factors
- 3.8 Direct Lithium Extraction Supply Chain Analysis
- 3.8.1 Raw Material/Input Supply Risk Assessment
- 3.8.2 Manufacturing Concentration Risk (Geographic Exposure)
- 3.8.3 Trade Disruption Impact Analysis
- 3.9 Regulatory & Policy Landscape
Note: The regulatory and policy landscape section covers regulations based on their applicability to the market, Direct Lithium Extraction category, geography, and scope of the study. Only regulatory frameworks with a material impact on operations, compliance, trade, sustainability, or market access are analyzed in detail.
Chapter 4. Key Investment Pockets & Opportunity Analysis
- 4.1 Direct Lithium Extraction Market Attractiveness Analysis
- 4.1.1 By Region – Investment Attractiveness Matrix (Volume × CAGR)
- 4.2 Absolute Revenue Growth Opportunity
- 4.2.1 By Region – Absolute USD Growth Through 2032
- 4.3 Incremental Volume Opportunity
- 4.3.1 By Region – Incremental Volume Through 2032
- 4.3.2 Segment – Incremental Volume
- 4.4 Emerging Submarket Opportunity Deep Dive (Subject to Applicability)
- 4.5 Emerging Market Opportunity Scorecards
- 4.5.1 United States
- 4.5.2 Europe
- 4.5.3 Asia
- 4.5.4 Middle East & Africa
Note: Emerging Market Opportunity Scorecards will be included based on relevance and strategic importance. Regions listed are indicative and may vary depending on data availability and market dynamics.
Chapter 5. Direct Lithium Extraction Import-Export Analysis & Trade Flows
- 5.1 Global Trade Overview
- 5.1.1 Global Export Value by Country (2024)
- 5.1.2 Global Export Volume by Country (2024)
- 5.1.3 Global Import Value by Country (2024)
- 5.1.4 Global Import Volume by Country (2024)
- 5.1.5 Net Trade Balance by Country (2024)
- 5.2 Export Analysis – Segment
- 5.2.1 Type 1 (HS Code)
- 5.2.2 Type 2 (HS Code)
- 5.2.3 Type 3 (HS Code)
- 5.2.4 Type 4 (HS Code)
- 5.2.5 Type 5 (HS Code)
- 5.3 Import Analysis – Segment
- 5.3.1 Type 1 (HS Code)
- 5.3.2 Type 2 (HS Code)
- 5.3.3 Type 3 (HS Code)
- 5.3.4 Type 4 (HS Code)
- 5.3.5 Type 5 (HS Code)
- 5.4 Average Unit Trade Prices
- 5.4.1 Average Export Price – Segment & Country
- 5.4.2 Average Import Price – Segment & Source Country
- 5.4.3 Price Trends (2024)
- 5.5 Key Trade Route Analysis
- 5.5.1 Trade Route 1
- 5.5.2 Trade Route 2
- 5.5.3 Trade Route 3
- 5.5.4 Trade Route 4
- 5.5.5 Trade Route 5
- 5.6 Trade Policy Impact Assessment
- 5.6.1 US Anti-Dumping & Section 301 Tariffs
- 5.6.2 EU Customs Union Impact
- 5.6.3 Major Free Trade Agreements
- 5.6.4 USMCA Rules of Origin
Note: Trade policy analysis will be included only where relevant to the Direct Lithium Extraction market.
Chapter 6. Competitive Landscape & Company Benchmarking
- 6.1 Direct Lithium Extraction Market Concentration & Structure
- 6.1.1 Herfindahl-Hirschman Index (HHI) – vs. 2024
- 6.1.2 Tier 1, Tier 2 & Tier 3 Market Structure
- 6.1.3 Global, Regional & Local Player Dynamics
- 6.2 Direct Lithium Extraction Market Share Analysis – 2024
- 6.2.1 Global Revenue Share by Company
- 6.2.2 Global Volume Share by Company
- 6.2.3 Regional Revenue Share
- 6.2.4 Market Share Evolution ( vs. 2024)
- 6.2.5 OEM Segment Share by Company
- 6.2.6 Replacement Segment Share by Company
- 6.3 Production/Delivery Capacity & Facility Analysis
- 6.3.1 Global Installed Capacity
- 6.3.2 Capacity Utilization Rates
- 6.3.3 Production/Output Volume
- 6.3.4 Facility Locations & Capacity Map
- 6.3.5 Planned Capacity Additions
- 6.4 Direct Lithium Extraction Competitive Benchmarking Matrix
- 6.4.1 Revenue, Volume, CAGR & Profitability Comparison
- 6.4.2 Channel Revenue Mix
- 6.4.3 Geographic Revenue Exposure
- 6.4.4 R&D Intensity
- 6.4.5 Sustainability Maturity
- 6.5 Strategic Developments in Direct Lithium Extraction (Last 24 Months)
- 6.5.1 Mergers, Acquisitions & Divestments
- 6.5.2 New Direct Lithium Extraction Launches
- 6.5.3 Facility Expansions
- 6.5.4 Strategic Alliances, Joint Ventures & Partnerships
- 6.5.5 Distribution Expansion & Market Entry
- 6.5.6 Sustainability & ESG Initiatives
- 6.6 Competitive Strategy Mapping
- 6.6.1 Leader, Challenger, Follower & Niche Classification
- 6.6.2 Pricing Strategy Comparison
- 6.6.3 Channel Strategy Matrix
Note: Strategic developments are included based on their materiality and the availability of reliable information.
Chapter 7. Global Direct Lithium Extraction Market – By Distribution Channel
- 7.1 Segment Overview
- 7.1.1 Volume & Revenue Split by Channel (2024 & 2032)
- 7.1.2 Channel Mix Evolution (2024-2032)
Chapter 8. Regional Market Analysis – Global Overview
- 8.1 Global Regional Overview
- 8.1.1 Regional Volume Share
- 8.1.2 Regional Revenue Share
- 8.1.3 Regional Volume by Region
- 8.1.4 Regional Revenue by Region
- 8.1.5 Regional Forecast Through 2032
- 8.2 Cross-Regional Segment Analysis
- 8.2.1 By Distribution Channel
- 8.2.2 By Brand/Price Tier
Chapter 9. North America Direct Lithium Extraction Market
- 9.1 United States
- 9.2 Canada
- 9.3 Mexico
Chapter 10. Europe Direct Lithium Extraction Market
- 10.1 Germany
- 10.2 France
- 10.3 Italy
- 10.4 United Kingdom
- 10.5 Spain
- 10.6 Poland
- 10.7 Russia
- 10.8 Netherlands
- 10.9 Belgium
- 10.10 Sweden
- 10.11 Denmark
- 10.12 Norway
- 10.13 Rest of Europe
Chapter 11. Asia Pacific Direct Lithium Extraction Market
- 11.1 China
- 11.2 India
- 11.3 Japan
- 11.4 South Korea
- 11.5 Thailand
- 11.6 Indonesia
- 11.7 Vietnam
- 11.8 Malaysia
- 11.9 Australia
- 11.10 Rest of Asia Pacific
Chapter 12. Latin America Direct Lithium Extraction Market
- 12.1 Brazil
- 12.2 Argentina
- 12.3 Colombia
- 12.4 Chile
- 12.5 Rest of Latin America
Chapter 13. Middle East Direct Lithium Extraction Market
- 13.1 Saudi Arabia
- 13.2 United Arab Emirates
- 13.3 Turkey
- 13.4 Israel
- 13.5 Iran
- 13.6 Rest of the Middle East
Chapter 14. Africa Direct Lithium Extraction Market
- 14.1 South Africa
- 14.2 Egypt
- 14.3 Nigeria
- 14.4 Morocco
- 14.5 Rest of Africa
Chapter 15. Direct Lithium Extraction Company Profiles
- 15.1 [Company 01]
- 15.1.1 Company Overview
- 15.1.2 Key Management Personnel
- 15.1.3 Products & Services Portfolio
- 15.1.4 Financial Performance
- 15.1.5 Key Market Focus & Geographic Presence
- 15.1.6 Recent Developments & Strategic Initiatives
Note: The company profile list is preliminary and may change based on research findings, market developments, data availability, and client requirements.
Chapter 16. Appendices
- Appendix A – List of Abbreviations & Acronyms
- Appendix B – Industry Classification Code Reference – Full Series
- Appendix C – Production & Capacity Data Tables
- Appendix D – End-Use & Demand Base Tables
- Appendix E – Consumption & Replacement Rate Assumptions
- Appendix F – ASP Reference Tables
- Appendix G – Manufacturing & Facility Database
- Appendix H – Import-Export Data Tables
- Appendix I – Regulatory Summary Tables
- Appendix J – Primary Research Participant List (Anonymized)
- Appendix K – Primary Research Questionnaire Framework
- Appendix L – Data Sources & Bibliography
- Appendix M – Market Size Divergence & Source Comparison
Chapter 17. Research Methodology
- 17.1 Research Framework & Philosophy
- 17.2 Secondary Research – Sources, Hierarchy & Data Extraction
- 17.3 Data Modeling – Bottom-Up & Top-Down Market Sizing
- 17.4 Primary Research – Stakeholder Framework, LOI & Sample Sizes
- 17.5 Forecast Methodology – Regression, Scenario & Sensitivity Analysis
- 17.6 Quality Control – Four-Layer Validation Framework
- 17.7 Limitations & Standard Assumptions
- 17.8 Disclaimer
