
Disability Devices Market Overview:
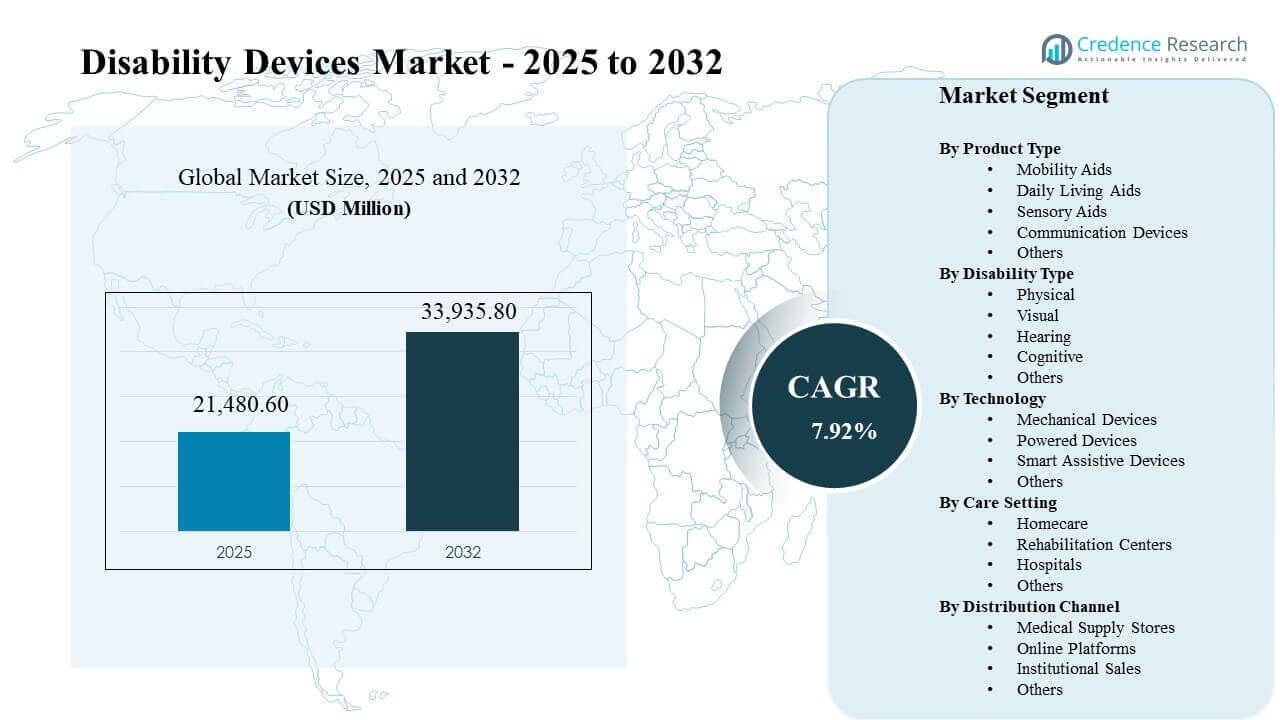
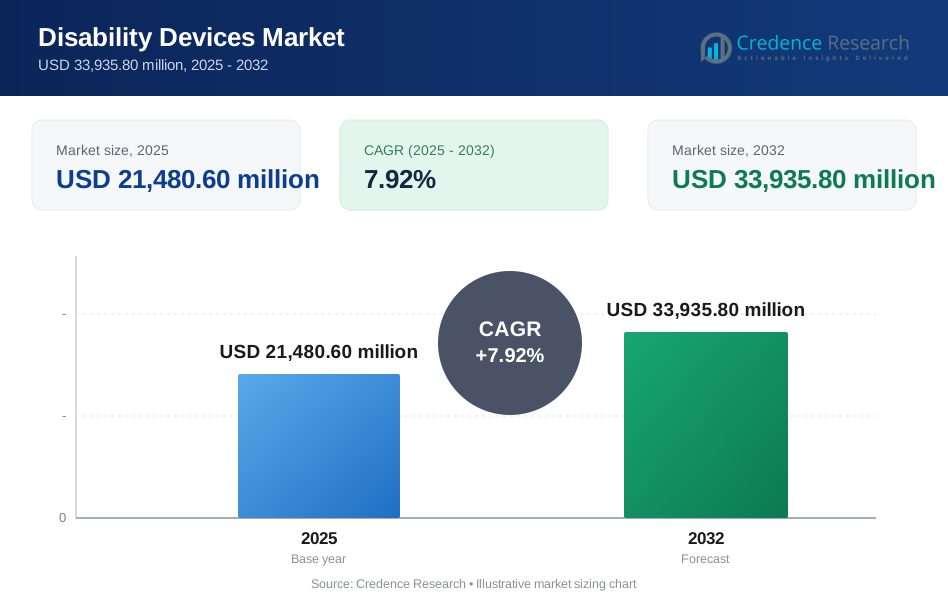
The Disability Devices Market size was estimated at USD 21,480.60 million in 2025 and is expected to reach USD 33,935.80 million by 2032, growing at a CAGR of 7.92% from 2025 to 2032.
| REPORT ATTRIBUTE | DETAILS |
|---|---|
| Historical Period | 2020-2024 |
| Base Year | 2025 |
| Forecast Period | 2026-2032 |
| Disability Devices Market Size 2025 | USD 21,480.60 million |
| Disability Devices Market, CAGR | 7.92% |
| Disability Devices Market Size 2032 | USD 33,935.80 million |
Key Market Trends & Insights
- Mobility Aids accounted for the largest share of 33.10% in 2025, reflecting sustained demand for wheelchairs, walkers, and scooters across mobility-limiting conditions.
- Homecare held 40.20% in 2025 as care pathways increasingly favor at-home recovery and long-term support to reduce institutional burden.
- Medical Supply Stores represented 50.80% in 2025, supported by fitting, servicing, and reimbursement-aligned purchasing workflows.
- North America contributed 42.30% in 2025, supported by deeper coverage structures, stronger clinician-led prescribing, and established DME service networks.
- The market is projected to expand at 7.92% CAGR during 2025–2032 as powered and smarter assistive solutions broaden adoption and replacement cycles.
Segment Analysis
Demand across the Disability Devices Market is shaped by a mix of functional need, reimbursement access, and the availability of local fitting and service capabilities. Mobility-oriented solutions remain central because mobility limitations often co-occur with chronic disease and age-related decline, creating recurring demand for primary devices and add-on accessories. Home-based use continues to expand as patients and caregivers prioritize independence, safety, and convenience, which lifts adoption of daily living aids and supports repeat purchases over time.
Channel dynamics continue to evolve as traditional medical supply and DME outlets retain an advantage in assessment, product selection support, maintenance, and claims processing. Online platforms are strengthening share where products are more standardized and where delivery speed and price transparency influence buying decisions. Technology migration from purely mechanical solutions toward powered and smarter assistive devices supports premiumization, improved user experience, and differentiation through software, connectivity, and personalization.
By Product Type Insights
Mobility Aids accounted for the largest share of 33.10% in 2025. Mobility Aids lead because mobility support is a primary requirement for individuals with physical limitations and post-acute recovery needs, spanning a wide range of ages and conditions. Mobility Aids also benefit from strong visibility in clinical assessments, rehabilitation workflows, and caregiver purchase decisions. Mobility Aids demand is reinforced by replacement and upgrade cycles as users seek improved comfort, portability, stability, and powered assistance.
By Disability Type Insights
The Physical segment represents the largest demand pool because mobility, strength, and balance limitations drive broad use of mobility aids, daily living aids, and related safety products. Physical disability-linked needs also align closely with rehabilitation pathways that guide device selection, training, and ongoing utilization. Visual and hearing categories support steady demand through specialist pathways and consumer-facing purchases, while cognitive support tools expand as reminders, prompts, and assistive software features become more accessible. Multi-morbidity increases the likelihood of multiple-device ownership, supporting cross-category adoption.
By Technology Insights
Mechanical Devices maintain a strong installed base because affordability, simplicity, and lower maintenance needs support widespread adoption across home and institutional settings. Powered Devices gain traction where users prioritize reduced caregiver dependence, greater range, and stronger day-to-day usability. Smart Assistive Devices expand as sensors, connectivity, and software enable personalization, monitoring, and safety-oriented features that improve confidence and adherence. Technology choice often depends on funding access, service availability, and the user’s environment, which shapes adoption patterns across regions.
By Care Setting Insights
Homecare accounted for the largest share of 40.20% in 2025. Homecare leads because care delivery is increasingly centered on at-home recovery and long-term support, particularly for aging populations and chronic conditions. Homecare adoption is reinforced by caregiver needs for safer transfers, fall-risk reduction, and daily activity support. Homecare demand also increases when hospitals and rehabilitation programs prescribe or recommend devices for continuity of care after discharge.
By Distribution Channel Insights
Medical Supply Stores accounted for the largest share of 50.80% in 2025. Medical Supply Stores lead because these outlets support product fitting, in-person evaluation, after-sales servicing, and claims-aligned purchasing processes. Medical Supply Stores also perform an advisory role for caregivers and patients navigating complex product choices and feature trade-offs. Institutional relationships and local service coverage strengthen repeat purchasing and referral activity through rehabilitation and homecare networks.
Disability Devices Market Drivers
Aging demographics and chronic disease prevalence
Population aging increases the number of individuals requiring mobility support, transfer assistance, and daily living aids across long-term care pathways. Chronic diseases such as arthritis, diabetes-related complications, and cardiovascular conditions increase functional limitations that create demand for durable assistive products. Rehabilitation protocols often translate clinical assessments into device prescriptions or recommendations that drive adoption. Product replacement cycles and add-on accessory purchases support recurring revenue across key categories.
- For instance, Arjo’s Sara Stedy sit-to-stand aid is designed for patients 149–193 cm tall and weighing up to 182 kg, has a unit weight of 29.4 kg, and features pedal-operated chassis legs that open to 880 mm, reflecting how manufacturers tailor transfer devices for heavier users and varied care environments.
Shift toward home-based care and independence
Home-based care models expand adoption of disability devices as care systems aim to reduce length of stay and avoid readmissions. Caregivers and patients prioritize solutions that improve safety, ease of use, and independence in everyday routines. Homecare demand strengthens categories such as mobility aids, transfer devices, and daily living supports that reduce caregiver burden. Distribution and service networks that support setup and maintenance further reinforce homecare-centric purchasing.
Technology improvement and product premiumization
Innovation in powered mobility and smart assistive features supports premium offerings that improve usability, comfort, and reliability. Product differentiation increasingly relies on ergonomics, battery performance, safety features, and digital enablement that supports personalization. Technology improvements also broaden addressable demand by supporting users who cannot effectively use purely mechanical devices. Better design and accessibility features improve adherence and reduce device abandonment across key use cases.
- For instance, Permobil’s M Corpus VS demonstrates premium assistive mobility engineering with up to 45° of ActiveReach forward tilt, up to 14 inches of ActiveHeight seat elevation, elevated drive speeds of up to 3.2 mph, a standing legrest angle of 85°–180°, and redesigned knee supports that are 75% lighter than the original single-post design.
Expanded access through channels and service models
Broader channel availability increases product discovery and purchase conversion, especially for standardized items and accessories. Medical supply outlets sustain demand through fitting and servicing, while online platforms improve reach and convenience in areas with limited physical retail. Institutional procurement supports adoption in hospitals and rehabilitation centers, strengthening downstream home utilization. Service models that include maintenance, training, and support improve customer satisfaction and reduce downtime risks.
Disability Devices Market Challenges
Reimbursement variability and documentation requirements remain a structural constraint, creating delays in approval and limiting access to higher-value powered and smart solutions. Cost sensitivity is significant in lower-income settings, which can shift demand toward entry-level products and reduce adoption of premium features. Service availability also influences purchase outcomes because maintenance, fitting, and training gaps can reduce long-term utilization and increase returns. Supply chain volatility for components and imported products can affect lead times and pricing stability.
- For instance, WHILL’s FDA-cleared Model C2 power chair offers up to 12.4 miles of driving range, a 29.9-inch turning radius, a maximum incline of 10 degrees, a 300-pound weight capacity, and a full charge time of up to 5 hours, showing the level of performance built into premium powered mobility devices that may face slower uptake where reimbursement support and service coverage are inconsistent.
Device selection complexity is another challenge because product choice depends on clinical needs, environment, caregiver capacity, and user preferences, increasing the risk of mismatch. Fragmented distribution and inconsistent service coverage can reduce customer confidence, especially for powered mobility and advanced assistive devices. Product standardization remains difficult across diverse disability profiles, which complicates inventory planning for channels. Regulatory and quality compliance requirements can increase time-to-market and cost for manufacturers expanding portfolios.
Disability Devices Market Trends and Opportunities
Smart assistive features are becoming more common as connectivity, sensors, and software support safety alerts, monitoring, and personalization. Integration with broader digital health ecosystems creates opportunities for differentiated value propositions, especially for caregiver coordination and remote support. Product designs that emphasize portability, lighter materials, and modular upgrades improve usability and encourage replacement. Expanded training and service offerings can increase satisfaction and reduce device abandonment, strengthening lifetime value.
- For instance, LUCI’s wheelchair safety platform combines depth cameras, ultrasonic sensors, and millimeter-wave radar, and its published safety data shows detection ranges of up to 4.5 m forward, 1.2 m backward, and 1.3 m to the sides, highlighting how sensor-based intelligence is being used to strengthen real-time user protection.
E-commerce and direct-to-consumer pathways continue to expand, particularly for standardized daily living aids and accessories. Partnerships with homecare providers and rehabilitation networks can accelerate adoption by improving assessment-to-purchase workflows. Emerging markets offer scale potential as urban health systems expand and awareness improves, even when price sensitivity remains high. Product bundles and financing options can improve affordability and enable upgrades from mechanical to powered or smarter solutions.
Regional Insights
North America
North America held 42.30% in 2025, supported by mature reimbursement pathways, higher per-capita spending on assistive solutions, and stronger clinical-to-DME referral patterns. The region benefits from established service networks that support fitting, maintenance, and device training. Demand remains strong across mobility and homecare-aligned categories as aging-in-place preferences expand. Product premiumization is more visible in North America due to higher adoption of powered and feature-rich devices.
Europe
Europe represented 23.40% in 2025, underpinned by aging demographics, structured public health systems, and established assistive technology procurement and support services. Demand is supported by rehabilitation-driven pathways and standardized quality expectations. Homecare utilization supports recurring demand for mobility aids and daily living solutions, especially where community care models are prioritized. Competitive intensity remains high as manufacturers emphasize ergonomic design, safety, and service partnerships.
Asia Pacific
Asia Pacific accounted for 22.80% in 2025 as large patient populations and expanding access improve adoption across urban markets. Demand growth is supported by greater awareness of disability support options and expanding care infrastructure. Pricing sensitivity remains influential, supporting broad demand for mechanical devices alongside rising interest in powered mobility where funding allows. Channel expansion, including online platforms, improves reach in markets with uneven physical retail coverage.
Latin America
Latin America reached 6.10% in 2025, with demand concentrated in major economies and urban healthcare networks. Access limitations and reimbursement variability influence product mix, often favoring cost-effective mechanical solutions. Growth opportunities exist through improved distribution coverage, partnerships with rehabilitation providers, and education on proper device selection and use. Expansion of private healthcare and homecare services can strengthen adoption across mobility and daily living aids.
Middle East & Africa
Middle East and Africa held 5.40% in 2025, shaped by uneven coverage, import dependence, and variable service availability. Demand is stronger in higher-income markets where healthcare investment supports assistive device access and professional fitting. Broader adoption is constrained by affordability and limited specialist capacity in some areas. Channel development, training programs, and localized service networks represent key levers to improve utilization and outcomes.
Competitive Landscape
The Disability Devices Market remains competitive with players differentiating through portfolio breadth, clinical channel access, and service capabilities that support fitting, maintenance, and end-user training. Competitive positioning often depends on the ability to offer reliable product performance across mobility and homecare use cases while supporting reimbursement workflows and institutional relationships. Manufacturers also pursue product innovation through powered mobility and smarter assistive features that improve usability, safety, and personalization, alongside channel strategies that balance retail, DME, and online pathways.
Invacare focuses on broad mobility and homecare-aligned offerings supported by established distribution relationships and service requirements tied to durable medical equipment utilization. Invacare competitive strength typically depends on meeting clinician and caregiver expectations for reliability, comfort, and maintainability across widely used device categories. Invacare positioning is reinforced when local service coverage supports reduced downtime and better user experience. Portfolio and channel decisions can meaningfully influence share in mature reimbursement markets.
The industry research and growth report includes detailed analyses of the competitive landscape of the market and information about key companies, including:
- Sunrise Medical
- Invacare
- Ottobock
- Permobil
- Pride Mobility
- Drive DeVilbiss Healthcare
- Medline Industries
- Arjo
- GF Health Products
- HumanWare
Qualitative and quantitative analysis of companies has been conducted to help clients understand the wider business environment as well as the strengths and weaknesses of key industry players. Data is qualitatively analyzed to categorize companies as pure play, category-focused, industry-focused, and diversified; it is quantitatively analyzed to categorize companies as dominant, leading, strong, tentative, and weak.
Recent Developments
- In July 2025, Sunrise Medical announced the acquisition of Made for Movement, a company focused on neurorehabilitation therapeutic devices for people with complex mobility needs. This acquisition strengthens Sunrise Medical’s presence in advanced mobility and rehabilitation solutions within the disability devices space.
- In June 2025, Drive DeVilbiss Healthcare had acquired the product line of De Oro Devices, including the NexStride mobility aid, which is designed to help people with Parkinson’s disease and other mobility-limiting conditions walk more safely and confidently. The deal expands Drive DeVilbiss Healthcare’s position in smart mobility and neuroambulatory support devices.
- In May 2025, Starkey announced that it was working with LG to integrate Auracast streaming into LG’s 2025 OLED and QNED evo TVs. The partnership allows users of Starkey Edge AI hearing aids to stream television audio more directly and accessibly, improving the listening experience for people with hearing loss.
- In March 2025, Sunrise Medical announced the launch of the Empulse R90 push assist device. The company said the product is designed to power manual wheelchairs more easily, helping users travel longer distances, get support on ramps, reduce fatigue, and lower shoulder strain.
Report Scope
| Report Attribute | Details |
| Market size value in 2025 | USD 21,480.60 million |
| Revenue forecast in 2032 | USD 33,935.80 million |
| Growth rate (CAGR) | 7.92% (2025–2032) |
| Base year | 2025 |
| Forecast period | 2026-2032 |
| Quantitative units | USD million |
| Segments covered | By Product Type Outlook: Mobility Aids, Daily Living Aids, Sensory Aids, Communication Devices, Others; By Disability Type Outlook: Physical, Visual, Hearing, Cognitive, Others; By Technology Outlook: Mechanical Devices, Powered Devices, Smart Assistive Devices, Others; By Care Setting Outlook: Homecare, Rehabilitation Centers, Hospitals, Others; By Distribution Channel Outlook: Medical Supply Stores, Online Platforms, Institutional Sales, Others |
| Regional scope | North America, Europe, Asia Pacific, Latin America, Middle East & Africa |
| Key companies profiled | Invacare, Sunrise Medical, Ottobock, Permobil, Pride Mobility, Drive DeVilbiss Healthcare, Medline Industries, Arjo, GF Health Products, HumanWare |
| No. of Pages | 338 |
Segmentation
By Product Type
- Mobility Aids
- Daily Living Aids
- Sensory Aids
- Communication Devices
- Others
By Disability Type
- Physical
- Visual
- Hearing
- Cognitive
- Others
By Technology
- Mechanical Devices
- Powered Devices
- Smart Assistive Devices
- Others
By Care Setting
- Homecare
- Rehabilitation Centers
- Hospitals
- Others
By Distribution Channel
- Medical Supply Stores
- Online Platforms
- Institutional Sales
- Others
By Region
- North America
- U.S.
- Canada
- Mexico
- Europe
- Germany
- France
- U.K.
- Italy
- Spain
- Rest of Europe
- Asia Pacific
- China
- Japan
- India
- South Korea
- South-east Asia
- Rest of Asia Pacific
- Latin America
- Brazil
- Argentina
- Rest of Latin America
- Middle East & Africa
- GCC Countries
- South Africa
- Rest of the Middle East and Africa
Request a Free Sample
Fill in your details and we'll send you a free sample report.
- Sample data tables & charts
- Research methodology
Need a Custom Version of This Report?
Tailor the scope, geography, or segments to your exact requirements.
- Custom geography or segment scope
- Direct access to our analyst team
Frequently Asked Questions
What is the market size and forecast for the Disability Devices Market?
What is the CAGR for the Disability Devices Market?
What is the largest segment in the Disability Devices Market?
What factors are driving growth in the Disability Devices Market?
Which companies are leading in the Disability Devices Market?
Which region leads the Disability Devices Market?
Table of Content
Chapter 1. Report Introduction
- 1.1 Report Description & Purpose
- 1.1.1 Report Title & Market Definition
- 1.1.2 Unique Selling Propositions (USP) & Key Differentiators
- 1.1.3 Value Proposition for Stakeholders
- 1.2 Research Objectives
- 1.2.1 Market Sizing Objectives (Volume & Revenue)
- 1.2.2 Segmentation Objectives
- 1.2.3 Competitive Intelligence Objectives
- 1.2.4 Forecast & Scenario Objectives
- 1.3 Report Scope
- 1.3.1 Disability Devices Scope – Types & Subtypes Covered
- 1.3.2 Geographic Scope – Regions & Countries Covered
- 1.3.3 Historical Period, Base Year & Forecast Period (2025; forecast to 2032)
- 1.3.4 Inclusions & Exclusions
- 1.4 HS Code & Classification Framework
- 1.5 Currency, Units & Pricing Basis
- 1.6 Target Stakeholders
- 1.7 Limitations & Assumptions
Chapter 2. Executive Summary
- 2.1 Global Disability Devices Market Snapshot
- 2.1.1 Market Size – Historical (2025) & Forecast (2025-2032) (2025: USD 21,480.60 million → 2032: USD 33,935.80 million)
- 2.1.2 Volume & Revenue – Global Totals
- 2.1.3 Key Market Highlights – Top Five Facts
- 2.2 Disability Devices Market Segmentation Snapshot
- 2.2.1 Market Split by Region – 2025 vs. 2032
- 2.3 Competitive Snapshot
- 2.3.1 Top 10 Players by Revenue Share – 2025
- 2.3.2 Top 10 Players by Volume Share – 2025
- 2.3.3 Recent Strategic Developments (18-Month Summary)
- 2.4 Key Investment Highlights & Strategic Conclusions
Chapter 3. Disability Devices Market Dynamics & Industry Analysis
- 3.1 Market Overview & Context
- 3.1.1 Disability Devices Market Position in the Broader Automotive Value Chain
- 3.1.2 OEM vs. Replacement Market Dynamics
- 3.1.3 Market Maturity & Development Stage by Region
- 3.2 Disability Devices Market Drivers
- 3.3 Disability Devices Market Restraints & Challenges
- 3.4 Disability Devices Market Opportunities
- 3.5 Porter's Five Forces Analysis
- 3.5.1 Threat of New Entrants
- 3.5.2 Bargaining Power of Suppliers
- 3.5.3 Bargaining Power of Buyers
- 3.5.4 Threat of Substitutes
- 3.5.5 Competitive Rivalry – Intensity Assessment
- 3.6 Disability Devices Value Chain Analysis
- 3.6.1 Upstream – Raw Material/Input Suppliers
- 3.6.1.1 Raw Material/Input 1
- 3.6.1.2 Raw Material/Input 2
- 3.6.1.3 Raw Material/Input 3
- 3.6.2 Midstream – Production/Manufacturing/Service Delivery
- 3.6.2.1 Production/Process Overview
- 3.6.2.2 Key Facility Locations & Capacity by Manufacturer
- 3.6.3 Downstream – Distribution & End Consumer
- 3.6.3.1 Primary Channel – B2B/OEM
- 3.6.3.2 Secondary Channels – Dealer, Retail, Online, Direct
- 3.6.4 Value Chain Profitability Analysis
- 3.6.1 Upstream – Raw Material/Input Suppliers
- 3.7 PESTEL Analysis
- 3.7.1 Political Factors
- 3.7.2 Economic Factors
- 3.7.3 Social Factors
- 3.7.4 Technological Factors
- 3.7.5 Environmental Factors
- 3.7.6 Legal Factors
- 3.8 Disability Devices Supply Chain Analysis
- 3.8.1 Raw Material/Input Supply Risk Assessment
- 3.8.2 Manufacturing Concentration Risk (Geographic Exposure)
- 3.8.3 Trade Disruption Impact Analysis
- 3.9 Regulatory & Policy Landscape
Note: The regulatory and policy landscape section covers regulations based on their applicability to the market, Disability Devices category, geography, and scope of the study. Only regulatory frameworks with a material impact on operations, compliance, trade, sustainability, or market access are analyzed in detail.
Chapter 4. Key Investment Pockets & Opportunity Analysis
- 4.1 Disability Devices Market Attractiveness Analysis
- 4.1.1 By Region – Investment Attractiveness Matrix (Volume × CAGR)
- 4.2 Absolute Revenue Growth Opportunity
- 4.2.1 By Region – Absolute USD Growth Through 2032
- 4.3 Incremental Volume Opportunity
- 4.3.1 By Region – Incremental Volume Through 2032
- 4.3.2 Segment – Incremental Volume
- 4.4 Emerging Submarket Opportunity Deep Dive (Subject to Applicability)
- 4.5 Emerging Market Opportunity Scorecards
- 4.5.1 United States
- 4.5.2 Europe
- 4.5.3 Asia
- 4.5.4 Middle East & Africa
Note: Emerging Market Opportunity Scorecards will be included based on relevance and strategic importance. Regions listed are indicative and may vary depending on data availability and market dynamics.
Chapter 5. Disability Devices Import-Export Analysis & Trade Flows
- 5.1 Global Trade Overview
- 5.1.1 Global Export Value by Country (2025)
- 5.1.2 Global Export Volume by Country (2025)
- 5.1.3 Global Import Value by Country (2025)
- 5.1.4 Global Import Volume by Country (2025)
- 5.1.5 Net Trade Balance by Country (2025)
- 5.2 Export Analysis – Segment
- 5.2.1 Type 1 (HS Code)
- 5.2.2 Type 2 (HS Code)
- 5.2.3 Type 3 (HS Code)
- 5.2.4 Type 4 (HS Code)
- 5.2.5 Type 5 (HS Code)
- 5.3 Import Analysis – Segment
- 5.3.1 Type 1 (HS Code)
- 5.3.2 Type 2 (HS Code)
- 5.3.3 Type 3 (HS Code)
- 5.3.4 Type 4 (HS Code)
- 5.3.5 Type 5 (HS Code)
- 5.4 Average Unit Trade Prices
- 5.4.1 Average Export Price – Segment & Country
- 5.4.2 Average Import Price – Segment & Source Country
- 5.4.3 Price Trends (2025)
- 5.5 Key Trade Route Analysis
- 5.5.1 Trade Route 1
- 5.5.2 Trade Route 2
- 5.5.3 Trade Route 3
- 5.5.4 Trade Route 4
- 5.5.5 Trade Route 5
- 5.6 Trade Policy Impact Assessment
- 5.6.1 US Anti-Dumping & Section 301 Tariffs
- 5.6.2 EU Customs Union Impact
- 5.6.3 Major Free Trade Agreements
- 5.6.4 USMCA Rules of Origin
Note: Trade policy analysis will be included only where relevant to the Disability Devices market.
Chapter 6. Competitive Landscape & Company Benchmarking
- 6.1 Disability Devices Market Concentration & Structure
- 6.1.1 Herfindahl-Hirschman Index (HHI) – vs. 2025
- 6.1.2 Tier 1, Tier 2 & Tier 3 Market Structure
- 6.1.3 Global, Regional & Local Player Dynamics
- 6.2 Disability Devices Market Share Analysis – 2025
- 6.2.1 Global Revenue Share by Company
- 6.2.2 Global Volume Share by Company
- 6.2.3 Regional Revenue Share
- 6.2.4 Market Share Evolution ( vs. 2025)
- 6.2.5 OEM Segment Share by Company
- 6.2.6 Replacement Segment Share by Company
- 6.3 Production/Delivery Capacity & Facility Analysis
- 6.3.1 Global Installed Capacity
- 6.3.2 Capacity Utilization Rates
- 6.3.3 Production/Output Volume
- 6.3.4 Facility Locations & Capacity Map
- 6.3.5 Planned Capacity Additions
- 6.4 Disability Devices Competitive Benchmarking Matrix
- 6.4.1 Revenue, Volume, CAGR & Profitability Comparison
- 6.4.2 Channel Revenue Mix
- 6.4.3 Geographic Revenue Exposure
- 6.4.4 R&D Intensity
- 6.4.5 Sustainability Maturity
- 6.5 Strategic Developments in Disability Devices (Last 24 Months)
- 6.5.1 Mergers, Acquisitions & Divestments
- 6.5.2 New Disability Devices Launches
- 6.5.3 Facility Expansions
- 6.5.4 Strategic Alliances, Joint Ventures & Partnerships
- 6.5.5 Distribution Expansion & Market Entry
- 6.5.6 Sustainability & ESG Initiatives
- 6.6 Competitive Strategy Mapping
- 6.6.1 Leader, Challenger, Follower & Niche Classification
- 6.6.2 Pricing Strategy Comparison
- 6.6.3 Channel Strategy Matrix
Note: Strategic developments are included based on their materiality and the availability of reliable information.
Chapter 7. Global Disability Devices Market – By Distribution Channel
- 7.1 Segment Overview
- 7.1.1 Volume & Revenue Split by Channel (2025 & 2032)
- 7.1.2 Channel Mix Evolution (2025-2032)
Chapter 8. Regional Market Analysis – Global Overview
- 8.1 Global Regional Overview
- 8.1.1 Regional Volume Share
- 8.1.2 Regional Revenue Share
- 8.1.3 Regional Volume by Region
- 8.1.4 Regional Revenue by Region
- 8.1.5 Regional Forecast Through 2032
- 8.2 Cross-Regional Segment Analysis
- 8.2.1 By Distribution Channel
- 8.2.2 By Brand/Price Tier
Chapter 9. North America Disability Devices Market
- 9.1 United States
- 9.2 Canada
- 9.3 Mexico
Chapter 10. Europe Disability Devices Market
- 10.1 Germany
- 10.2 France
- 10.3 Italy
- 10.4 United Kingdom
- 10.5 Spain
- 10.6 Poland
- 10.7 Russia
- 10.8 Netherlands
- 10.9 Belgium
- 10.10 Sweden
- 10.11 Denmark
- 10.12 Norway
- 10.13 Rest of Europe
Chapter 11. Asia Pacific Disability Devices Market
- 11.1 China
- 11.2 India
- 11.3 Japan
- 11.4 South Korea
- 11.5 Thailand
- 11.6 Indonesia
- 11.7 Vietnam
- 11.8 Malaysia
- 11.9 Australia
- 11.10 Rest of Asia Pacific
Chapter 12. Latin America Disability Devices Market
- 12.1 Brazil
- 12.2 Argentina
- 12.3 Colombia
- 12.4 Chile
- 12.5 Rest of Latin America
Chapter 13. Middle East Disability Devices Market
- 13.1 Saudi Arabia
- 13.2 United Arab Emirates
- 13.3 Turkey
- 13.4 Israel
- 13.5 Iran
- 13.6 Rest of the Middle East
Chapter 14. Africa Disability Devices Market
- 14.1 South Africa
- 14.2 Egypt
- 14.3 Nigeria
- 14.4 Morocco
- 14.5 Rest of Africa
Chapter 15. Disability Devices Company Profiles
- 15.1 [Company 01]
- 15.1.1 Company Overview
- 15.1.2 Key Management Personnel
- 15.1.3 Products & Services Portfolio
- 15.1.4 Financial Performance
- 15.1.5 Key Market Focus & Geographic Presence
- 15.1.6 Recent Developments & Strategic Initiatives
Note: The company profile list is preliminary and may change based on research findings, market developments, data availability, and client requirements.
Chapter 16. Appendices
- Appendix A – List of Abbreviations & Acronyms
- Appendix B – Industry Classification Code Reference – Full Series
- Appendix C – Production & Capacity Data Tables
- Appendix D – End-Use & Demand Base Tables
- Appendix E – Consumption & Replacement Rate Assumptions
- Appendix F – ASP Reference Tables
- Appendix G – Manufacturing & Facility Database
- Appendix H – Import-Export Data Tables
- Appendix I – Regulatory Summary Tables
- Appendix J – Primary Research Participant List (Anonymized)
- Appendix K – Primary Research Questionnaire Framework
- Appendix L – Data Sources & Bibliography
- Appendix M – Market Size Divergence & Source Comparison
Chapter 17. Research Methodology
- 17.1 Research Framework & Philosophy
- 17.2 Secondary Research – Sources, Hierarchy & Data Extraction
- 17.3 Data Modeling – Bottom-Up & Top-Down Market Sizing
- 17.4 Primary Research – Stakeholder Framework, LOI & Sample Sizes
- 17.5 Forecast Methodology – Regression, Scenario & Sensitivity Analysis
- 17.6 Quality Control – Four-Layer Validation Framework
- 17.7 Limitations & Standard Assumptions
- 17.8 Disclaimer
