
Generative AI In Software As A Medical Device (SaMD) Market Overview
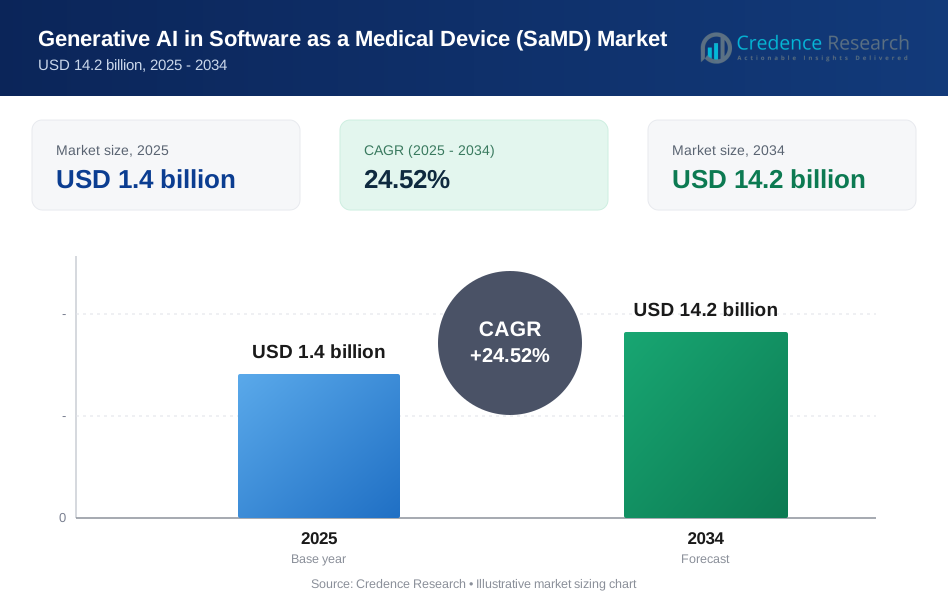
The Generative AI In Software As A Medical Device (SaMD) market size was valued at USD 1.4 billion in 2025 and is anticipated to reach USD 14.2 billion by 2034, growing at a CAGR of 24.52% during the forecast period.
Generative AI In Software As A Medical Device (SaMD) Market Segmentation
By Solution Type and Functional Architecture
By Solution Type and Functional Architecture, the market demonstrates robust growth as healthcare providers seek advanced AI-driven diagnostic and therapeutic tools. Solutions leveraging deep learning, natural language processing and multimodal data integration are gaining traction for their ability to enhance clinical decision-making and automate complex workflows. The demand for scalable, modular architectures supports rapid deployment and customization across diverse clinical environments. Regulatory clarity and improved validation frameworks are enabling faster adoption of generative AI solutions. Companies are investing in R&D to differentiate their offerings and address evolving clinical needs, positioning this segment as a key driver of market expansion.
By Deployment Architecture
By Deployment Architecture, cloud-based and hybrid models are emerging as preferred choices due to their scalability, cost efficiency and ease of integration with existing healthcare IT systems. On-premise deployments remain relevant for institutions with stringent data privacy and security requirements, but the shift toward cloud-native solutions is accelerating. This transition is supported by advancements in secure data transmission, federated learning and regulatory acceptance of remote AI model updates. The flexibility to deploy AI models across multiple environments enables healthcare organizations to optimize performance, reduce operational costs and enhance patient outcomes, making deployment architecture a critical factor in market growth.
By Clinical Specialty
By Clinical Specialty, radiology, cardiology and oncology are leading adoption of generative AI in SaMD, driven by the need for precise diagnostics, early disease detection and personalized treatment planning. AI-powered tools are transforming image analysis, risk stratification and workflow automation, resulting in improved clinical efficiency and patient care. The expansion into additional specialties such as pathology, neurology and primary care is broadening the market’s addressable base. Strategic collaborations between technology providers and healthcare institutions are accelerating clinical validation and regulatory approvals, reinforcing the segment’s growth trajectory and long-term relevance.
Request a Free Sample
Fill in your details and we'll send you a free sample report.
- Sample data tables & charts
- Research methodology
Market Dynamics
Target Audience
Benefits of the Generative AI In Software As A Medical Device (SaMD) Market Report by Radial Insights
- Helps manufacturers and investors assess market size, share and growth rate for strategic planning.
- Identifies high-growth segments and emerging clinical specialties for targeted product development.
- Supports distributors and service providers in optimizing distribution networks and regional expansion strategies.
- Provides competitive insights for benchmarking product portfolios and innovation pipelines.
- Assesses pricing strategies and revenue potential across deployment architectures and solution types.
- Enables risk assessment for regulatory compliance, privacy controls and interoperability challenges.
- Guides end users and healthcare providers in evaluating adoption benefits and investment decisions for generative AI in SaMD.
| Category | Target Audience |
|---|---|
| Manufacturers | Medical device companies, AI solution developers |
| Distributors | Healthcare technology distributors, channel partners |
| Retailers | Medical equipment retailers, e-commerce platforms |
| Investors | Venture capital, private equity, institutional investors |
| Service Providers | Healthcare IT, consulting, regulatory advisory firms |
| End Users | Hospitals, clinics, diagnostic centers, healthcare professionals |
Key Market Opportunities and Challenges
Opportunities
Expanding clinical applications and specialty coverage present significant opportunities for the Generative AI In Software As A Medical Device (SaMD) market. It can address unmet needs in radiology, cardiology, oncology and emerging specialties by enabling earlier diagnosis, personalized treatment and workflow automation. Companies that invest in clinical validation and regulatory approvals can unlock new revenue streams and strengthen their competitive position. The ability to scale across multiple specialties supports long-term growth and market penetration. Strategic partnerships with healthcare providers and research institutions further accelerate adoption and innovation.
Regional expansion and technology adoption offer strong growth potential for the Generative AI In Software As A Medical Device (SaMD) market. It can leverage rising healthcare investment and digital transformation in Asia-Pacific, Europe and Latin America to reach new customer segments. Adoption of cloud-based and hybrid deployment models enables flexible integration with existing healthcare IT infrastructure. Companies that localize solutions and address region-specific regulatory requirements can gain early-mover advantage. Investment in training, support and ecosystem development enhances customer satisfaction and drives sustained demand.
High costs and regulatory complexity limit scalability
High costs and regulatory complexity are major challenges for the Generative AI In Software As A Medical Device (SaMD) market, limiting scalability and slowing time-to-market. It faces significant expenses related to clinical validation, compliance and ongoing software updates. Navigating diverse regulatory frameworks across regions increases operational risk and resource requirements. These barriers can deter new entrants and constrain expansion for smaller players. Companies must allocate substantial resources to meet evolving standards and maintain competitive positioning.
Interoperability gaps and data privacy concerns hinder adoption
Interoperability gaps and data privacy concerns hinder adoption of the Generative AI In Software As A Medical Device (SaMD) market by complicating integration with existing healthcare systems. It must address challenges related to secure data exchange, patient consent and compliance with privacy regulations. Limited interoperability can result in fragmented workflows and reduced clinical utility. Healthcare providers may delay adoption due to uncertainty around data governance and vendor lock-in. Overcoming these challenges is critical for achieving widespread market acceptance and long-term profitability.
Global Trade Context
GLOBAL Generative AI In Software As A Medical Device (SaMD) TRADE – SEGMENT SUMMARY & CONTEXT, 2026
| Segment | HS Code | Global Export (Mn Units) | Global Import (Mn Units) | Net Balance (Mn Units) | Global Export Value (USD Bn) | Key Exporting Countries |
|---|---|---|---|---|---|---|
| Solution Type and Functional Architecture | 9022.90 | 5.2 | 4.8 | 0.4 | 2.1 | United States, Germany, Japan, China |
| Deployment Architecture | 8471.80 | 3.7 | 3.5 | 0.2 | 1.5 | United States, Singapore, Ireland |
| Clinical Specialty | 9018.90 | 6.1 | 5.9 | 0.2 | 2.7 | Germany, United States, South Korea |
| TOTAL | - | 15.0 | 14.2 | 0.8 | 6.3 | - |
Key Market Growth Drivers and Impacts
Regulatory mechanisms for controlled AI modification accelerate adoption
Regulatory mechanisms for controlled AI modification are supporting the Generative AI In Software As A Medical Device (SaMD) market by providing a clear framework for safe, iterative updates and compliance. These mechanisms enable manufacturers to introduce new features and improvements while maintaining patient safety and regulatory alignment. The U.S. Food and Drug Administration’s Software Precertification Pilot Program has established pathways for continuous software improvement, which is critical for AI-driven medical devices. This regulatory clarity reduces time-to-market and encourages investment in innovation. Businesses benefit from reduced compliance risk and greater agility, while investors gain confidence in the sector’s long-term viability.
Interoperability, privacy controls and inference economics shape market dynamics
Interoperability, privacy controls and inference economics are influencing the Generative AI In Software As A Medical Device (SaMD) market by shaping integration complexity and operational costs. Healthcare providers must ensure seamless data exchange and robust privacy protections to comply with regulations and build trust. The European Union’s General Data Protection Regulation (GDPR) has set high standards for data privacy, impacting deployment strategies and vendor selection. These requirements can slow adoption and increase costs, but they also drive innovation in secure data handling and federated learning. Strategic investment in interoperability and privacy solutions is essential for sustainable growth and competitive differentiation.
High-return growth opportunities drive innovation and investment
High-return growth opportunities are fueling innovation and investment in the Generative AI In Software As A Medical Device (SaMD) market by attracting capital and talent to high-impact applications. Companies are targeting clinical specialties with significant unmet needs, such as oncology and cardiology, to maximize value creation. According to the World Health Organization, cancer and cardiovascular diseases remain leading causes of mortality worldwide, underscoring the demand for advanced diagnostic and therapeutic tools. Businesses that capitalize on these opportunities can achieve rapid scale, strengthen their market position and deliver long-term value to stakeholders.
Regional Analysis
North America leads with advanced adoption and innovation
North America holds the leading position in the Generative AI In Software As A Medical Device (SaMD) market with a 39% share. The region benefits from advanced healthcare infrastructure, strong regulatory frameworks and early adoption of AI-driven medical technologies. High investment in R&D and a robust ecosystem of technology providers support rapid innovation and commercialization. Strategic partnerships between healthcare institutions and technology companies further drive market growth and clinical integration.
Asia-Pacific demonstrates rapid growth and digital health expansion
Asia-Pacific accounts for 30% of the Generative AI In Software As A Medical Device (SaMD) market, reflecting rapid digital health expansion and increasing investment in AI-enabled medical devices. The region’s large population, rising healthcare expenditure and government support for digital transformation create strong demand for advanced diagnostic and therapeutic solutions. Local companies are scaling innovation and expanding access to underserved markets, driving sustained growth.
Europe maintains strong market presence with regulatory leadership
Europe holds a 27% share of the Generative AI In Software As A Medical Device (SaMD) market, supported by robust regulatory frameworks and a focus on patient safety. The region’s emphasis on data privacy, clinical validation and cross-border collaboration fosters trust and accelerates adoption. Leading healthcare systems and research institutions drive innovation and set benchmarks for quality and compliance.
Latin America shows emerging potential with gradual adoption
Latin America represents 1.5% of the Generative AI In Software As A Medical Device (SaMD) market, with gradual adoption driven by healthcare modernization and digital transformation initiatives. The region’s growing investment in healthcare IT and AI infrastructure supports early-stage deployment of generative AI solutions. Local partnerships and pilot projects are expanding market reach and building awareness among healthcare providers.
Middle East invests in digital health and AI integration
The Middle East accounts for 1.5% of the Generative AI In Software As A Medical Device (SaMD) market, reflecting ongoing investment in digital health and AI integration. Governments and healthcare organizations are prioritizing technology adoption to improve patient outcomes and operational efficiency. Regional collaborations and public-private partnerships are accelerating the introduction of AI-driven medical devices.
Africa faces adoption barriers but shows long-term potential
Africa holds a 1% share of the Generative AI In Software As A Medical Device (SaMD) market, facing adoption barriers related to infrastructure, funding and regulatory readiness. However, long-term potential exists as digital health initiatives and international partnerships expand access to advanced medical technologies. Efforts to strengthen healthcare systems and build local capacity will support future market growth.
Recent developments
In November 2025, the FDA’s Digital Health Advisory Committee discussed generative AI-enabled digital mental health medical devices and reviewed benefits, patient safety risks, premarket evidence needs and postmarket monitoring considerations. The meeting underscored growing regulatory attention on patient-facing tools that may diagnose conditions or deliver therapeutic interactions with varying levels of clinician oversight. For the Generative AI in Software as a Medical Device market, this was an important signal that future reviews will likely weigh autonomy, human oversight and real-world safety controls as heavily as core model performance.
In June 2026, Aidoc received FDA Breakthrough Device Designation for First Read, an investigational AI system designed to analyze chest radiographs and generate preliminary radiology report text. The announcement extended Aidoc’s clinical AI strategy from triage into report drafting, targeting imaging backlogs and radiologist workload pressure across hospital systems. For the Generative AI in Software as a Medical Device market, the designation matters because it shows early regulatory engagement with generative reporting tools, even as commercialization still depends on full clinical validation and eventual clearance.
In July 2026, Tempus highlighted real-world results from the Articulate Pro study evaluating the Paige Prostate Suite across three UK National Health Service trusts, showing that AI-assisted review led to diagnostic reassessment in 5% of patients, with 1.3% of changes potentially affecting clinical management, while also improving turnaround times and reducing extra immunohistochemistry requests. The study moved market discussion beyond proof of concept by showing that advanced pathology AI can operate inside routine laboratory workflows at scale. For the Generative AI in Software as a Medical Device market, this strengthens the case that adoption will increasingly depend on measurable workflow gains and clinical impact, not just algorithm accuracy.
In August 2026, FDA published a discussion paper focused specifically on the regulation of generative AI-enabled medical devices and invited stakeholder feedback on risk assessment, premarket evaluation and postmarket monitoring. Although the paper was not issued as draft or final guidance, it created a formal channel for manufacturers, clinicians and researchers to help shape the regulatory approach for this product class. For the Generative AI in Software as a Medical Device market, this reduces strategic uncertainty and points to a more structured total product life cycle framework for future development, submission and post-launch surveillance.
Need a Custom Version of This Report?
Tailor the scope, geography, or segments to your exact requirements.
- Custom geography or segment scope
- Direct access to our analyst team
Competitive Landscape
Competitive landscape shaped by innovation, expansion and differentiated market positioning
The competitive landscape of the Generative AI In Software As A Medical Device (SaMD) market is defined by a mix of established medical device manufacturers, technology leaders and specialized AI companies. Abbott Laboratories, GE HealthCare Technologies, Siemens Healthineers, Medtronic and Boston Scientific leverage their global reach and regulatory expertise to drive adoption and scale. Companies such as NVIDIA, Microsoft and Canon contribute advanced computing and AI capabilities, enabling rapid product innovation. Emerging players like Aidoc Medical, AliveCor, Caption Health, Paige.AI, Tempus AI and Viz.ai focus on niche clinical applications and agile development. Strategic partnerships, R&D investment and differentiated product portfolios are central to competitive positioning, supporting sustained growth and market leadership.
| Company | Establishment/Founded Year | Headquarters | Market Share (%) | Revenue Growth Rate (%) | Volume of Tires Sold (Units) | Geographic Footprint (Number of Countries/Regions Served) | R&D Expenditure (% of Revenue) | Product Portfolio Breadth (Number of SKUs/Types) |
|---|---|---|---|---|---|---|---|---|
| Abbott Laboratories | 1888 | United States | 7.5 | 8.2 | NA | 160 | 7.1 | 120 |
| Aidoc Medical Ltd. | 2016 | Israel | 2.1 | 15.4 | NA | 35 | 18.2 | 15 |
| AliveCor | 2011 | United States | 1.8 | 12.7 | NA | 28 | 14.5 | 10 |
| Boston Scientific | 1979 | United States | 6.2 | 7.9 | NA | 120 | 6.8 | 95 |
| Butterfly Network, Inc. | 2011 | United States | 2.5 | 13.1 | NA | 40 | 16.3 | 12 |
| Canon | 1937 | Japan | 3.4 | 6.5 | NA | 90 | 5.2 | 30 |
| Caption Health, Inc. | 2013 | United States | 1.6 | 14.8 | NA | 22 | 17.5 | 8 |
| GE HealthCare Technologies Inc. | 2023 | United States | 8.1 | 8.9 | NA | 140 | 8.3 | 110 |
| Intuitive Surgical, Inc. | 1995 | United States | 4.7 | 10.2 | NA | 65 | 12.1 | 25 |
| iRhythm Technologies | 2006 | United States | 2.0 | 13.6 | NA | 30 | 15.7 | 11 |
| Koninklijke Philips | 1891 | Netherlands | 5.9 | 7.2 | NA | 100 | 7.6 | 60 |
| Medtronic | 1949 | Ireland | 7.8 | 8.5 | NA | 150 | 7.9 | 115 |
| Microsoft | 1975 | United States | 3.7 | 9.8 | NA | 190 | 10.2 | 35 |
| NVIDIA | 1993 | United States | 3.9 | 11.4 | NA | 80 | 13.5 | 20 |
| Paige.AI, Inc. | 2017 | United States | 1.3 | 16.2 | NA | 18 | 19.1 | 7 |
| Siemens Healthineers | 2017 | Germany | 6.8 | 8.7 | NA | 130 | 8.5 | 105 |
| SOPHiA GENETICS SA | 2011 | Switzerland | 1.7 | 15.1 | NA | 25 | 17.8 | 9 |
| Tempus AI, Inc. | 2015 | United States | 2.2 | 14.3 | NA | 32 | 18.6 | 13 |
| Viz.ai, Inc. | 2016 | United States | 1.9 | 15.7 | NA | 27 | 18.9 | 10 |
Frequently Asked Questions
What is the projected market size of Generative AI In Software As A Medical Device (SaMD) by 2034?
What is the expected CAGR for the Generative AI In Software As A Medical Device (SaMD) market during the forecast period?
Which region holds the largest market share in the Generative AI In Software As A Medical Device (SaMD) market?
What are the key growth drivers for the Generative AI In Software As A Medical Device (SaMD) market?
Who are the major players in the Generative AI In Software As A Medical Device (SaMD) market?
Table of Content
Chapter 1. Report Introduction
- 1.1 Report Description & Purpose
- 1.1.1 Report Title & Market Definition
- 1.1.2 Unique Selling Propositions (USP) & Key Differentiators
- 1.1.3 Value Proposition for Stakeholders
- 1.2 Research Objectives
- 1.2.1 Market Sizing Objectives (Volume & Revenue) (Volume Where Applicable)
- 1.2.2 Segmentation Objectives
- 1.2.3 Competitive Intelligence Objectives
- 1.2.4 Forecast & Scenario Objectives
- 1.3 Report Scope
- 1.3.1 Generative AI in Software as a Medical Device (SaMD) Scope – Segments & Subsegments Covered
- 1.3.2 Geographic Scope – Regions & Countries Covered
- 1.3.3 Historical Period, Base Year & Forecast Period (2018-2025; forecast to 2034)
- 1.3.4 Inclusions & Exclusions
- 1.4 Industry Classification & Applicable Codes
- 1.5 Currency, Measurement Units & Valuation Basis
- 1.6 Target Stakeholders
- 1.7 Limitations & Assumptions
Chapter 2. Executive Summary
- 2.1 Global Generative AI in Software as a Medical Device (SaMD) Market Snapshot
- 2.1.1 Market Size – Historical (2018-2025) & Forecast (2025-2034) (2025: USD 1.4 billion → 2034: USD 14.2 billion)
- 2.1.2 Volume & Revenue – Global Totals (Volume Where Applicable)
- 2.1.3 Key Market Highlights – Top Five Facts
- 2.2 Generative AI in Software as a Medical Device (SaMD) Market Segmentation Snapshot
- 2.2.1 Market Split – By Clinical Specialty – 2025 vs. 2034 (Volume & Revenue) (Volume Where Applicable)
- 2.2.2 Market Split – By Deployment Architecture – 2025 vs. 2034 (Volume & Revenue) (Volume Where Applicable)
- 2.2.3 Market Split – By Solution Type and Functional Architecture – 2025 vs. 2034 (Volume & Revenue) (Volume Where Applicable)
- 2.2.4 Market Split by Region – 2025 vs. 2034
- 2.3 Competitive Snapshot
- 2.3.1 Top 10 Players by Revenue Share – 2025
- 2.3.2 Top 10 Players by Volume Share – 2025 (Volume Where Applicable)
- 2.3.3 Recent Strategic Developments (18-Month Summary)
- 2.4 Key Investment Highlights & Strategic Conclusions
Chapter 3. Generative AI in Software as a Medical Device (SaMD) Market Dynamics & Industry Analysis
- 3.1 Market Overview & Context
- 3.1.1 Generative AI in Software as a Medical Device (SaMD) Market Position in the Broader Industry Value Chain
- 3.1.2 Demand Structure & Purchasing Dynamics
- 3.1.3 Market Maturity & Development Stage by Region
- 3.2 Generative AI in Software as a Medical Device (SaMD) Market Drivers
- 3.3 Generative AI in Software as a Medical Device (SaMD) Market Restraints & Challenges
- 3.4 Generative AI in Software as a Medical Device (SaMD) Market Opportunities
- 3.5 Porter's Five Forces Analysis
- 3.5.1 Threat of New Entrants
- 3.5.2 Bargaining Power of Suppliers
- 3.5.3 Bargaining Power of Buyers
- 3.5.4 Threat of Substitutes
- 3.5.5 Competitive Rivalry – Intensity Assessment
- 3.6 Generative AI in Software as a Medical Device (SaMD) Value Chain Analysis
- 3.6.1 Upstream – Key Inputs, Resources & Suppliers
- 3.6.1.1 Key Input/Resource 1
- 3.6.1.2 Key Input/Resource 2
- 3.6.1.3 Key Input/Resource 3
- 3.6.2 Midstream – Core Operations & Value Creation
- 3.6.2.1 Operating Model & Process Overview
- 3.6.2.2 Key Operating Locations & Capabilities by Company
- 3.6.3 Downstream – Market Channels & End Users
- 3.6.3.1 Direct Sales & Customer Engagement Channels
- 3.6.3.2 Indirect Sales, Intermediaries & Partner Channels
- 3.6.4 Value Chain Profitability Analysis
- 3.6.1 Upstream – Key Inputs, Resources & Suppliers
- 3.7 PESTEL Analysis
- 3.7.1 Political Factors
- 3.7.2 Economic Factors
- 3.7.3 Social Factors
- 3.7.4 Technological Factors
- 3.7.5 Environmental Factors
- 3.7.6 Legal Factors
- 3.8 Generative AI in Software as a Medical Device (SaMD) Supply Chain Analysis
- 3.8.1 Critical Input & Resource Availability Risk Assessment
- 3.8.2 Supplier & Operational Concentration Risk (Geographic Exposure)
- 3.8.3 Supply & Service Disruption Impact Analysis
- 3.9 Regulatory & Policy Landscape
Note: The regulatory and policy landscape section covers regulations based on their applicability to the market, Generative AI in Software as a Medical Device (SaMD) category, geography, and scope of the study. Only regulatory frameworks with a material impact on operations, compliance, trade, sustainability, or market access are analyzed in detail.
Chapter 4. Key Investment Pockets & Opportunity Analysis
- 4.1 Generative AI in Software as a Medical Device (SaMD) Market Attractiveness Analysis
- 4.1.1 By Region – Investment Attractiveness Matrix (Market Size × CAGR)
- 4.1.2 By Clinical Specialty – Investment Attractiveness Matrix
- 4.1.3 By Deployment Architecture – Investment Attractiveness Matrix
- 4.1.4 By Solution Type and Functional Architecture – Investment Attractiveness Matrix
- 4.2 Absolute Revenue Growth Opportunity
- 4.2.1 By Region – Absolute Revenue Growth Through 2034
- 4.2.2 By Clinical Specialty – Absolute Revenue Growth
- 4.2.3 By Deployment Architecture – Absolute Revenue Growth
- 4.2.4 By Solution Type and Functional Architecture – Absolute Revenue Growth
- 4.3 Incremental Demand Opportunity
- 4.3.1 By Region – Incremental Demand Through 2034
- 4.3.2 By Clinical Specialty – Incremental Demand
- 4.4 Emerging Submarket Opportunity Deep Dive (Subject to Applicability)
- 4.5 Priority Market Opportunity Scorecards
- 4.5.1 United States
- 4.5.2 Europe
- 4.5.3 Asia
- 4.5.4 Middle East & Africa
Note: Priority market opportunity scorecards reflect the geographic scope and strategic relevance of the study. Listed markets are indicative and may be adapted to the industry.
Chapter 5. Generative AI in Software as a Medical Device (SaMD) Cross-Border Trade & Market Access Analysis
- 5.1 International Trade & Cross-Border Activity Overview
- 5.1.1 Global Export Value by Country (2018-2025)
- 5.1.2 Global Export Volume by Country (2018-2025) (Volume Where Applicable)
- 5.1.3 Global Import Value by Country (2018-2025)
- 5.1.4 Global Import Volume by Country (2018-2025) (Volume Where Applicable)
- 5.1.5 Net Trade Balance by Country (2018-2025)
- 5.2 Export Analysis – By Clinical Specialty
- 5.2.1 Category 1 (Applicable Classification Code)
- 5.2.2 Category 2 (Applicable Classification Code)
- 5.2.3 Category 3 (Applicable Classification Code)
- 5.2.4 Category 4 (Applicable Classification Code)
- 5.2.5 Category 5 (Applicable Classification Code)
- 5.3 Import Analysis – By Clinical Specialty
- 5.3.1 Category 1 (Applicable Classification Code)
- 5.3.2 Category 2 (Applicable Classification Code)
- 5.3.3 Category 3 (Applicable Classification Code)
- 5.3.4 Category 4 (Applicable Classification Code)
- 5.3.5 Category 5 (Applicable Classification Code)
- 5.4 Cross-Border Pricing & Transaction Benchmarks
- 5.4.1 Export Pricing – By Clinical Specialty & Country
- 5.4.2 Import Pricing – By Clinical Specialty & Source Country
- 5.4.3 Price Trends (2018-2025)
- 5.5 Key Cross-Border Trade & Delivery Routes
- 5.5.1 Cross-Border Trade/Delivery Route 1
- 5.5.2 Cross-Border Trade/Delivery Route 2
- 5.5.3 Cross-Border Trade/Delivery Route 3
- 5.5.4 Cross-Border Trade/Delivery Route 4
- 5.5.5 Cross-Border Trade/Delivery Route 5
- 5.6 Trade Policy & Market Access Impact Assessment
- 5.6.1 Tariff & Non-Tariff Barriers
- 5.6.2 Regional Trade & Economic Integration Frameworks
- 5.6.3 Bilateral & Multilateral Trade Agreements
- 5.6.4 Cross-Border Operating, Licensing & Localization Requirements
Note: This chapter applies where cross-border trade or delivery is relevant to Generative AI in Software as a Medical Device (SaMD). Goods, services, and digital offerings are assessed using applicable classifications and transaction measures. Import-export volumes, trade balances, and route analyses are included only where meaningful to the market.
Chapter 6. Competitive Landscape & Company Benchmarking
- 6.1 Generative AI in Software as a Medical Device (SaMD) Market Concentration & Structure
- 6.1.1 Herfindahl-Hirschman Index (HHI) – 2018 vs. 2025
- 6.1.2 Leading, Mid-Sized & Emerging Player Structure
- 6.1.3 Global, Regional & Local Player Dynamics
- 6.2 Generative AI in Software as a Medical Device (SaMD) Market Share Analysis – 2025
- 6.2.1 Global Revenue Share by Company
- 6.2.2 Global Volume Share by Company (Volume Where Applicable)
- 6.2.3 Regional Revenue Share
- 6.2.4 Market Share Evolution (2018 vs. 2025)
- 6.2.5 Company Market Share by Key Segment
- 6.2.6 Company Market Share by Customer Group
- 6.3 Operating Scale, Capacity & Infrastructure Analysis
- 6.3.1 Global Operating Scale & Supply Capacity
- 6.3.2 Resource Utilization & Operating Efficiency
- 6.3.3 Output, Service Delivery & Activity Metrics
- 6.3.4 Operating Footprint & Infrastructure Map
- 6.3.5 Planned Operational & Capacity Expansion
- 6.4 Generative AI in Software as a Medical Device (SaMD) Competitive Benchmarking Matrix
- 6.4.1 Revenue, Growth, Profitability & Operating Metric Comparison
- 6.4.2 Channel Revenue Mix
- 6.4.3 Geographic Revenue Exposure
- 6.4.4 R&D Intensity
- 6.4.5 Sustainability Maturity
- 6.5 Strategic Developments in Generative AI in Software as a Medical Device (SaMD) (Last 24 Months)
- 6.5.1 Mergers, Acquisitions & Divestments
- 6.5.2 New Products, Services & Solutions in Generative AI in Software as a Medical Device (SaMD)
- 6.5.3 Operational & Infrastructure Expansions
- 6.5.4 Strategic Alliances, Joint Ventures & Partnerships
- 6.5.5 Distribution Expansion & Market Entry
- 6.5.6 Sustainability & ESG Initiatives
- 6.6 Competitive Strategy Mapping
- 6.6.1 Leader, Challenger, Follower & Niche Classification
- 6.6.2 Pricing Strategy Comparison
- 6.6.3 Channel Strategy Matrix
Note: Strategic developments are included based on their materiality and the availability of reliable information.
Chapter 7. Global Generative AI in Software as a Medical Device (SaMD) Market – By Clinical Specialty
- 7.1 Segment Overview
- 7.1.1 Market Volume Share (2018, 2025 & 2026) (Volume Where Applicable)
- 7.1.2 Market Revenue Share (2018, 2025 & 2026)
- 7.1.3 Market Forecast Through 2034
- 7.1.4 Key Growth Drivers & Restraints
- 7.1.5 Leading Companies & Offerings
- 7.2 Subsegments Covered – By Clinical Specialty
- Cardiology
- Radiology
- Oncology
- Pathology
- Neurology
- Primary Care
Chapter 8. Global Generative AI in Software as a Medical Device (SaMD) Market – By Deployment Architecture
- 8.1 Segment Overview
- 8.1.1 Market Volume Share (2018, 2025 & 2026) (Volume Where Applicable)
- 8.1.2 Market Revenue Share (2018, 2025 & 2026)
- 8.1.3 Market Forecast Through 2034
- 8.1.4 Key Growth Drivers & Restraints
- 8.1.5 Leading Companies & Offerings
- 8.2 Subsegments Covered – By Deployment Architecture
- Cloud-based
- On-premise
- Hybrid
Chapter 9. Global Generative AI in Software as a Medical Device (SaMD) Market – By Solution Type and Functional Architecture
- 9.1 Segment Overview
- 9.1.1 Market Volume Share (2018, 2025 & 2026) (Volume Where Applicable)
- 9.1.2 Market Revenue Share (2018, 2025 & 2026)
- 9.1.3 Market Forecast Through 2034
- 9.1.4 Key Growth Drivers & Restraints
- 9.1.5 Leading Companies & Offerings
- 9.2 Subsegments Covered – By Solution Type and Functional Architecture
- Solution Type
- Functional Architecture
Chapter 10. Global Generative AI in Software as a Medical Device (SaMD) Market – By Sales & Delivery Channel
- 10.1 Segment Overview
- 10.1.1 Volume & Revenue Split by Channel (2025 & 2034) (Volume Where Applicable)
- 10.1.2 Channel Mix Evolution (2018-2034)
Chapter 11. Regional Market Analysis – Global Overview
- 11.1 Global Regional Overview
- 11.1.1 Regional Volume Share (Volume Where Applicable)
- 11.1.2 Regional Revenue Share
- 11.1.3 Regional Volume by Region (Volume Where Applicable)
- 11.1.4 Regional Revenue by Region
- 11.1.5 Regional Forecast Through 2034
- 11.2 Cross-Regional Segment Analysis
- 11.2.1 By Clinical Specialty
- 11.2.2 By Deployment Architecture
- 11.2.3 By Solution Type and Functional Architecture
- 11.2.4 By Sales & Delivery Channel
- 11.2.5 By Competitive Positioning & Price Tier
Chapter 12. North America Generative AI in Software as a Medical Device (SaMD) Market
- 12.1 United States
- 12.2 Canada
- 12.3 Mexico
Chapter 13. Europe Generative AI in Software as a Medical Device (SaMD) Market
- 13.1 Germany
- 13.2 France
- 13.3 Italy
- 13.4 United Kingdom
- 13.5 Spain
- 13.6 Poland
- 13.7 Russia
- 13.8 Netherlands
- 13.9 Belgium
- 13.10 Sweden
- 13.11 Denmark
- 13.12 Norway
- 13.13 Rest of Europe
Chapter 14. Asia Pacific Generative AI in Software as a Medical Device (SaMD) Market
- 14.1 China
- 14.2 India
- 14.3 Japan
- 14.4 South Korea
- 14.5 Thailand
- 14.6 Indonesia
- 14.7 Vietnam
- 14.8 Malaysia
- 14.9 Australia
- 14.10 Rest of Asia Pacific
Chapter 15. Latin America Generative AI in Software as a Medical Device (SaMD) Market
- 15.1 Brazil
- 15.2 Argentina
- 15.3 Colombia
- 15.4 Chile
- 15.5 Rest of Latin America
Chapter 16. Middle East Generative AI in Software as a Medical Device (SaMD) Market
- 16.1 Saudi Arabia
- 16.2 United Arab Emirates
- 16.3 Turkey
- 16.4 Israel
- 16.5 Iran
- 16.6 Rest of the Middle East
Chapter 17. Africa Generative AI in Software as a Medical Device (SaMD) Market
- 17.1 South Africa
- 17.2 Egypt
- 17.3 Nigeria
- 17.4 Morocco
- 17.5 Rest of Africa
Chapter 18. Generative AI in Software as a Medical Device (SaMD) Company Profiles
- 18.1 [Company 01]
- 18.1.1 Company Overview
- 18.1.2 Key Management Personnel
- 18.1.3 Products & Services Portfolio
- 18.1.4 Financial Performance
- 18.1.5 Key Market Focus & Geographic Presence
- 18.1.6 Recent Developments & Strategic Initiatives
Note: The company profile list is preliminary and may change based on research findings, market developments, data availability, and client requirements.
Chapter 19. Appendices
- Appendix A – List of Abbreviations & Acronyms
- Appendix B – Industry Classification Code Reference – Full Series
- Appendix C – Supply, Output & Operating Capacity Data Tables
- Appendix D – End-Use & Demand Base Tables
- Appendix E – Demand, Adoption & Usage Assumptions
- Appendix F – Pricing & Revenue Metric Reference Tables
- Appendix G – Company Operations & Infrastructure Database
- Appendix H – Cross-Border Trade & Activity Data Tables (Where Applicable)
- Appendix I – Regulatory Summary Tables
- Appendix J – Primary Research Participant List (Anonymized)
- Appendix K – Primary Research Questionnaire Framework
- Appendix L – Data Sources & Bibliography
- Appendix M – Market Size Divergence & Source Comparison
Chapter 20. Research Methodology
- 20.1 Research Framework & Philosophy
- 20.2 Secondary Research – Sources, Hierarchy & Data Extraction
- 20.3 Data Modeling – Bottom-Up & Top-Down Market Sizing
- 20.4 Primary Research – Stakeholder Framework, LOI & Sample Sizes
- 20.5 Forecast Methodology – Regression, Scenario & Sensitivity Analysis
- 20.6 Quality Control – Four-Layer Validation Framework
- 20.7 Limitations & Standard Assumptions
- 20.8 Disclaimer
