
Distribution Feeder Automation System Market Overview:
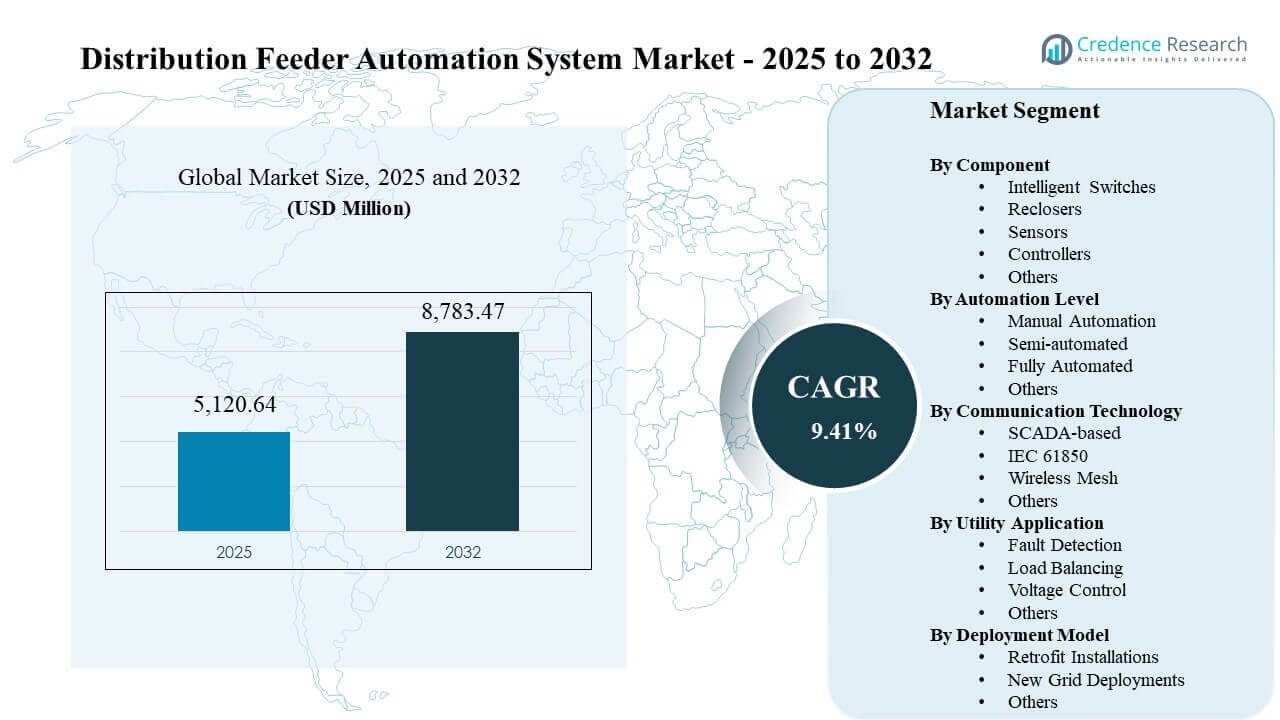
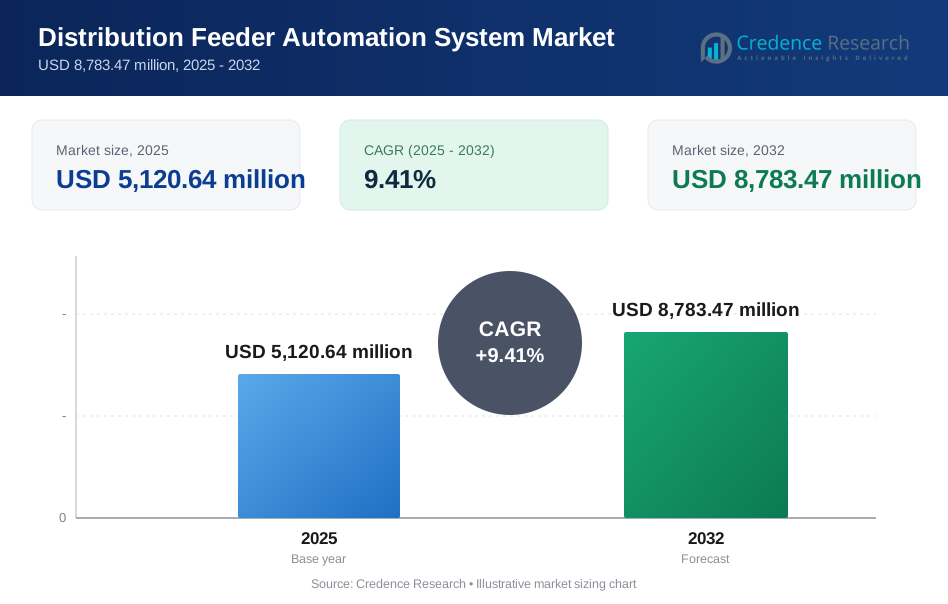
The Distribution Feeder Automation System Market size was estimated at USD 5,120.64 million in 2025 and is expected to reach USD 8,783.47 million by 2032, growing at a CAGR of 9.41% from 2025 to 2032. Utility investment in feeder-level fault detection, automated isolation, restoration controls, and real-time monitoring is strengthening adoption as power networks face higher outage risk, renewable integration, peak-load pressure, and rising expectations for service reliability. North America remains a major adoption hub due to grid modernization programs, while Asia Pacific continues to gain momentum through large-scale distribution upgrades in high-demand electricity markets.
| REPORT ATTRIBUTE | DETAILS |
|---|---|
| Historical Period | 2020-2024 |
| Base Year | 2025 |
| Forecast Period | 2026-2032 |
| Distribution Feeder Automation System Market Size 2025 | USD 5,120.64 million |
| Distribution Feeder Automation System Market, CAGR | 9.41% |
| Distribution Feeder Automation System Market Size 2032 | USD 8,783.47 million |
Key Market Trends & Insights
- The Distribution Feeder Automation System Market was valued at USD 5,120.64 million in 2025 and is forecast to reach USD 8,783.47 million by 2032.
- North America accounted for the largest regional share of 33.40% in 2025, supported by utility modernization and reliability investments.
- Asia Pacific held 30.25% share in 2025, reflecting rapid grid expansion, urban load growth, and smart distribution infrastructure deployment.
- Controllers led the component segment with 31.60% share in 2025, driven by feeder protection, switching automation, and control integration.
- Retrofit Installations accounted for 55.75% share in 2025 as utilities prioritized automation upgrades across existing distribution feeders.
Segment Analysis
The Distribution Feeder Automation System Market is shaped by the shift from manual feeder operation to digitally controlled distribution infrastructure. Utilities are prioritizing controllers, intelligent switches, reclosers, and sensors because these components improve outage visibility, shorten restoration time, and support automated feeder reconfiguration across complex networks. Buyers also prefer solutions that integrate with SCADA, distribution management systems, and advanced distribution management platforms. This demand is particularly strong where aging infrastructure must support renewable energy, electric vehicle charging, and rising urban electricity loads.
Automation level has become a key investment criterion as utilities balance capital limits with reliability targets. Semi-automated systems remain dominant because many utilities are still modernizing feeders in phases before adopting fully self-healing grids. SCADA-based communication continues to lead due to installed base strength, while wireless mesh and standards-based systems are gaining attention for scalable field-device connectivity. Retrofit installations remain preferred because utilities can add automation devices to existing feeders without replacing full networks, making feeder automation a critical layer in distribution grid digitalization.
By Component Insights
Controllers accounted for the largest share of 31.60% in 2025. Controllers lead because they coordinate feeder protection, switching commands, fault response, and automation logic across distribution networks. Utilities rely on controller platforms to connect field equipment with SCADA, DMS, and ADMS environments. Demand is also supported by the need for faster decision-making during outages and stronger feeder-level visibility. Intelligent switches, reclosers, and sensors continue to gain adoption as utilities expand automated restoration and condition-monitoring capabilities.
By Automation Level Insights
Semi-automated accounted for the largest share of 47.35% in 2025. Semi-automated systems lead because utilities often modernize feeders in stages before shifting to fully automated self-healing networks. These systems support remote switching, operator-assisted restoration, and improved fault response without requiring complete control architecture replacement. The segment also benefits from budget flexibility, especially for utilities with large legacy feeder networks. Fully automated systems are gaining traction where advanced communication, real-time analytics, and high reliability mandates are already in place.
By Communication Technology Insights
SCADA-based accounted for the largest share of 43.20% in 2025. SCADA-based systems lead because utility operators continue to depend on centralized monitoring, remote control, and proven communication architecture. These platforms are widely installed across substations and feeder networks, which makes SCADA integration a practical first step for automation expansion. The segment also benefits from established operator familiarity and compatibility with existing control room workflows. Wireless mesh and IEC 61850-based systems are advancing as utilities seek interoperability, faster data exchange, and scalable field connectivity.
By Utility Application Insights
Fault Detection accounted for the largest share of 42.45% in 2025. Fault detection leads because feeder automation projects are commonly justified by reduced outage duration, faster fault location, and improved restoration performance. Utilities use automated fault detection to identify faulted sections and isolate affected feeder zones more efficiently. The application also supports FLISR strategies, which help restore service to unaffected customers through alternate feeder paths. Load balancing and voltage control are gaining importance as distributed energy resources and variable electricity demand reshape feeder operations.
By Deployment Model Insights
Retrofit Installations accounted for the largest share of 55.75% in 2025. Retrofit installations lead because utilities are upgrading existing distribution infrastructure rather than replacing entire feeder networks. This approach allows operators to deploy controllers, reclosers, switches, sensors, and communication modules in a phased and cost-effective manner. Retrofit demand is strong in mature power markets with aging assets and strict reliability targets. New grid deployments remain important in high-growth electricity markets, industrial zones, renewable energy corridors, and urban expansion projects.
Distribution Feeder Automation System Market Drivers
Rising Need for Grid Reliability and Outage Reduction
Utilities are increasing feeder automation investment to reduce outage duration and improve service continuity. Automated fault detection, isolation, and restoration help operators locate faulted feeder sections faster and reroute power where alternate supply paths exist. These capabilities are important in areas exposed to storms, wildfires, aging infrastructure, and rising peak load. Distribution Feeder Automation System Market demand is also supported by regulatory pressure to improve reliability indices and customer satisfaction.
- For instance, S&C Electric reported that after deploying IntelliRupter devices, Alliant Energy reduced outage duration in one service area from 374 minutes to 34.5 minutes, while in an early event the system restored 2 MW of load to 912 customers.
Modernization of Aging Distribution Infrastructure
Aging distribution networks are creating strong demand for retrofit feeder automation projects. Many utilities are adding intelligent switches, reclosers, sensors, and controllers to legacy feeders to improve network visibility and remote control. This approach helps extend asset life while improving operational performance. Retrofit automation also allows phased investment, making modernization more manageable for utilities with large and geographically dispersed networks. Distribution Feeder Automation System Market adoption is therefore closely linked to grid renewal programs.
Integration of Renewable Energy and Distributed Energy Resources
Rising renewable energy penetration is making feeder operations more complex. Solar, wind, battery storage, and behind-the-meter resources can create bidirectional power flows and voltage fluctuations across distribution networks. Feeder automation helps utilities monitor these changes and respond through voltage control, switching, and load management. Advanced controllers and communication platforms allow operators to maintain reliability as distributed energy resources expand. Distribution Feeder Automation System Market growth benefits directly from this changing grid architecture.
- For instance, NREL documented an ADMS and utility DERMS application across four distribution feeders supplied by a 30 MVA, 110 kV/13.2 kV substation transformer, where PV smart inverters were dispatched to help mitigate feeder voltage rise.
Digitalization of Utility Operations
Utilities are shifting toward data-driven distribution management to improve visibility, control, and planning. Feeder automation systems provide real-time field data that supports operational analytics, outage response, and asset management. SCADA integration, wireless communication, and advanced control software are enabling faster coordination between substations, feeders, and control centers. This digitalization trend is encouraging utilities to modernize feeder infrastructure as part of broader smart grid programs. Distribution Feeder Automation System Market expansion is strongly tied to this digital transformation.
Distribution Feeder Automation System Market Challenges
High upfront cost remains a major challenge for feeder automation deployment. Utilities must invest in field devices, communication networks, software integration, cybersecurity, engineering, installation, and workforce training. These costs can delay projects, especially in regions with limited tariff flexibility or fragmented distribution utilities. Legacy infrastructure can also increase project complexity because older feeders may need additional upgrades before automation equipment can perform effectively. Distribution Feeder Automation System Market adoption therefore depends on funding availability and clear reliability benefits.
- For instance, Carroll EMC stated that Eaton’s feeder automation software reduced outage time by about 75 minutes for members in 2022, and the utility projected a 41% reduction in outage duration, including 34% from three-phase deployment and another 7% from single-phase deployment.
Interoperability and cybersecurity risks also affect implementation timelines. Utilities often operate mixed vendor environments involving SCADA, DMS, ADMS, recloser controls, sensors, and communication systems. Integrating these layers requires technical expertise and careful testing to avoid operational disruptions. Cybersecurity requirements are increasing as more feeder devices connect to control networks and transmit real-time data. Distribution Feeder Automation System Market suppliers must address these concerns through secure architectures, standards-based integration, and long-term service support.
Distribution Feeder Automation System Market Trends and Opportunities
Wireless communication, grid-edge intelligence, and software-driven automation are creating new opportunities in feeder automation. Utilities are adopting communication architectures that can connect field devices across wide service territories with lower installation complexity. Wireless mesh networks, secure remote controls, and analytics-enabled fault detection are becoming important differentiators. Artificial intelligence is also entering feeder operations through predictive fault detection and dynamic grid planning. Distribution Feeder Automation System Market suppliers can gain advantage by combining hardware reliability with advanced software capability.
- For instance, Schneider Electric’s Easergy T300 feeder-automation RTU supports real-time load monitoring for up to 24 MV feeders, and its decentralized automation schemes are designed to restore power in less than 60 seconds, showing how communication-ready control platforms can strengthen feeder visibility, automation speed, and renewable integration capability.
Retrofit modernization creates a large opportunity because most distribution networks already have extensive legacy feeder infrastructure. Utilities can improve reliability by adding controllers, reclosers, sensors, and communication modules without replacing the complete network. This strategy supports phased capital spending and helps operators target high-risk feeders first. New deployments also offer opportunities in smart cities, renewable energy zones, and industrial load centers. Distribution Feeder Automation System Market growth will be strongest where utility modernization aligns with resilience, DER integration, and reliability goals.
Regional Insights
North America
North America accounted for 33.40% share of the Distribution Feeder Automation System Market in 2025. The region leads due to strong utility investment in grid modernization, outage management, wildfire prevention, storm resilience, and automated restoration. The U.S. remains the primary demand center, supported by large distribution networks and regulatory focus on reliability. Canada also contributes through smart grid upgrades and infrastructure renewal programs. Regional adoption is concentrated around SCADA integration, reclosers, controllers, fault detection, and advanced feeder switching.
Europe
Europe accounted for 21.10% share of the Distribution Feeder Automation System Market in 2025. The region benefits from renewable energy integration, grid flexibility needs, and strong distribution network modernization programs. Germany, the U.K., France, Italy, and Spain are important markets because utilities are upgrading networks to support electrification and distributed generation. European operators are also focusing on congestion management, voltage control, and digital grid visibility. Automation demand is supported by policy-driven energy transition goals and pressure to improve distribution efficiency.
Asia Pacific
Asia Pacific accounted for 30.25% share of the Distribution Feeder Automation System Market in 2025. The region is expanding rapidly due to rising electricity demand, urbanization, industrial growth, and large-scale investment in power distribution infrastructure. China, India, Japan, South Korea, and Southeast Asian countries are adopting feeder automation to improve reliability and reduce distribution losses. Smart city development and renewable integration are also strengthening demand. Asia Pacific is expected to remain one of the most dynamic regions for automation upgrades and new grid deployments.
Latin America
Latin America accounted for 8.45% share of the Distribution Feeder Automation System Market in 2025. Brazil and Mexico are the main contributors due to urban load growth, utility reliability needs, and distribution infrastructure modernization. The region faces challenges from aging networks, technical losses, and uneven investment capacity across utilities. Feeder automation is gaining relevance where utilities seek faster fault identification, improved service restoration, and better network monitoring. Adoption is expected to rise as power quality and reliability become stronger investment priorities.
Middle East & Africa
Middle East & Africa accounted for 6.80% share of the Distribution Feeder Automation System Market in 2025. The region is supported by power infrastructure expansion, urban development, industrial projects, and utility modernization across select markets. GCC countries are investing in digital grid infrastructure to support high electricity demand and large-scale development projects. South Africa and other African markets are focusing on reliability, outage reduction, and network stability. Feeder automation adoption remains smaller than other regions but is gradually improving through targeted grid upgrades.
Competitive Landscape
The Distribution Feeder Automation System Market is moderately consolidated, with global electrical infrastructure companies competing through automation hardware, software, grid communication, and system integration capabilities. Vendors differentiate through controller intelligence, recloser compatibility, SCADA integration, cybersecurity, interoperability, and lifecycle service support. Competition is also shaped by utilities’ preference for proven field equipment, long operating life, and compatibility with existing control systems. Major companies are expanding portfolios through digital grid platforms, advanced fault detection, voltage management, and retrofit-ready solutions.
Siemens has a strong position in the Distribution Feeder Automation System Market through grid automation, distribution control, feeder monitoring, and flexibility management solutions. The company’s approach centers on software-enabled grid modernization, automation of distribution operations, and improved capacity utilization without full infrastructure replacement. Siemens supports utility operators with tools for feeder visibility, congestion forecasting, flexibility activation, and digital control. This positions the company well as utilities move from conventional feeder monitoring toward autonomous and data-driven distribution networks.
The industry research and growth report includes detailed analyses of the competitive landscape of the market and information about key companies, including:
- Siemens
- Schneider Electric
- ABB
- Eaton
- General Electric
- Hitachi Energy
- S&C Electric
- Schweitzer Engineering Laboratories
- Toshiba Energy Systems
- Hubbell
Qualitative and quantitative analysis of companies has been conducted to help clients understand the wider business environment as well as the strengths and weaknesses of key industry players. Data is qualitatively analyzed to categorize companies as pure play, category-focused, industry-focused, and diversified; it is quantitatively analyzed to categorize companies as dominant, leading, strong, tentative, and weak.
Recent Developments
- In November 2025, Schneider Electric launched the One Digital Grid Platform, a unified AI-enabled software platform built to help utilities modernize grid planning, operations, and asset management while improving resilience and lowering energy costs.
- In June 2025, Hitachi Energy launched its Compact Line Voltage Regulator (C-LVR) at CIRED 2025, introducing a transformer-integrated solution designed to improve voltage control in modern distribution grids.
- In March 2025, ABB completed the acquisition of Siemens’ Wiring Accessories business in China, expanding ABB’s regional reach with a broader product portfolio, a distribution network across 230 cities, and 350 employees.
Report Scope
| Report Attribute | Details |
| Market size value in 2025 | USD 5,120.64 million |
| Revenue forecast in 2032 | USD 8,783.47 million |
| Growth rate (CAGR) | 9.41% (2025–2032) |
| Base year | 2025 |
| Forecast period | 2026-2032 |
| Quantitative units | USD million |
| Segments covered | Component Outlook: Intelligent Switches, Reclosers, Sensors, Controllers, Others; Automation Level Outlook: Manual Automation, Semi-automated, Fully Automated, Others; Communication Technology Outlook: SCADA-based, IEC 61850, Wireless Mesh, Others; Utility Application Outlook: Fault Detection, Load Balancing, Voltage Control, Others; Deployment Model Outlook: Retrofit Installations, New Grid Deployments, Others |
| Regional scope | North America, Europe, Asia Pacific, Latin America, Middle East & Africa |
| Key companies profiled | Siemens, Schneider Electric, ABB, Eaton, General Electric, Hitachi Energy, S&C Electric, Schweitzer Engineering Laboratories, Toshiba Energy Systems, Hubbell |
| No. of Pages | 335 |
Segmentation
By Component
- Intelligent Switches
- Reclosers
- Sensors
- Controllers
- Others
By Automation Level
- Manual Automation
- Semi-automated
- Fully Automated
- Others
By Communication Technology
- SCADA-based
- IEC 61850
- Wireless Mesh
- Others
By Utility Application
- Fault Detection
- Load Balancing
- Voltage Control
- Others
By Deployment Model
- Retrofit Installations
- New Grid Deployments
- Others
By Region
- North America
- U.S.
- Canada
- Mexico
- Europe
- Germany
- France
- U.K.
- Italy
- Spain
- Rest of Europe
- Asia Pacific
- China
- Japan
- India
- South Korea
- South-east Asia
- Rest of Asia Pacific
- Latin America
- Brazil
- Argentina
- Rest of Latin America
- Middle East & Africa
- GCC Countries
- South Africa
- Rest of the Middle East and Africa
Request a Free Sample
Fill in your details and we'll send you a free sample report.
- Sample data tables & charts
- Research methodology
Need a Custom Version of This Report?
Tailor the scope, geography, or segments to your exact requirements.
- Custom geography or segment scope
- Direct access to our analyst team
Frequently Asked Questions
What is the size of the Distribution Feeder Automation System Market?
What is the CAGR of the Distribution Feeder Automation System Market?
Which component segment led the Distribution Feeder Automation System Market in 2025?
What are the major growth factors for the Distribution Feeder Automation System Market?
Who are the leading companies in the Distribution Feeder Automation System Market?
Which region led the Distribution Feeder Automation System Market in 2025?
Table of Content
Chapter 1. Report Introduction
- 1.1 Report Description & Purpose
- 1.1.1 Report Title & Market Definition
- 1.1.2 Unique Selling Propositions (USP) & Key Differentiators
- 1.1.3 Value Proposition for Stakeholders
- 1.2 Research Objectives
- 1.2.1 Market Sizing Objectives (Volume & Revenue)
- 1.2.2 Segmentation Objectives
- 1.2.3 Competitive Intelligence Objectives
- 1.2.4 Forecast & Scenario Objectives
- 1.3 Report Scope
- 1.3.1 Distribution Feeder Automation System Scope – Types & Subtypes Covered
- 1.3.2 Geographic Scope – Regions & Countries Covered
- 1.3.3 Historical Period, Base Year & Forecast Period (2025; forecast to 2032)
- 1.3.4 Inclusions & Exclusions
- 1.4 HS Code & Classification Framework
- 1.5 Currency, Units & Pricing Basis
- 1.6 Target Stakeholders
- 1.7 Limitations & Assumptions
Chapter 2. Executive Summary
- 2.1 Global Distribution Feeder Automation System Market Snapshot
- 2.1.1 Market Size – Historical (2025) & Forecast (2025-2032) (2025: USD 5,120.64 million → 2032: USD 8,783.47 million)
- 2.1.2 Volume & Revenue – Global Totals
- 2.1.3 Key Market Highlights – Top Five Facts
- 2.2 Distribution Feeder Automation System Market Segmentation Snapshot
- 2.2.1 Market Split by Region – 2025 vs. 2032
- 2.3 Competitive Snapshot
- 2.3.1 Top 10 Players by Revenue Share – 2025
- 2.3.2 Top 10 Players by Volume Share – 2025
- 2.3.3 Recent Strategic Developments (18-Month Summary)
- 2.4 Key Investment Highlights & Strategic Conclusions
Chapter 3. Distribution Feeder Automation System Market Dynamics & Industry Analysis
- 3.1 Market Overview & Context
- 3.1.1 Distribution Feeder Automation System Market Position in the Broader Automotive Value Chain
- 3.1.2 OEM vs. Replacement Market Dynamics
- 3.1.3 Market Maturity & Development Stage by Region
- 3.2 Distribution Feeder Automation System Market Drivers
- 3.3 Distribution Feeder Automation System Market Restraints & Challenges
- 3.4 Distribution Feeder Automation System Market Opportunities
- 3.5 Porter's Five Forces Analysis
- 3.5.1 Threat of New Entrants
- 3.5.2 Bargaining Power of Suppliers
- 3.5.3 Bargaining Power of Buyers
- 3.5.4 Threat of Substitutes
- 3.5.5 Competitive Rivalry – Intensity Assessment
- 3.6 Distribution Feeder Automation System Value Chain Analysis
- 3.6.1 Upstream – Raw Material/Input Suppliers
- 3.6.1.1 Raw Material/Input 1
- 3.6.1.2 Raw Material/Input 2
- 3.6.1.3 Raw Material/Input 3
- 3.6.2 Midstream – Production/Manufacturing/Service Delivery
- 3.6.2.1 Production/Process Overview
- 3.6.2.2 Key Facility Locations & Capacity by Manufacturer
- 3.6.3 Downstream – Distribution & End Consumer
- 3.6.3.1 Primary Channel – B2B/OEM
- 3.6.3.2 Secondary Channels – Dealer, Retail, Online, Direct
- 3.6.4 Value Chain Profitability Analysis
- 3.6.1 Upstream – Raw Material/Input Suppliers
- 3.7 PESTEL Analysis
- 3.7.1 Political Factors
- 3.7.2 Economic Factors
- 3.7.3 Social Factors
- 3.7.4 Technological Factors
- 3.7.5 Environmental Factors
- 3.7.6 Legal Factors
- 3.8 Distribution Feeder Automation System Supply Chain Analysis
- 3.8.1 Raw Material/Input Supply Risk Assessment
- 3.8.2 Manufacturing Concentration Risk (Geographic Exposure)
- 3.8.3 Trade Disruption Impact Analysis
- 3.9 Regulatory & Policy Landscape
Note: The regulatory and policy landscape section covers regulations based on their applicability to the market, Distribution Feeder Automation System category, geography, and scope of the study. Only regulatory frameworks with a material impact on operations, compliance, trade, sustainability, or market access are analyzed in detail.
Chapter 4. Key Investment Pockets & Opportunity Analysis
- 4.1 Distribution Feeder Automation System Market Attractiveness Analysis
- 4.1.1 By Region – Investment Attractiveness Matrix (Volume × CAGR)
- 4.2 Absolute Revenue Growth Opportunity
- 4.2.1 By Region – Absolute USD Growth Through 2032
- 4.3 Incremental Volume Opportunity
- 4.3.1 By Region – Incremental Volume Through 2032
- 4.3.2 Segment – Incremental Volume
- 4.4 Emerging Submarket Opportunity Deep Dive (Subject to Applicability)
- 4.5 Emerging Market Opportunity Scorecards
- 4.5.1 United States
- 4.5.2 Europe
- 4.5.3 Asia
- 4.5.4 Middle East & Africa
Note: Emerging Market Opportunity Scorecards will be included based on relevance and strategic importance. Regions listed are indicative and may vary depending on data availability and market dynamics.
Chapter 5. Distribution Feeder Automation System Import-Export Analysis & Trade Flows
- 5.1 Global Trade Overview
- 5.1.1 Global Export Value by Country (2025)
- 5.1.2 Global Export Volume by Country (2025)
- 5.1.3 Global Import Value by Country (2025)
- 5.1.4 Global Import Volume by Country (2025)
- 5.1.5 Net Trade Balance by Country (2025)
- 5.2 Export Analysis – Segment
- 5.2.1 Type 1 (HS Code)
- 5.2.2 Type 2 (HS Code)
- 5.2.3 Type 3 (HS Code)
- 5.2.4 Type 4 (HS Code)
- 5.2.5 Type 5 (HS Code)
- 5.3 Import Analysis – Segment
- 5.3.1 Type 1 (HS Code)
- 5.3.2 Type 2 (HS Code)
- 5.3.3 Type 3 (HS Code)
- 5.3.4 Type 4 (HS Code)
- 5.3.5 Type 5 (HS Code)
- 5.4 Average Unit Trade Prices
- 5.4.1 Average Export Price – Segment & Country
- 5.4.2 Average Import Price – Segment & Source Country
- 5.4.3 Price Trends (2025)
- 5.5 Key Trade Route Analysis
- 5.5.1 Trade Route 1
- 5.5.2 Trade Route 2
- 5.5.3 Trade Route 3
- 5.5.4 Trade Route 4
- 5.5.5 Trade Route 5
- 5.6 Trade Policy Impact Assessment
- 5.6.1 US Anti-Dumping & Section 301 Tariffs
- 5.6.2 EU Customs Union Impact
- 5.6.3 Major Free Trade Agreements
- 5.6.4 USMCA Rules of Origin
Note: Trade policy analysis will be included only where relevant to the Distribution Feeder Automation System market.
Chapter 6. Competitive Landscape & Company Benchmarking
- 6.1 Distribution Feeder Automation System Market Concentration & Structure
- 6.1.1 Herfindahl-Hirschman Index (HHI) – vs. 2025
- 6.1.2 Tier 1, Tier 2 & Tier 3 Market Structure
- 6.1.3 Global, Regional & Local Player Dynamics
- 6.2 Distribution Feeder Automation System Market Share Analysis – 2025
- 6.2.1 Global Revenue Share by Company
- 6.2.2 Global Volume Share by Company
- 6.2.3 Regional Revenue Share
- 6.2.4 Market Share Evolution ( vs. 2025)
- 6.2.5 OEM Segment Share by Company
- 6.2.6 Replacement Segment Share by Company
- 6.3 Production/Delivery Capacity & Facility Analysis
- 6.3.1 Global Installed Capacity
- 6.3.2 Capacity Utilization Rates
- 6.3.3 Production/Output Volume
- 6.3.4 Facility Locations & Capacity Map
- 6.3.5 Planned Capacity Additions
- 6.4 Distribution Feeder Automation System Competitive Benchmarking Matrix
- 6.4.1 Revenue, Volume, CAGR & Profitability Comparison
- 6.4.2 Channel Revenue Mix
- 6.4.3 Geographic Revenue Exposure
- 6.4.4 R&D Intensity
- 6.4.5 Sustainability Maturity
- 6.5 Strategic Developments in Distribution Feeder Automation System (Last 24 Months)
- 6.5.1 Mergers, Acquisitions & Divestments
- 6.5.2 New Distribution Feeder Automation System Launches
- 6.5.3 Facility Expansions
- 6.5.4 Strategic Alliances, Joint Ventures & Partnerships
- 6.5.5 Distribution Expansion & Market Entry
- 6.5.6 Sustainability & ESG Initiatives
- 6.6 Competitive Strategy Mapping
- 6.6.1 Leader, Challenger, Follower & Niche Classification
- 6.6.2 Pricing Strategy Comparison
- 6.6.3 Channel Strategy Matrix
Note: Strategic developments are included based on their materiality and the availability of reliable information.
Chapter 7. Global Distribution Feeder Automation System Market – By Distribution Channel
- 7.1 Segment Overview
- 7.1.1 Volume & Revenue Split by Channel (2025 & 2032)
- 7.1.2 Channel Mix Evolution (2025-2032)
Chapter 8. Regional Market Analysis – Global Overview
- 8.1 Global Regional Overview
- 8.1.1 Regional Volume Share
- 8.1.2 Regional Revenue Share
- 8.1.3 Regional Volume by Region
- 8.1.4 Regional Revenue by Region
- 8.1.5 Regional Forecast Through 2032
- 8.2 Cross-Regional Segment Analysis
- 8.2.1 By Distribution Channel
- 8.2.2 By Brand/Price Tier
Chapter 9. North America Distribution Feeder Automation System Market
- 9.1 United States
- 9.2 Canada
- 9.3 Mexico
Chapter 10. Europe Distribution Feeder Automation System Market
- 10.1 Germany
- 10.2 France
- 10.3 Italy
- 10.4 United Kingdom
- 10.5 Spain
- 10.6 Poland
- 10.7 Russia
- 10.8 Netherlands
- 10.9 Belgium
- 10.10 Sweden
- 10.11 Denmark
- 10.12 Norway
- 10.13 Rest of Europe
Chapter 11. Asia Pacific Distribution Feeder Automation System Market
- 11.1 China
- 11.2 India
- 11.3 Japan
- 11.4 South Korea
- 11.5 Thailand
- 11.6 Indonesia
- 11.7 Vietnam
- 11.8 Malaysia
- 11.9 Australia
- 11.10 Rest of Asia Pacific
Chapter 12. Latin America Distribution Feeder Automation System Market
- 12.1 Brazil
- 12.2 Argentina
- 12.3 Colombia
- 12.4 Chile
- 12.5 Rest of Latin America
Chapter 13. Middle East Distribution Feeder Automation System Market
- 13.1 Saudi Arabia
- 13.2 United Arab Emirates
- 13.3 Turkey
- 13.4 Israel
- 13.5 Iran
- 13.6 Rest of the Middle East
Chapter 14. Africa Distribution Feeder Automation System Market
- 14.1 South Africa
- 14.2 Egypt
- 14.3 Nigeria
- 14.4 Morocco
- 14.5 Rest of Africa
Chapter 15. Distribution Feeder Automation System Company Profiles
- 15.1 [Company 01]
- 15.1.1 Company Overview
- 15.1.2 Key Management Personnel
- 15.1.3 Products & Services Portfolio
- 15.1.4 Financial Performance
- 15.1.5 Key Market Focus & Geographic Presence
- 15.1.6 Recent Developments & Strategic Initiatives
Note: The company profile list is preliminary and may change based on research findings, market developments, data availability, and client requirements.
Chapter 16. Appendices
- Appendix A – List of Abbreviations & Acronyms
- Appendix B – Industry Classification Code Reference – Full Series
- Appendix C – Production & Capacity Data Tables
- Appendix D – End-Use & Demand Base Tables
- Appendix E – Consumption & Replacement Rate Assumptions
- Appendix F – ASP Reference Tables
- Appendix G – Manufacturing & Facility Database
- Appendix H – Import-Export Data Tables
- Appendix I – Regulatory Summary Tables
- Appendix J – Primary Research Participant List (Anonymized)
- Appendix K – Primary Research Questionnaire Framework
- Appendix L – Data Sources & Bibliography
- Appendix M – Market Size Divergence & Source Comparison
Chapter 17. Research Methodology
- 17.1 Research Framework & Philosophy
- 17.2 Secondary Research – Sources, Hierarchy & Data Extraction
- 17.3 Data Modeling – Bottom-Up & Top-Down Market Sizing
- 17.4 Primary Research – Stakeholder Framework, LOI & Sample Sizes
- 17.5 Forecast Methodology – Regression, Scenario & Sensitivity Analysis
- 17.6 Quality Control – Four-Layer Validation Framework
- 17.7 Limitations & Standard Assumptions
- 17.8 Disclaimer
