
Market Overview
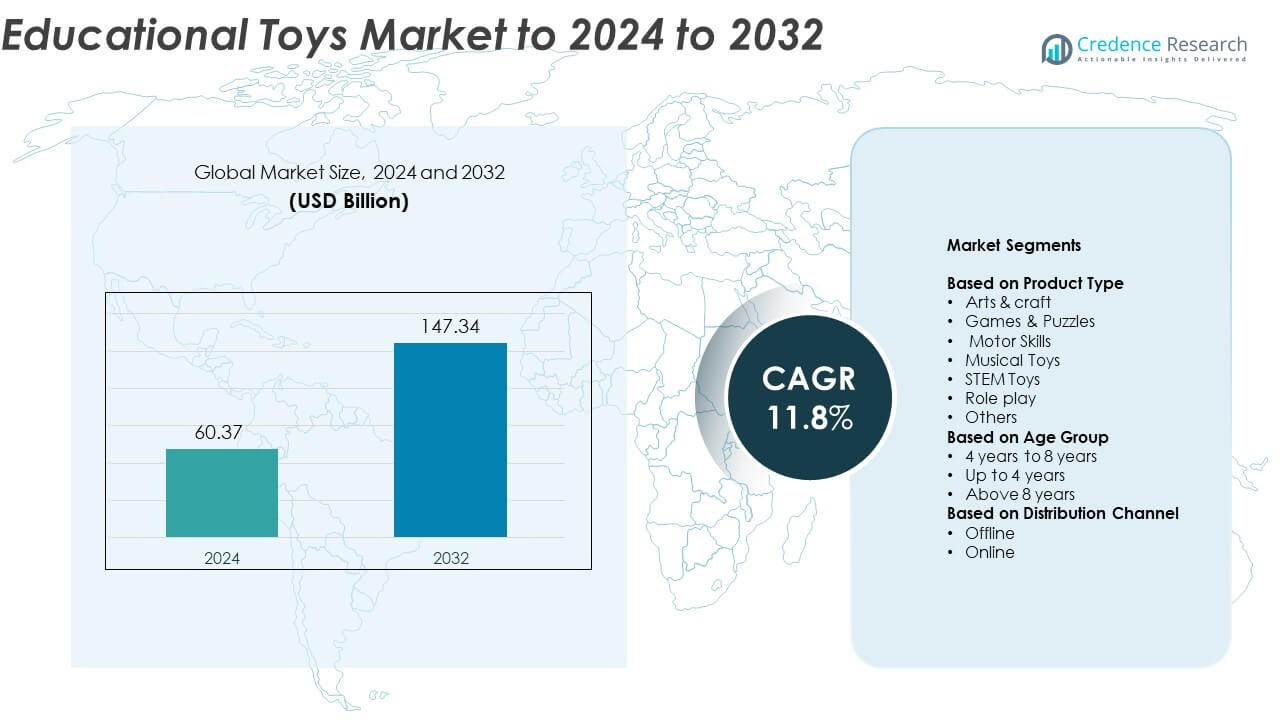
Educational Toys Market size was valued at USD 60.37 Billion in 2024 and is anticipated to reach USD 147.34 Billion by 2032, at a CAGR of 11.8% during the forecast period.
| REPORT ATTRIBUTE | DETAILS |
|---|---|
| Historical Period | 2020-2023 |
| Base Year | 2024 |
| Forecast Period | 2025-2032 |
| Educational Toys Market Size 2024 | USD 60.37 Billion |
| Educational Toys Market, CAGR | 11.8% |
| Educational Toys Market Size 2032 | USD 147.34 Billion |
The educational toys market is led by major players including LEGO Group, Mattel, Inc., Hasbro, Inc., VTech Holdings Limited, Spin Master Corp., Fisher-Price, Inc., and Bandai Namco Holdings Inc. These companies dominate through product innovation, brand strength, and extensive retail networks across global markets. North America remains the leading region with around 37.8% share in 2024, driven by strong consumer spending and early learning awareness. Europe follows with 29.6% share due to sustainable product innovation and strong educational standards, while Asia Pacific holds 23.4% share, emerging as the fastest-growing region supported by rising disposable incomes and increasing focus on early childhood education.
Market Insights
- The Educational Toys Market was valued at USD 60.37 Billion in 2024 and is projected to reach USD 147.34 Billion by 2032, growing at a CAGR of 11.8%.
- Growth is driven by rising awareness of early childhood education, expanding STEM learning programs, and increased parental spending on cognitive skill development.
- Trends such as AI-based smart toys, eco-friendly materials, and integration of AR and VR are reshaping product innovation and engagement.
- The competitive landscape is defined by continuous innovation, sustainability initiatives, and collaborations between manufacturers and educational institutions.
- North America leads with 37.8% share, followed by Europe at 29.6% and Asia Pacific at 23.4%, while STEM toys dominate by product type, accounting for 34.6% of global market share in 2024.
Market Segmentation Analysis:
By Product Type
STEM toys dominate the educational toys market, accounting for around 34.6% share in 2024. Their leadership stems from rising demand for science, technology, engineering, and math-based learning solutions that promote problem-solving and logical reasoning. Increasing integration of robotics and coding kits in early education enhances engagement and skill development among children. Growing parental focus on interactive learning tools and school adoption of STEM-focused programs further fuel this segment’s growth. Meanwhile, games and puzzles continue to gain traction due to their benefits in improving memory and cognitive skills.
- For instance, the LEGO Education SPIKE Prime system, which includes the core set with 528 elements and a programmable hub, is widely implemented in educational institutions globally for hands-on STEM learning.
By Age Group
The 4 years to 8 years category leads the market with nearly 46.2% share in 2024. This age group represents the most active phase of learning and creativity, driving high demand for structured play-based education. Manufacturers are developing toys that blend fun and skill enhancement, such as building sets and interactive kits. Educational institutions increasingly use age-appropriate learning tools to support classroom activities. Rising awareness among parents about developmental learning during early school years also supports segment expansion across both developed and emerging economies.
- For instance, Osmo products are used in more than 50,000 classrooms and over 2.5 million homes worldwide, according to official company statements and press releases
By Distribution Channel
Offline distribution channels hold the largest share of about 58.3% in 2024, driven by the strong presence of specialty toy stores, supermarkets, and educational supply outlets. Consumers prefer offline stores for product testing and immediate availability. Retailers are expanding experiential sections to allow children to interact with toys before purchase, improving customer engagement. However, online sales are growing rapidly due to rising e-commerce penetration and digital marketing. The convenience of doorstep delivery and access to global toy brands through online platforms continue to reshape the distribution landscape.
Key Growth Drivers
Rising Focus on Early Childhood Learning
Parents and educators increasingly emphasize structured learning through play, fueling demand for educational toys. Toys designed to promote cognitive, motor, and problem-solving skills are being integrated into preschool curriculums. Governments worldwide are supporting early learning initiatives, enhancing market penetration in developing regions. The growing awareness of play-based education among parents also drives investment in high-quality learning toys, strengthening overall market expansion.
- For instance, the LEGO Group's flagship social impact program, "Build the Change," engaged over 2 million children globally in 2023.
Growing Popularity of STEM-Based Toys
STEM toys are becoming a core part of modern education systems. Schools and parents are adopting them to develop analytical and creative skills in children. The inclusion of robotics, coding, and engineering kits in curricula encourages active learning and critical thinking. The trend aligns with global digital education programs, leading manufacturers to expand product portfolios with tech-enhanced learning sets that merge fun with educational value.
- For instance, at the time of their acquisition in August 2019, the combined reach of Sphero and littleBits was reported to be over 6 million students through 65,000 teachers across 35,000 schools globally.
Technological Advancements in Smart Toys
The integration of AI, sensors, and connected technologies in educational toys is reshaping the learning experience. Smart toys provide personalized learning paths and real-time feedback, improving engagement and retention among children. Voice-enabled and app-connected toys allow interactive teaching, bridging entertainment and education. Manufacturers are leveraging augmented and virtual reality to create immersive experiences, boosting adoption among tech-savvy parents and schools.
Key Trends & Opportunities
Sustainability and Eco-Friendly Materials
Growing environmental awareness is pushing manufacturers toward sustainable production. Wooden, biodegradable, and recycled materials are gaining traction as alternatives to plastic-based toys. Consumers increasingly prefer non-toxic and eco-certified educational products. Companies focusing on green manufacturing and ethical sourcing are capturing attention from environmentally conscious parents, creating long-term brand loyalty and market differentiation opportunities.
- For instance, PlanToys installed 1,851 solar panels, cutting about 400 tCO₂e annually.
Expansion of E-Commerce Platforms
Online retailing is revolutionizing access to educational toys, especially in emerging markets. E-commerce platforms provide a broad selection, competitive pricing, and convenience for parents. Toy makers are partnering with digital marketplaces to improve visibility and reach. Social media and influencer marketing campaigns are also driving awareness among young parents, boosting sales through personalized digital engagement strategies.
- For instance, FirstCry lists a vast range of products including 8,019 brands as of FY25. The company's e-commerce site served 8.7 million active transacting customers in FY2024.
Growing Adoption in Institutional Learning
Schools and daycare centers are incorporating educational toys into structured learning programs. These tools enhance concentration, creativity, and teamwork skills among students. The rise of experiential and activity-based education has created a steady institutional demand. Manufacturers are collaborating with educators to design curriculum-compatible products that align with cognitive development goals, opening new growth avenues.
Key Challenges
High Product Costs and Affordability Gap
Premium educational toys equipped with technology and advanced features often come at high prices. This limits accessibility for middle- and low-income families, especially in developing nations. The affordability gap restricts market expansion despite growing awareness. Manufacturers face challenges balancing innovation with cost-effectiveness to reach wider consumer groups without compromising quality.
Stringent Safety Regulations and Compliance
Educational toy manufacturers must adhere to strict international safety and quality standards. Compliance with regulations related to materials, design, and labeling increases production costs. Frequent product recalls due to safety issues can damage brand reputation. Managing compliance across multiple countries with varying standards poses logistical challenges, slowing product launches and market entry.
Regional Analysis
North America
North America leads the educational toys market with around 37.8% share in 2024. The region’s dominance is supported by high consumer spending on early childhood development and strong adoption of STEM-based learning products. The United States remains the largest market, driven by extensive integration of educational play in preschools and home learning programs. Major brands actively launch tech-integrated toys catering to digital learning trends. Parental focus on cognitive development and sustainability also boosts demand for eco-friendly, interactive toys. Canada shows steady growth through government-backed early education initiatives and online retail expansion.
Europe
Europe accounts for about 29.6% share of the global educational toys market in 2024. The region benefits from strong educational infrastructure and widespread emphasis on experiential learning. Germany, the U.K., and France are key markets with increasing demand for eco-friendly and Montessori-inspired toys. Rising adoption of STEM kits and coding games in schools supports regional expansion. Stringent safety regulations ensure product quality and foster consumer trust. Local manufacturers emphasize sustainable materials and innovation, while e-commerce platforms enhance accessibility across Eastern and Western Europe.
Asia Pacific
Asia Pacific holds nearly 23.4% share in 2024 and is the fastest-growing regional market. Expansion is driven by growing middle-class populations, rising disposable income, and increased focus on early education. China, Japan, and India represent key growth hubs due to higher awareness of skill-based learning. Government initiatives promoting STEM education and online learning platforms further drive sales. Local and international brands are expanding retail presence across urban centers. The surge in e-commerce and mobile app-based learning tools also contributes significantly to regional growth.
Latin America
Latin America captures around 5.7% share of the educational toys market in 2024. The region’s growth is supported by rising awareness of cognitive development and increased investment in educational resources. Brazil and Mexico are the primary markets, with expanding retail networks and online platforms driving accessibility. Consumers are increasingly adopting affordable and durable learning toys. Local brands are introducing culturally relevant educational themes, while international players are strengthening distribution partnerships. Economic recovery and gradual improvement in disposable income levels continue to support steady market progress.
Middle East & Africa
The Middle East and Africa region holds about 3.5% share in 2024, showing emerging potential in early learning products. Growth is primarily driven by increasing investments in education and expanding urban populations. Countries like the UAE and South Africa are witnessing higher adoption of STEM and digital learning toys. The region benefits from a growing retail presence and entry of global toy brands. Although price sensitivity remains a challenge, rising awareness of educational value and government initiatives promoting early childhood education enhance market prospects.
Market Segmentations:
By Product Type
- Arts & craft
- Games & Puzzles
- Motor Skills
- Musical Toys
- STEM Toys
- Role play
- Others
By Age Group
- 4 years to 8 years
- Up to 4 years
- Above 8 years
By Distribution Channel
- Offline
- Online
By Geography
- North America
- U.S.
- Canada
- Mexico
- Europe
- Germany
- France
- U.K.
- Italy
- Spain
- Rest of Europe
- Asia Pacific
- China
- Japan
- India
- South Korea
- South-east Asia
- Rest of Asia Pacific
- Latin America
- Brazil
- Argentina
- Rest of Latin America
- Middle East & Africa
- GCC Countries
- South Africa
- Rest of the Middle East and Africa
Competitive Landscape
The educational toys market features major players such as LEGO Group, Mattel, Inc., Hasbro, Inc., VTech Holdings Limited, Spin Master Corp., Fisher-Price, Inc., Bandai Namco Holdings Inc., LeapFrog Enterprises, Inc., Ravensburger AG, Hape International AG, Melissa & Doug, LLC, Clementoni S.p.A., WowWee Group Limited, Gigo Toys, and K’NEX Brands. The competition is shaped by continuous innovation in product design, smart technology integration, and the growing focus on STEM learning. Companies are investing in digital transformation, incorporating robotics, coding, and AI-based features to enhance interactive play. Sustainability has emerged as a key differentiator, with brands shifting toward eco-friendly materials and ethical sourcing. Strategic collaborations with educational institutions and partnerships with e-commerce platforms are expanding consumer reach. Firms also focus on localization, developing culturally relevant products to appeal to regional markets. The emphasis on brand trust, product safety, and experiential learning continues to define competitive positioning across global markets.
Key Player Analysis
- LEGO Group
- Mattel, Inc.
- Hasbro, Inc.
- VTech Holdings Limited
- Spin Master Corp.
- Fisher-Price, Inc.
- Bandai Namco Holdings Inc.
- LeapFrog Enterprises, Inc.
- Ravensburger AG
- Hape International AG
- Melissa & Doug, LLC
- Clementoni S.p.A.
- WowWee Group Limited
- Gigo Toys
- K’NEX Brands
Recent Developments
- In 2025, LEGO India joined hands with the CDAC Noida supported by the Creative Play Lab (CPL) of the LEGO Group, to provide mentorship to Indian engineering students on toy prototypes, as part of a collaboration with India's Ministry of Electronics and Information Technology (MeitY) to strengthen the indigenous electronic toy industry.
- In 2025, Mattel announced a strategic partnership with OpenAI to integrate AI technology into its toys and games.
- In 2025, LeapFrog showcased new learning toys at Toy Fair 2025, including Preschool Game & Go and other early-learning lines.
Report Coverage
The research report offers an in-depth analysis based on Product Type, Age Group, Distribution Channel and Geography. It details leading market players, providing an overview of their business, product offerings, investments, revenue streams, and key applications. Additionally, the report includes insights into the competitive environment, SWOT analysis, current market trends, as well as the primary drivers and constraints. Furthermore, it discusses various factors that have driven market expansion in recent years. The report also explores market dynamics, regulatory scenarios, and technological advancements that are shaping the industry. It assesses the impact of external factors and global economic changes on market growth. Lastly, it provides strategic recommendations for new entrants and established companies to navigate the complexities of the market.
Future Outlook
- The market will witness continued expansion driven by increasing parental investment in educational learning tools.
- Digital transformation will boost demand for smart and AI-enabled educational toys.
- Integration of augmented and virtual reality will enhance immersive learning experiences.
- Sustainable materials will gain importance as consumers prefer eco-friendly toy options.
- Manufacturers will focus on customizable toys that adapt to different learning styles.
- Collaboration between toy makers and educational institutions will strengthen structured learning adoption.
- Asia Pacific will emerge as a leading growth region with expanding middle-class consumers.
- Online retail will become the dominant distribution channel for educational toy sales.
- Innovations in STEM-based toys will continue to drive market competitiveness.
- Companies will prioritize safety compliance and product certifications to maintain consumer trust.

Request a Free Sample
Fill in your details and we'll send you a free sample report.
- Sample data tables & charts
- Research methodology
Need a Custom Version of This Report?
Tailor the scope, geography, or segments to your exact requirements.
- Custom geography or segment scope
- Direct access to our analyst team
Frequently Asked Questions
What is the current market size for Educational Toys Market, and what is its projected size in 2032?
At what Compound Annual Growth Rate is the Educational Toys Market projected to grow between 2025 and 2032?
Which Educational Toys Market segment held the largest share in 2024?
What are the primary factors fueling the growth of the Educational Toys Market?
Who are the leading companies in the Educational Toys Market?
Which region commanded the largest share of the Educational Toys Market in 2024?
Table of Content
Chapter 1 Market Segmentation
- 1.1 Segmentation Framework
- 1.1.1 Product and Service Classification
- 1.1.2 Application and End-Use Classification
- 1.1.3 Technology and Solution Classification
- 1.1.4 Customer and Distribution Channel Classification
- 1.1.5 Geographic Segmentation
- 1.1.6 Market Segment Definitions and Boundaries
Chapter 2 Introduction
- 2.1 Report Objectives and Scope
- 2.2 Product Definition and Industry Terminology
- 2.3 Market Inclusions and Exclusions
- 2.4 Research Process
- 2.4.1 Primary Research and Expert Interviews
- 2.4.2 Secondary Research and Source Review
- 2.4.3 Top-Down and Bottom-Up Estimation
- 2.4.4 Data Triangulation and Verification
- 2.5 Market Size Measurement Basis
- 2.5.1 2024: USD 60.37 Billion → 2032: USD 147.34 Billion
- 2.6 Historical and Forecast Reference Periods
- 2.6.1 Base Year: 2024
- 2.6.2 Forecast Period: 2024-2032
- 2.7 Research Assumptions and Limitations
Chapter 3 Executive Summary
- 3.1 Market Snapshot and Key Findings
- 3.2 Base-Year Market Size, 2024
- 3.3 Forecast Market Size, 2032
- 3.4 Revenue and Volume Growth Outlook
- 3.5 Key Demand and Supply Indicators
- 3.6 Leading Market Segments
- 3.7 Fastest-Growing Market Opportunities
- 3.8 Regional Performance Highlights
- 3.9 Technology and Industry Transformation
- 3.10 Competitive Landscape Summary
- 3.11 Analyst View and Strategic Implications
Chapter 4 Global Educational Toys Market Trends and Developments
- 4.1 Historical Industry Development
- 4.2 Recent Market Trends and Developments
- 4.3 Demand and Customer Behavior Trends
- 4.4 Technology and Product Innovation
- 4.5 Artificial Intelligence, Automation and Digitalization
- 4.6 Local Manufacturing and Supply Chain Realignment
- 4.7 Industry Partnerships, Mergers and Acquisitions
- 4.8 Sustainability and Circular Economy Developments
- 4.9 Government and Private Sector Investment Trends
- 4.10 Emerging Business Models and Commercialization
- 4.11 Industry Developments and Announcements
Chapter 5 Global Educational Toys Market Production, Supply and Demand Analysis
- 5.1 Demand Trend and Consumption Analysis
- 5.2 Demand Forecast, 2024-2032
- 5.3 Production and Output Trend
- 5.4 Production and Output Forecast, 2024-2032
- 5.5 Installed Capacity and Capacity Utilization
- 5.6 Company-Wise Production Plants and Statistics
- 5.6.1 Installed Production Capacity
- 5.6.2 Actual Production
- 5.6.3 Planned Capacity and Expansion Targets
- 5.7 Supply Chain Structure and Procurement Trends
- 5.8 Supply-Demand Gap and Bottlenecks
- 5.9 Import Dependence and Sourcing Structure
- 5.10 Contract Manufacturing and Outsourcing
- 5.11 Regional Supply and Demand Concentration
Chapter 6 Global Educational Toys Market Pricing Analysis
- 6.1 Pricing Structure and Measurement
- 6.2 Historical Pricing Trends
- 6.3 Pricing Outlook, 2024-2032
- 6.4 Average Selling Price and Unit Economics
- 6.5 Pricing by Product and Market Segment
- 6.6 Geographic Pricing Differences
- 6.7 Key Input, Energy, Labor and Logistics Costs
- 6.8 Contract Pricing and Purchasing Models
- 6.9 Pricing Sensitivity and Competitive Positioning
- 6.10 Price, Margin and Profitability Implications
Chapter 7 Global Educational Toys Market Dynamics
- 7.1 Market Growth Drivers
- 7.1.1 Demand-Side Drivers
- 7.1.2 Technology and Innovation Drivers
- 7.1.3 Infrastructure and Investment Drivers
- 7.1.4 Regulatory and Policy Drivers
- 7.2 Market Restraints
- 7.2.1 Cost and Affordability Constraints
- 7.2.2 Technology and Adoption Barriers
- 7.2.3 Supply Chain and Operational Constraints
- 7.3 Market Challenges
- 7.3.1 Competitive Pressure and Margin Erosion
- 7.3.2 Skills, Infrastructure and Implementation Gaps
- 7.4 Emerging Market Opportunities
- 7.5 Market Dynamics Impact and Time-Horizon Assessment
Chapter 8 Global Educational Toys Value Chain Analysis
- 8.1 Industry Value Chain Overview
- 8.2 Upstream Suppliers and Critical Inputs
- 8.3 Technology and Component Providers
- 8.4 Manufacturing or Service Delivery
- 8.5 Distribution, Channel Partners and Integrators
- 8.6 Downstream Applications and End Users
- 8.7 Value Addition and Profit Pools
- 8.8 Vertical Integration and Outsourcing
- 8.9 Supplier Concentration and Risk
- 8.10 Supply Chain Localization and Resilience
Chapter 9 Global Educational Toys Market Regulations and Policies
- 9.1 Relevant Laws, Standards and Compliance Frameworks
- 9.2 Product, Service, Safety and Quality Requirements
- 9.3 Government Policies, Incentives and Subsidies
- 9.4 Imports, Exports and Trade Barriers
- 9.5 Public Procurement and Local Content Requirements
- 9.6 Environmental and Sustainability Compliance
- 9.7 Upcoming Policy Changes and Market Implications
Chapter 10 Global Educational Toys Market Hotspots and Opportunities
- 10.1 Market Opportunity Mapping and Growth Hotspots
- 10.2 High-Growth Applications and Customer Groups
- 10.3 Underserved Markets and White-Space Opportunities
- 10.4 Emerging Technology and Product Opportunities
- 10.5 New Capacity and Investment Hotspots
- 10.6 Market Entry and Expansion Opportunities
- 10.7 Distribution and Partnership Opportunities
- 10.8 Near-Term and Long-Term Commercial Potential
- 10.9 Opportunity Attractiveness and Execution Risks
Chapter 11 Global Educational Toys Market Outlook, 2024-2032
- 11.1 Market Size and Analysis
- 11.1.1 Revenue (Market Measurement: 2024: USD 60.37 Billion → 2032: USD 147.34 Billion)
- 11.1.2 Market Volume and Quantity Sold
- 11.1.3 Historical Market Size
- 11.1.4 Base-Year Market Size, 2024
- 11.2 Market Forecast, 2024-2032
- 11.2.1 Revenue Forecast to 2032
- 11.2.2 Volume Forecast to 2032
- 11.2.3 CAGR and Year-on-Year Growth
- 11.2.4 Incremental Revenue Opportunity
- 11.3 Forecast Assumptions and Scenario Analysis
- 11.3.1 Base-Case Forecast
- 11.3.2 Optimistic and Conservative Scenarios
- 11.3.3 Technology, Pricing and Policy Sensitivities
- 11.4 Market Attractiveness and Growth Outlook
Chapter 12 Global Educational Toys Market Segmentation and Outlook
- 12.1 Segmentation Summary and Market Shares, 2024
- 12.2 Largest and Fastest-Growing Segments
- 12.3 Segment Growth Comparison
- 12.4 Segment Attractiveness and Priority Matrix
Chapter 13 Global Educational Toys Geographic Market Outlook, 2024-2032
- 13.1 Regional Market Size and Share, 2024
- 13.2 Regional Market Forecast, 2024-2032
- 13.3 Regional Pricing, Production and Demand Differences
- 13.4 North America
- 13.4.1 United States
- 13.4.2 Canada
- 13.4.3 Mexico
- 13.5 Europe
- 13.5.1 Germany
- 13.5.2 France
- 13.5.3 Italy
- 13.5.4 United Kingdom
- 13.5.5 Spain
- 13.5.6 Poland
- 13.5.7 Russia
- 13.5.8 Netherlands
- 13.5.9 Belgium
- 13.5.10 Sweden
- 13.5.11 Denmark
- 13.5.12 Norway
- 13.5.13 Rest of Europe
- 13.6 Asia Pacific
- 13.6.1 China
- 13.6.2 India
- 13.6.3 Japan
- 13.6.4 South Korea
- 13.6.5 Thailand
- 13.6.6 Indonesia
- 13.6.7 Vietnam
- 13.6.8 Malaysia
- 13.6.9 Australia
- 13.6.10 Rest of Asia Pacific
- 13.7 Latin America
- 13.7.1 Brazil
- 13.7.2 Argentina
- 13.7.3 Colombia
- 13.7.4 Chile
- 13.7.5 Rest of Latin America
- 13.8 Middle East
- 13.8.1 Saudi Arabia
- 13.8.2 United Arab Emirates
- 13.8.3 Turkey
- 13.8.4 Israel
- 13.8.5 Iran
- 13.8.6 Rest of the Middle East
- 13.9 Africa
- 13.9.1 South Africa
- 13.9.2 Egypt
- 13.9.3 Nigeria
- 13.9.4 Morocco
- 13.9.5 Rest of Africa
- 13.10 Regional Investment, Policy and Supply Chain Differences
- 13.11 Regional Competitive Landscape
- 13.12 Geographic Growth Hotspots
Chapter 14 Global Educational Toys Technology, Innovation and Sustainability Outlook
- 14.1 Technology Landscape and Maturity
- 14.2 Product, Process and Service Innovation
- 14.3 AI, Automation and Digital Tools in the Industry
- 14.4 Technology Adoption and Performance Benchmarking
- 14.5 Innovation Pipeline and R&D Investment
- 14.6 Patent and Intellectual Property Trends
- 14.7 Energy Efficiency and Resource Management
- 14.8 Sustainability, Recycling and Circularity
- 14.9 Technology Roadmap, 2024-2032
- 14.10 Risks of Obsolescence and Technology Substitution
Chapter 15 Global Educational Toys Market Key Strategic Imperatives
- 15.1 Growth and Market Entry Priorities
- 15.2 High-Return Products and Segments
- 15.3 Pricing, Profitability and Cost Optimization
- 15.4 Technology Investment and Product Differentiation
- 15.5 Supply Chain Localization and Resilience
- 15.6 Distribution and Customer Acquisition
- 15.7 Partnership, Acquisition and Capacity Strategy
- 15.8 Regional Expansion Priorities
- 15.9 Short-, Medium- and Long-Term Actions
Chapter 16 Competition Outlook
- 16.1 Industry Competition Characteristics
- 16.2 Market Structure and Concentration
- 16.3 Market Share and Competitive Positioning, 2024
- 16.4 Company-Wise Revenue and Product Benchmarking
- 16.5 Production and Service Capacity Benchmarking
- 16.6 Technology, Pricing and Differentiation
- 16.7 Regional Footprint and Distribution Strength
- 16.8 Mergers, Acquisitions and Strategic Alliances
- 16.9 New Entrants and Competitive Threats
- 16.10 Porter's Five Forces and Industry Attractiveness
- 16.11 Competitive Outlook, 2024-2032
Chapter 17 Company Profiles
- 17.1 Company Coverage and Selection Criteria
- 17.2 Leading Market Participants – Standard Profile Structure
- 17.2.1 Business Description
- 17.2.2 Company Ownership and Geographic Presence
- 17.2.3 Product and Service Portfolio
- 17.2.4 Manufacturing and Operating Footprint
- 17.2.5 Production Capacity and Expansion Plans
- 17.2.6 Financial Performance and Investment
- 17.2.7 Market Share and Competitive Position
- 17.2.8 Technology and Innovation Capabilities
- 17.2.9 Strategic Alliances or Partnerships
- 17.2.10 Recent Developments
- 17.2.11 Growth Strategy and Outlook
- 17.3 Other Relevant Market Participants
Note: Every listed company is profiled on the structure shown under the first company. The company list is preliminary and may change based on research findings, market developments, data availability and client requirements.
Chapter 18 Disclaimer
- 18.1 Research and Forecast Disclaimer
- 18.2 Data Source and Estimation Limitations
Note: The depth of individual sections depends on data availability for this market. Volume, capacity, trade and other unit-based metrics are included where applicable.

