
Market Overview
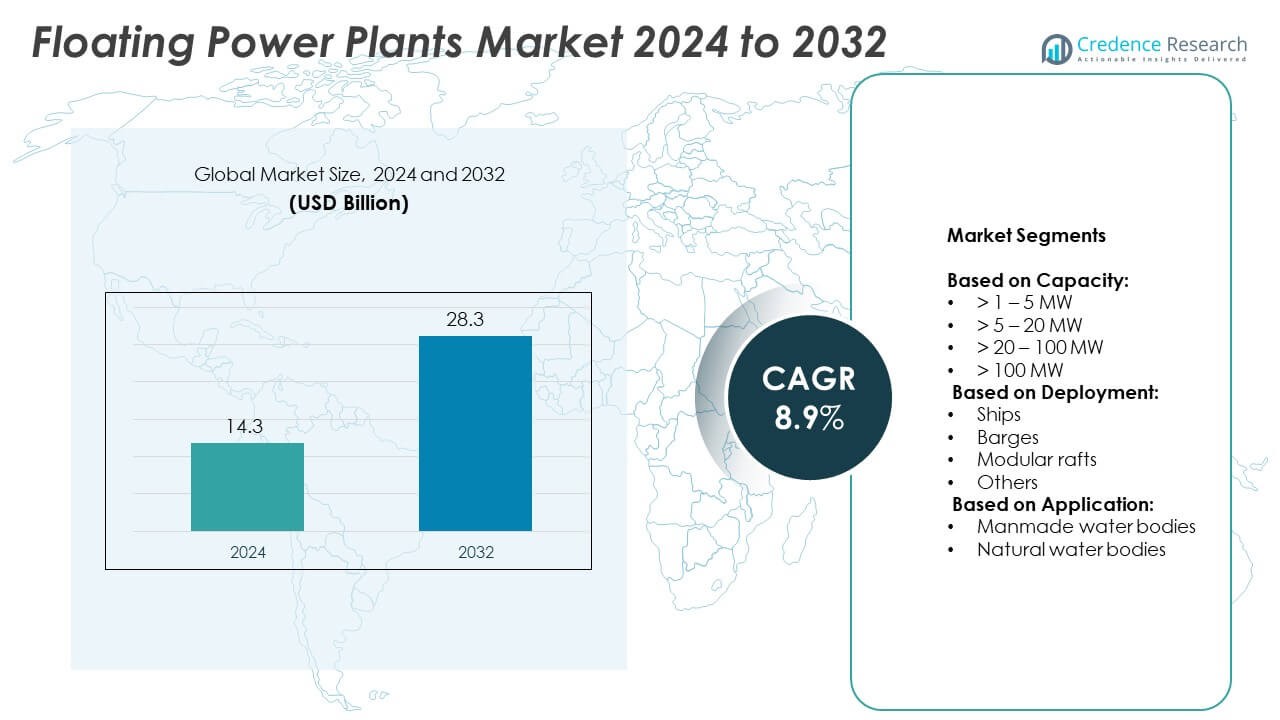
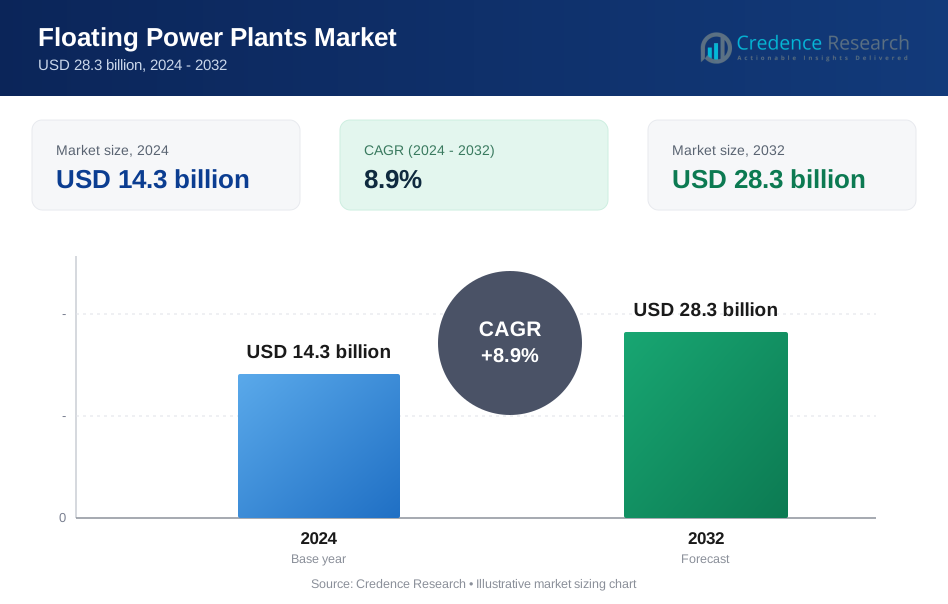
Floating Power Plants Market size was valued at USD 14.3 billion in 2024 and is anticipated to reach USD 28.3 billion by 2032, at a CAGR of 8.9% during the forecast period.
| REPORT ATTRIBUTE | DETAILS |
|---|---|
| Historical Period | 2020-2023 |
| Base Year | 2024 |
| Forecast Period | 2025-2032 |
| Floating Power Plants Market Size 2024 | USD 14.3 Billion |
| Floating Power Plants Market, CAGR | 8.9% |
| Floating Power Plants Market Size 2032 | USD 28.3 Billion |
The Floating Power Plants market grows with rising global energy demand, expansion of renewable integration, and increasing need for distributed power solutions. Flexible deployment in remote areas and island nations strengthens adoption, while LNG and hybrid systems gain traction as cleaner alternatives. Modular designs and scalable platforms reduce costs and shorten project timelines. Supportive government policies and public-private partnerships enhance investment, while integration with offshore wind and solar projects highlights the market’s role in driving sustainable and resilient energy generation worldwide.
The Floating Power Plants market shows strong growth across North America, Europe, Asia Pacific, Latin America, and the Middle East & Africa, driven by rising energy demand, renewable integration, and flexible deployment needs. Asia Pacific leads expansion with large-scale projects in coastal and island regions, while Europe emphasizes hybrid renewable integration. North America focuses on LNG and modular platforms, and Latin America and Africa adopt floating units for remote electrification. Key players include Karadeniz Holding, Wärtsilä, GE Vernova, and Siemens Energy.
Market Insights
- Floating Power Plants market size was USD 14.3 billion in 2024 and is expected to reach USD 28.3 billion by 2032, growing at a CAGR of 8.9%.
- Rising global energy demand, increasing need for distributed generation, and expansion of renewable integration drive market growth.
- Trends highlight adoption of LNG-based floating units, hybrid systems with storage, and rapid deployment of modular platforms.
- Competition is shaped by companies investing in large-scale powership fleets, floating solar platforms, and hybrid offshore solutions.
- High capital requirements, complex financing structures, and regulatory hurdles act as key restraints to faster adoption.
- Asia Pacific leads growth with large investments in coastal and island projects, while Europe focuses on hybrid renewable integration, and North America emphasizes LNG-powered floating units.
- Emerging opportunities arise in Latin America, the Middle East, and Africa where floating power addresses electrification needs of remote communities and industrial sectors.
Market Drivers
Rising Global Energy Demand and Flexible Power Solutions
The Floating Power Plants market grows with the steady rise in global electricity demand. Nations face challenges in meeting peak demand while ensuring stable supply. Floating units deliver flexibility by being quickly deployed near demand centers. It reduces the need for extensive grid expansion in congested or remote regions. The ability to relocate plants supports temporary and long-term needs effectively. It strengthens energy security while minimizing infrastructure costs. This adaptability drives significant interest from utilities and governments.
- For instance, Karpowership, a subsidiary of Karadeniz Holding, managed the world's largest fleet of floating power plants. As of 2022, the active Karpowership fleet had 36 powerships with a total installed capacity exceeding 6,000 MW. The company planned to increase its fleet size in the following years.
Expansion of Offshore Renewable Energy Projects
The growth of offshore wind and solar projects fuels adoption of floating platforms. Offshore sites offer higher generation potential, but they require flexible solutions to integrate power into grids. Floating plants operate in synergy with offshore renewables by providing stable backup and balancing supply. It ensures grid reliability in regions with intermittent renewable production. Deployment at offshore locations avoids costly land acquisition, a key barrier in dense regions. Countries with limited land availability support the demand strongly. It reflects the alignment of floating plants with renewable expansion strategies.
- For instance, The Cirata Floating Solar Power Plant in Indonesia was inaugurated in November 2023 and has a capacity of 192 MWp.
Rising Investments in Remote and Island Electrification
Remote areas and island nations remain heavily dependent on expensive diesel imports. Floating power plants deliver scalable and faster alternatives compared to traditional land-based facilities. It provides reliable electricity without long delays for grid infrastructure construction. Governments and private developers adopt floating solutions to lower costs and reduce reliance on imports. This creates strong demand in Southeast Asia, Africa, and the Caribbean. The approach also supports tourism and industrial growth in isolated locations. It improves energy resilience and supports sustainable economic expansion.
Supportive Policy Frameworks and Technological Advancements
Government incentives and financing programs create favorable conditions for floating power development. Policies encouraging renewable integration and distributed generation expand market opportunities. Continuous advances in modular design, fuel flexibility, and hybrid systems improve performance. It reduces lifecycle costs and enhances project viability. Energy companies invest in hybrid models that combine LNG, renewables, and storage on floating platforms. These innovations improve efficiency while lowering emissions. The growing alignment of technology and regulation accelerates adoption across global regions.
Market Trends
Integration of Renewable Energy with Floating Platforms
The Floating Power Plants market records a strong trend toward renewable integration. Developers combine solar PV, wind, and hybrid systems with floating units. This ensures consistent power delivery while reducing emissions. It addresses rising pressure for clean energy adoption across nations. Floating solar in particular gains momentum due to compatibility with reservoirs and offshore sites. Governments encourage these projects to optimize water and land usage. The trend enhances long-term sustainability of floating power solutions.
- For instance, Ciel & Terre, a global pioneer in floating solar technology, had installed more than 280 floating solar projects in over 30 countries by June 2023, representing approximately 820 MWp of installed capacity
Shift Toward LNG-Based and Hybrid Power Plants
Demand grows for LNG-based floating plants due to cleaner combustion and lower emissions. Hybrid systems combining gas turbines, storage, and renewables gain traction worldwide. It creates operational flexibility by addressing both base load and peak demand. LNG solutions attract governments aiming to reduce dependence on coal and oil. Developers deploy hybrid floating power plants to diversify generation sources. This approach increases efficiency while aligning with global decarbonization targets. The movement toward multi-fuel systems shapes competitive differentiation.
- For instance, Mitsubishi Power, a power solutions brand of Mitsubishi Heavy Industries, Ltd., completed the installation and commissioning of a 500 MW natural gas-fired gas turbine combined-cycle (GTCC) power generation system for the Muara Karang Power Plant in Indonesia in October 2021.
Advancements in Modular and Scalable Plant Designs
Manufacturers focus on modular designs that enable rapid deployment and scalability. Projects now use standardized components to lower costs and shorten timelines. It helps utilities and independent producers adapt to changing demand patterns. Scalable units meet the requirements of both small islands and large urban centers. This modularity reduces risks in project financing and execution. Growing preference for flexible deployment strengthens adoption across emerging economies. The trend reflects strong alignment with evolving power needs.
Expansion of Public-Private Partnerships in Energy Projects
Collaboration between governments and private developers accelerates new installations. Public-private partnerships (PPPs) provide critical funding and regulatory support. It reduces financial risks while ensuring faster project approvals. Energy firms leverage such collaborations to expand into new regions. Island nations, oil-producing countries, and developing economies actively adopt this model. PPPs strengthen the global outlook for floating power projects by unlocking investment opportunities. This trend enhances project pipeline stability and investor confidence worldwide.
Market Challenges Analysis
High Capital Costs and Complex Project Financing
The Floating Power Plants market faces challenges due to high upfront capital requirements. Building floating platforms, securing marine engineering expertise, and integrating advanced turbines increase costs significantly. It makes financing difficult, particularly in developing regions with limited funding access. Banks and investors often demand long-term contracts, creating delays in project execution. The reliance on specialized infrastructure, including mooring systems and subsea cables, adds to expenses. Developers struggle to balance affordability with technical reliability. These factors restrict widespread adoption despite strong demand potential.
Regulatory Barriers and Environmental Concerns
Unclear regulatory frameworks hinder smooth deployment in many countries. Permits for marine usage, environmental approvals, and compliance with safety standards often slow progress. It creates uncertainty for developers, increasing both time and cost of implementation. Concerns about marine ecosystem disruption, fisheries impact, and coastal community objections add further resistance. Governments impose strict environmental guidelines that extend project timelines. The complexity of coordinating multiple agencies complicates decision-making for large-scale projects. Such challenges limit expansion speed and reduce investor confidence in floating power ventures.
Market Opportunities
Rising Demand for Clean and Distributed Power Solutions
The Floating Power Plants market holds strong opportunities through the global push for cleaner energy. Nations aim to reduce coal and oil dependence by adopting LNG and renewable-integrated floating units. It enables reliable electricity supply with lower emissions while meeting rising climate targets. Distributed power generation supports industrial clusters, remote areas, and disaster-prone regions. Floating plants can be deployed rapidly, offering governments and utilities flexible solutions. This advantage positions them as an attractive choice in transitioning energy systems. The growing emphasis on sustainability ensures expanding project pipelines worldwide.
Expansion Across Emerging Economies and Island Nations
Emerging economies and island nations create major growth avenues for floating power solutions. Limited land availability, high reliance on imported fuels, and growing populations drive demand. It offers scalability that addresses both temporary needs and long-term grid stability. Southeast Asia, Africa, and the Caribbean represent promising regions due to infrastructure gaps. Tourism, mining, and manufacturing sectors in these areas require reliable power to sustain growth. Governments encourage public-private partnerships to accelerate deployment of floating units. These opportunities strengthen the market’s role in global energy diversification.
Market Segmentation Analysis:
By Capacity:
The Floating Power Plants market segments by capacity into >1–5 MW, >5–20 MW, >20–100 MW, and >100 MW. Small-scale units in the >1–5 MW range serve remote communities and localized industrial facilities. Medium capacity plants in the >5–20 MW range meet the needs of island nations and distributed power projects. It creates cost-effective solutions for regions facing grid access challenges. Larger capacities, particularly in the >20–100 MW segment, address urban demand and industrial clusters. The >100 MW category dominates large-scale deployments, offering stable electricity for metropolitan areas and national grids. Each capacity range supports diverse requirements, strengthening adoption across global markets.
- For instance, GE Vernova's Gas Power business has a long history of supporting Nigeria's electricity sector with land-based gas turbine power plants. During the COVID-19 pandemic, GE Vernova collaborated with the Niger Delta Power Holding Company (NDPHC) to complete service interventions on three GE 9E gas turbines at power plants in Calabar and Sapele. These efforts helped restore and secure the supply of up to 360 MW of electricity to the Nigerian grid
By Deployment:
Deployment segments include ships, barges, modular rafts, and others. Ship-based floating plants offer mobility and are ideal for emergency or temporary requirements. Barges remain widely preferred due to stability and ability to host large capacity units. Modular rafts deliver scalability and flexibility, enabling phased installations in varied geographies. It provides a practical solution for regions with evolving demand patterns. The “others” category includes hybrid deployment models with integrated storage or renewable facilities. Strong deployment diversity ensures that floating power adapts to multiple operational conditions worldwide.
- For instance, A consortium, jointly owned by China National Technical Import and Export Corporation (CNTIC) and VPower Group, developed a 477.1 MW LNG-to-power project in the Thaketa Township of Yangon, Myanmar. Commissioned in June 2020, this was the first project of its kind in the country.
By Application:
Application divides into manmade water bodies and natural water bodies. Installations on manmade reservoirs and industrial basins allow efficient space utilization and easier monitoring. Natural water bodies such as seas, rivers, and lakes present wider deployment opportunities. It supports both large utility projects and distributed energy supply in coastal areas. Natural water body installations hold strong potential due to abundant availability and scalability. Both categories demonstrate the flexibility of floating plants to address different geographic requirements. This segmentation ensures steady adoption across diverse energy landscapes.
Segments:
Based on Capacity:
- > 1 – 5 MW
- > 5 – 20 MW
- > 20 – 100 MW
- > 100 MW
Based on Deployment:
- Ships
- Barges
- Modular rafts
- Others
Based on Application:
- Manmade water bodies
- Natural water bodies
Based on the Geography:
- North America
- U.S.
- Canada
- Mexico
- Europe
- UK
- France
- Germany
- Italy
- Spain
- Russia
- Belgium
- Netherlands
- Austria
- Sweden
- Poland
- Denmark
- Switzerland
- Rest of Europe
- Asia Pacific
- China
- Japan
- South Korea
- India
- Australia
- Thailand
- Indonesia
- Vietnam
- Malaysia
- Philippines
- Taiwan
- Rest of Asia Pacific
- Latin America
- Brazil
- Argentina
- Peru
- Chile
- Colombia
- Rest of Latin America
- Middle East
- UAE
- KSA
- Israel
- Turkey
- Iran
- Rest of Middle East
- Africa
- Egypt
- Nigeria
- Algeria
- Morocco
- Rest of Africa
Regional Analysis
North America
North America holds 32% share of the Floating Power Plants market, supported by strong investments in flexible power generation solutions. The United States leads demand due to its focus on distributed power and renewable integration. Canada supports growth with projects targeting remote communities and mining sectors that require stable electricity. It benefits from regulatory frameworks encouraging LNG-based floating platforms as a cleaner alternative to coal. Developers invest in hybrid floating projects that combine natural gas and renewable sources to enhance grid reliability. The presence of established energy infrastructure and private sector financing further strengthens adoption across the region. North America continues to expand opportunities with ongoing efforts to reduce dependence on land-based power plants and diversify energy portfolios.
Europe
Europe accounts for 27% share, driven by its strong decarbonization policies and renewable expansion. Countries such as Norway, the Netherlands, and Germany deploy floating power units to balance intermittent wind and solar projects. It supports grid stability while aligning with climate goals and emission reduction targets. Island territories under European governance also rely on floating units to address seasonal demand fluctuations. The region benefits from well-developed financial markets that support large-scale infrastructure investments. Strong collaboration between public and private stakeholders accelerates deployment across both inland water bodies and coastal areas. Europe remains a leader in promoting hybrid floating projects and advanced modular designs.
Asia Pacific
Asia Pacific represents the largest share at 34%, fueled by rapid industrial growth, rising populations, and expanding electricity demand. Countries such as Japan, China, and India invest heavily in floating units to enhance energy access and reduce fossil fuel reliance. Island nations across Southeast Asia create further opportunities due to limited land and high power needs. It provides scalable electricity supply for both urban and rural regions while ensuring grid resilience. Governments in Asia Pacific support public-private partnerships to encourage faster adoption. The region also benefits from advanced shipbuilding and marine engineering industries that lower deployment costs. Asia Pacific continues to dominate due to its vast coastal and island geographies suitable for floating installations.
Latin America
Latin America holds 5% share, supported by rising focus on energy diversification and grid stability. Brazil drives demand with projects linked to hydro reservoirs, offering cost savings and improved energy security. Chile and Argentina explore floating power to supplement renewable resources during variable production cycles. It provides flexible solutions for areas with limited infrastructure expansion options. Governments adopt floating platforms to reduce reliance on imported fuels and strengthen local power generation. Partnerships with international developers introduce advanced technologies into the region. Latin America grows steadily with increased emphasis on sustainable electricity generation.
Middle East and Africa
The Middle East and Africa account for 2% share, representing emerging opportunities for floating power adoption. Gulf countries explore LNG-based floating plants to enhance supply flexibility and reduce oil-fired generation. African nations adopt floating units to electrify rural communities and improve grid reliability. It addresses challenges of land scarcity and high infrastructure costs in several regions. Limited financing and regulatory hurdles slow wider adoption, yet government-led initiatives support gradual expansion. Coastal and island territories in both regions present strong potential for scalable projects. The Middle East and Africa remain in the early stages but show clear momentum toward floating power development.
Key Player Analysis
- Karadeniz Holding
- Wärtsilä
- Ciel et Terre International, SAS
- GE Vernova
- Floating Power Plant A/S
- Kawasaki Heavy Industries, Ltd.
- Swimsol
- CHN ENERGY Investment Group Co. LTD
- MITSUBISHI HEAVY INDUSTRIES, LTD.
- Siemens Energy
Competitive Analysis
The leading players in the Floating Power Plants market include Karadeniz Holding, Wärtsilä, Ciel et Terre International, SAS, GE Vernova, Floating Power Plant A/S, Kawasaki Heavy Industries, Ltd., Swimsol, CHN ENERGY Investment Group Co. LTD, Mitsubishi Heavy Industries, Ltd., and Siemens Energy. Companies focus on LNG-based plants, hybrid systems, and renewable-integrated platforms to meet rising demand for cleaner and more flexible energy. Modular and scalable designs are central to competitiveness, allowing faster deployment and reduced costs across varied geographies. Strong marine engineering expertise and proven track records in large-scale installations strengthen the position of established firms, while new entrants seek opportunities in niche renewable projects. Strategic partnerships and collaborations play a critical role in shaping competition. Public-private partnerships create pathways for project financing and regulatory approval, particularly in emerging economies. Firms differentiate themselves through their ability to integrate advanced storage, adapt to complex marine environments, and maintain efficiency in diverse applications. Focus on offshore wind and floating solar integration further highlights the competitive push toward sustainable energy generation. Market players continue to compete by aligning innovation with global climate targets and addressing the urgent need for reliable power in remote and island regions.
Recent Developments
- In February 2025, Proteus Marine Renewables installed a 1.1 MW tidal turbine (AR1100) in Japan’s Naru Strait
- In 2024, Floating Power Plant A/S acquired a 4.3 MW wind turbine generator from Siemens Gamesa for its demonstrator project off Gran Canaria. The turbine will be used for the P-Demo project, which integrates floating wind, wave power, and hydrogen storage technologies.
- In 2023, GE Vernova’s first Haliade-X offshore wind turbine began producing power at sea, as part of the Dogger Bank Wind Farm in the UK
Report Coverage
The research report offers an in-depth analysis based on Capacity, Deployment, Application and Geography. It details leading market players, providing an overview of their business, product offerings, investments, revenue streams, and key applications. Additionally, the report includes insights into the competitive environment, SWOT analysis, current market trends, as well as the primary drivers and constraints. Furthermore, it discusses various factors that have driven market expansion in recent years. The report also explores market dynamics, regulatory scenarios, and technological advancements that are shaping the industry. It assesses the impact of external factors and global economic changes on market growth. Lastly, it provides strategic recommendations for new entrants and established companies to navigate the complexities of the market.
Future Outlook
- The market will expand with rising demand for flexible and distributed energy solutions.
- Hybrid floating plants combining LNG, renewables, and storage will gain wider adoption.
- Governments will encourage deployment through supportive policies and funding programs.
- Technological advances in modular platforms will reduce project timelines and costs.
- Island nations and remote regions will drive significant new installations.
- Integration with offshore wind and solar projects will strengthen long-term growth potential.
- Environmental standards will push developers toward cleaner and low-emission technologies.
- Public-private partnerships will increase to accelerate deployment in emerging markets.
- Marine engineering innovations will improve plant durability and operational efficiency.
- Global utilities will diversify portfolios with floating projects to enhance grid resilience
Request a Free Sample
Fill in your details and we'll send you a free sample report.
- Sample data tables & charts
- Research methodology
Need a Custom Version of This Report?
Tailor the scope, geography, or segments to your exact requirements.
- Custom geography or segment scope
- Direct access to our analyst team
Frequently Asked Questions
What is the current market size for Floating Power Plants market, and what is its projected size in 2032?
At what Compound Annual Growth Rate is the Floating Power Plants Market projected to grow between 2025 and 2032?
Which Floating Power Plants market segment held the largest share in 2024?
What are the primary factors fueling the growth of the Floating Power Plants market?
Who are the leading companies in the Floating Power Plants Market?
Which region commanded the largest share of the Floating Power Plants market in 2024?
Table of Content
Chapter 1. Report Introduction
- 1.1 Report Description & Purpose
- 1.1.1 Report Title & Market Definition
- 1.1.2 Unique Selling Propositions (USP) & Key Differentiators
- 1.1.3 Value Proposition for Stakeholders
- 1.2 Research Objectives
- 1.2.1 Market Sizing Objectives (Volume & Revenue)
- 1.2.2 Segmentation Objectives
- 1.2.3 Competitive Intelligence Objectives
- 1.2.4 Forecast & Scenario Objectives
- 1.3 Report Scope
- 1.3.1 Floating Power Plants Scope – Types & Subtypes Covered
- 1.3.2 Geographic Scope – Regions & Countries Covered
- 1.3.3 Historical Period, Base Year & Forecast Period (2024; forecast to 2032)
- 1.3.4 Inclusions & Exclusions
- 1.4 HS Code & Classification Framework
- 1.5 Currency, Units & Pricing Basis
- 1.6 Target Stakeholders
- 1.7 Limitations & Assumptions
Chapter 2. Executive Summary
- 2.1 Global Floating Power Plants Market Snapshot
- 2.1.1 Market Size – Historical (2024) & Forecast (2024-2032) (2024: USD 14.3 billion → 2032: USD 28.3 billion)
- 2.1.2 Volume & Revenue – Global Totals
- 2.1.3 Key Market Highlights – Top Five Facts
- 2.2 Floating Power Plants Market Segmentation Snapshot
- 2.2.1 Market Split by Region – 2024 vs. 2032
- 2.3 Competitive Snapshot
- 2.3.1 Top 10 Players by Revenue Share – 2024
- 2.3.2 Top 10 Players by Volume Share – 2024
- 2.3.3 Recent Strategic Developments (18-Month Summary)
- 2.4 Key Investment Highlights & Strategic Conclusions
Chapter 3. Floating Power Plants Market Dynamics & Industry Analysis
- 3.1 Market Overview & Context
- 3.1.1 Floating Power Plants Market Position in the Broader Automotive Value Chain
- 3.1.2 OEM vs. Replacement Market Dynamics
- 3.1.3 Market Maturity & Development Stage by Region
- 3.2 Floating Power Plants Market Drivers
- 3.3 Floating Power Plants Market Restraints & Challenges
- 3.4 Floating Power Plants Market Opportunities
- 3.5 Porter's Five Forces Analysis
- 3.5.1 Threat of New Entrants
- 3.5.2 Bargaining Power of Suppliers
- 3.5.3 Bargaining Power of Buyers
- 3.5.4 Threat of Substitutes
- 3.5.5 Competitive Rivalry – Intensity Assessment
- 3.6 Floating Power Plants Value Chain Analysis
- 3.6.1 Upstream – Raw Material/Input Suppliers
- 3.6.1.1 Raw Material/Input 1
- 3.6.1.2 Raw Material/Input 2
- 3.6.1.3 Raw Material/Input 3
- 3.6.2 Midstream – Production/Manufacturing/Service Delivery
- 3.6.2.1 Production/Process Overview
- 3.6.2.2 Key Facility Locations & Capacity by Manufacturer
- 3.6.3 Downstream – Distribution & End Consumer
- 3.6.3.1 Primary Channel – B2B/OEM
- 3.6.3.2 Secondary Channels – Dealer, Retail, Online, Direct
- 3.6.4 Value Chain Profitability Analysis
- 3.6.1 Upstream – Raw Material/Input Suppliers
- 3.7 PESTEL Analysis
- 3.7.1 Political Factors
- 3.7.2 Economic Factors
- 3.7.3 Social Factors
- 3.7.4 Technological Factors
- 3.7.5 Environmental Factors
- 3.7.6 Legal Factors
- 3.8 Floating Power Plants Supply Chain Analysis
- 3.8.1 Raw Material/Input Supply Risk Assessment
- 3.8.2 Manufacturing Concentration Risk (Geographic Exposure)
- 3.8.3 Trade Disruption Impact Analysis
- 3.9 Regulatory & Policy Landscape
Note: The regulatory and policy landscape section covers regulations based on their applicability to the market, Floating Power Plants category, geography, and scope of the study. Only regulatory frameworks with a material impact on operations, compliance, trade, sustainability, or market access are analyzed in detail.
Chapter 4. Key Investment Pockets & Opportunity Analysis
- 4.1 Floating Power Plants Market Attractiveness Analysis
- 4.1.1 By Region – Investment Attractiveness Matrix (Volume × CAGR)
- 4.2 Absolute Revenue Growth Opportunity
- 4.2.1 By Region – Absolute USD Growth Through 2032
- 4.3 Incremental Volume Opportunity
- 4.3.1 By Region – Incremental Volume Through 2032
- 4.3.2 Segment – Incremental Volume
- 4.4 Emerging Submarket Opportunity Deep Dive (Subject to Applicability)
- 4.5 Emerging Market Opportunity Scorecards
- 4.5.1 United States
- 4.5.2 Europe
- 4.5.3 Asia
- 4.5.4 Middle East & Africa
Note: Emerging Market Opportunity Scorecards will be included based on relevance and strategic importance. Regions listed are indicative and may vary depending on data availability and market dynamics.
Chapter 5. Floating Power Plants Import-Export Analysis & Trade Flows
- 5.1 Global Trade Overview
- 5.1.1 Global Export Value by Country (2024)
- 5.1.2 Global Export Volume by Country (2024)
- 5.1.3 Global Import Value by Country (2024)
- 5.1.4 Global Import Volume by Country (2024)
- 5.1.5 Net Trade Balance by Country (2024)
- 5.2 Export Analysis – Segment
- 5.2.1 Type 1 (HS Code)
- 5.2.2 Type 2 (HS Code)
- 5.2.3 Type 3 (HS Code)
- 5.2.4 Type 4 (HS Code)
- 5.2.5 Type 5 (HS Code)
- 5.3 Import Analysis – Segment
- 5.3.1 Type 1 (HS Code)
- 5.3.2 Type 2 (HS Code)
- 5.3.3 Type 3 (HS Code)
- 5.3.4 Type 4 (HS Code)
- 5.3.5 Type 5 (HS Code)
- 5.4 Average Unit Trade Prices
- 5.4.1 Average Export Price – Segment & Country
- 5.4.2 Average Import Price – Segment & Source Country
- 5.4.3 Price Trends (2024)
- 5.5 Key Trade Route Analysis
- 5.5.1 Trade Route 1
- 5.5.2 Trade Route 2
- 5.5.3 Trade Route 3
- 5.5.4 Trade Route 4
- 5.5.5 Trade Route 5
- 5.6 Trade Policy Impact Assessment
- 5.6.1 US Anti-Dumping & Section 301 Tariffs
- 5.6.2 EU Customs Union Impact
- 5.6.3 Major Free Trade Agreements
- 5.6.4 USMCA Rules of Origin
Note: Trade policy analysis will be included only where relevant to the Floating Power Plants market.
Chapter 6. Competitive Landscape & Company Benchmarking
- 6.1 Floating Power Plants Market Concentration & Structure
- 6.1.1 Herfindahl-Hirschman Index (HHI) – vs. 2024
- 6.1.2 Tier 1, Tier 2 & Tier 3 Market Structure
- 6.1.3 Global, Regional & Local Player Dynamics
- 6.2 Floating Power Plants Market Share Analysis – 2024
- 6.2.1 Global Revenue Share by Company
- 6.2.2 Global Volume Share by Company
- 6.2.3 Regional Revenue Share
- 6.2.4 Market Share Evolution ( vs. 2024)
- 6.2.5 OEM Segment Share by Company
- 6.2.6 Replacement Segment Share by Company
- 6.3 Production/Delivery Capacity & Facility Analysis
- 6.3.1 Global Installed Capacity
- 6.3.2 Capacity Utilization Rates
- 6.3.3 Production/Output Volume
- 6.3.4 Facility Locations & Capacity Map
- 6.3.5 Planned Capacity Additions
- 6.4 Floating Power Plants Competitive Benchmarking Matrix
- 6.4.1 Revenue, Volume, CAGR & Profitability Comparison
- 6.4.2 Channel Revenue Mix
- 6.4.3 Geographic Revenue Exposure
- 6.4.4 R&D Intensity
- 6.4.5 Sustainability Maturity
- 6.5 Strategic Developments in Floating Power Plants (Last 24 Months)
- 6.5.1 Mergers, Acquisitions & Divestments
- 6.5.2 New Floating Power Plants Launches
- 6.5.3 Facility Expansions
- 6.5.4 Strategic Alliances, Joint Ventures & Partnerships
- 6.5.5 Distribution Expansion & Market Entry
- 6.5.6 Sustainability & ESG Initiatives
- 6.6 Competitive Strategy Mapping
- 6.6.1 Leader, Challenger, Follower & Niche Classification
- 6.6.2 Pricing Strategy Comparison
- 6.6.3 Channel Strategy Matrix
Note: Strategic developments are included based on their materiality and the availability of reliable information.
Chapter 7. Global Floating Power Plants Market – By Distribution Channel
- 7.1 Segment Overview
- 7.1.1 Volume & Revenue Split by Channel (2024 & 2032)
- 7.1.2 Channel Mix Evolution (2024-2032)
Chapter 8. Regional Market Analysis – Global Overview
- 8.1 Global Regional Overview
- 8.1.1 Regional Volume Share
- 8.1.2 Regional Revenue Share
- 8.1.3 Regional Volume by Region
- 8.1.4 Regional Revenue by Region
- 8.1.5 Regional Forecast Through 2032
- 8.2 Cross-Regional Segment Analysis
- 8.2.1 By Distribution Channel
- 8.2.2 By Brand/Price Tier
Chapter 9. North America Floating Power Plants Market
- 9.1 United States
- 9.2 Canada
- 9.3 Mexico
Chapter 10. Europe Floating Power Plants Market
- 10.1 Germany
- 10.2 France
- 10.3 Italy
- 10.4 United Kingdom
- 10.5 Spain
- 10.6 Poland
- 10.7 Russia
- 10.8 Netherlands
- 10.9 Belgium
- 10.10 Sweden
- 10.11 Denmark
- 10.12 Norway
- 10.13 Rest of Europe
Chapter 11. Asia Pacific Floating Power Plants Market
- 11.1 China
- 11.2 India
- 11.3 Japan
- 11.4 South Korea
- 11.5 Thailand
- 11.6 Indonesia
- 11.7 Vietnam
- 11.8 Malaysia
- 11.9 Australia
- 11.10 Rest of Asia Pacific
Chapter 12. Latin America Floating Power Plants Market
- 12.1 Brazil
- 12.2 Argentina
- 12.3 Colombia
- 12.4 Chile
- 12.5 Rest of Latin America
Chapter 13. Middle East Floating Power Plants Market
- 13.1 Saudi Arabia
- 13.2 United Arab Emirates
- 13.3 Turkey
- 13.4 Israel
- 13.5 Iran
- 13.6 Rest of the Middle East
Chapter 14. Africa Floating Power Plants Market
- 14.1 South Africa
- 14.2 Egypt
- 14.3 Nigeria
- 14.4 Morocco
- 14.5 Rest of Africa
Chapter 15. Floating Power Plants Company Profiles
- 15.1 [Company 01]
- 15.1.1 Company Overview
- 15.1.2 Key Management Personnel
- 15.1.3 Products & Services Portfolio
- 15.1.4 Financial Performance
- 15.1.5 Key Market Focus & Geographic Presence
- 15.1.6 Recent Developments & Strategic Initiatives
Note: The company profile list is preliminary and may change based on research findings, market developments, data availability, and client requirements.
Chapter 16. Appendices
- Appendix A – List of Abbreviations & Acronyms
- Appendix B – Industry Classification Code Reference – Full Series
- Appendix C – Production & Capacity Data Tables
- Appendix D – End-Use & Demand Base Tables
- Appendix E – Consumption & Replacement Rate Assumptions
- Appendix F – ASP Reference Tables
- Appendix G – Manufacturing & Facility Database
- Appendix H – Import-Export Data Tables
- Appendix I – Regulatory Summary Tables
- Appendix J – Primary Research Participant List (Anonymized)
- Appendix K – Primary Research Questionnaire Framework
- Appendix L – Data Sources & Bibliography
- Appendix M – Market Size Divergence & Source Comparison
Chapter 17. Research Methodology
- 17.1 Research Framework & Philosophy
- 17.2 Secondary Research – Sources, Hierarchy & Data Extraction
- 17.3 Data Modeling – Bottom-Up & Top-Down Market Sizing
- 17.4 Primary Research – Stakeholder Framework, LOI & Sample Sizes
- 17.5 Forecast Methodology – Regression, Scenario & Sensitivity Analysis
- 17.6 Quality Control – Four-Layer Validation Framework
- 17.7 Limitations & Standard Assumptions
- 17.8 Disclaimer
