
Glucose Market Overview:
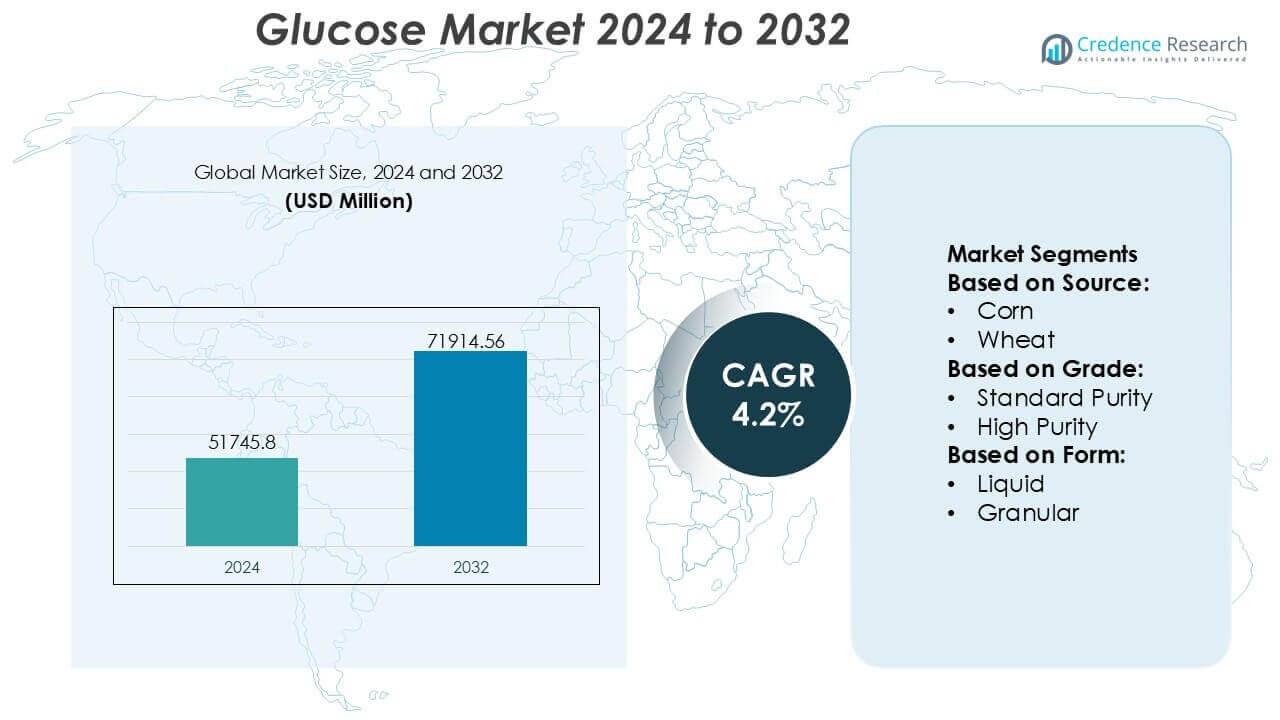
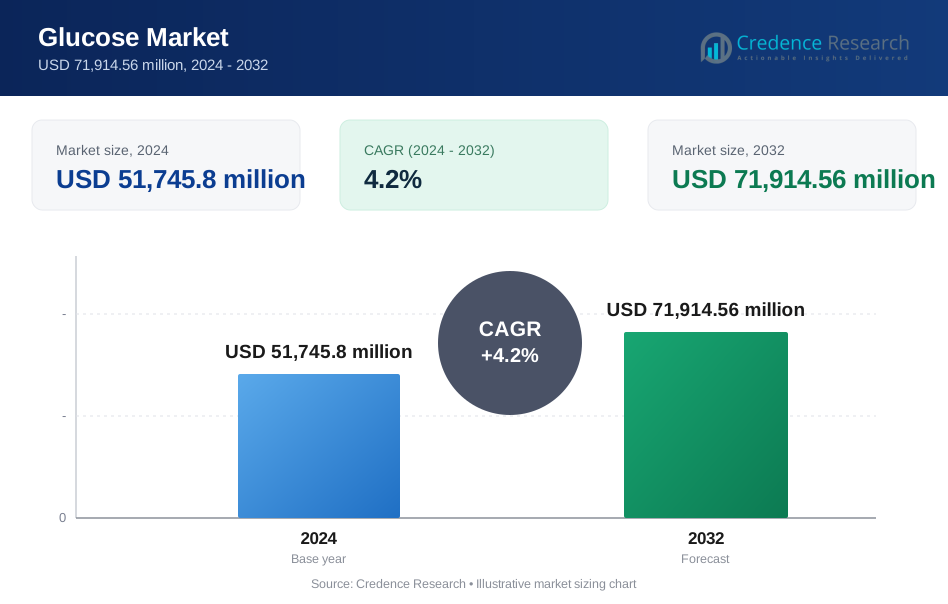
Glucose Market size was valued USD 51745.8 million in 2024 and is anticipated to reach USD 71914.56 million by 2032, at a CAGR of 4.2% during the forecast period.
| REPORT ATTRIBUTE | DETAILS |
|---|---|
| Historical Period | 2020-2023 |
| Base Year | 2024 |
| Forecast Period | 2025-2032 |
| Glucose Market Size 2024 | USD 51745.8 million |
| Glucose Market, CAGR | 4.2% |
| Glucose Market Size 2032 | USD 71914.56 million |
Glucose Market Insights
- Rising diabetes prevalence, increasing screening rates, and wider adoption of home-based testing devices act as key market drivers, strengthening long-term consumption across clinical and self-monitoring use cases.
- Continuous glucose monitoring represents the dominant segment with an estimated 62% share, driven by demand for real-time data, improved accuracy, and integration with digital health platforms.
- The competitive landscape is shaped by established players focusing on product innovation, digital ecosystem integration, and strategic collaborations to enhance patient engagement and clinical efficiency.
- Regionally, North America leads with an exact 38% market share, supported by advanced healthcare infrastructure, strong reimbursement policies, high awareness levels, and early adoption of advanced glucose monitoring technologies.
Glucose Market Segmentation Analysis:
By Source
Within the glucose market by source, corn-based glucose emerges as the dominant sub-segment, accounting for an estimated 65% market share, driven by abundant corn availability, high starch yield, and cost-efficient wet milling infrastructure. Corn glucose benefits from consistent quality and scalability, making it the preferred choice across food, beverage, pharmaceutical, and fermentation applications. Wheat-based glucose follows, supported by strong demand in regions with established wheat processing ecosystems, particularly in Europe. Potato-derived glucose and other sources such as cassava remain niche, constrained by higher raw material costs and regional supply limitations, despite their relevance in specialty and non-GMO formulations.
- For instance, Trividia Health, Inc. applies tightly controlled enzymatic processing standards aligned with pharmaceutical-grade glucose performance requirements, reflected in its glucose monitoring systems that achieve analytical accuracy within ±10 mg/dL across a measuring range extending from 20 mg/dL to 600 mg/dL, supported by test strips requiring sample volumes as low as 0.5 microliters demonstrating how consistent glucose quality underpins reliable downstream diagnostic performance.
By Grade
By grade, standard purity glucose holds the leading position with approximately 58% market share, primarily due to its widespread use in confectionery, bakery, beverages, and industrial fermentation processes. Standard purity grades offer adequate sweetness, fermentability, and cost efficiency for high-volume applications. High purity glucose, while representing a smaller share, is gaining steady traction in pharmaceuticals, nutraceuticals, and injectable formulations where stringent quality, low endotoxin levels, and precise dextrose equivalence are critical. Regulatory compliance requirements and expanding pharmaceutical manufacturing capacities continue to support incremental demand for high purity grades.
- For instance, F. Hoffmann-La Roche Ltd. employs pharmaceutical-grade glucose in parenteral and diagnostic manufacturing workflows that require endotoxin limits below 0.25 EU/mL and controlled osmolarity around 278 mOsm/L, while its analytical quality systems routinely validate glucose assay precision with coefficients of variation under 2 units across repeated batch testing demonstrating the technical rigor driving demand for high-purity grades.
By Form
In terms of form, liquid glucose dominates the market with an estimated 62% market share, driven by its ease of handling, rapid solubility, and seamless integration into continuous processing systems. Liquid glucose is extensively used in confectionery, beverages, and dairy applications where precise viscosity control and uniform sweetness are essential. Granular glucose retains relevance in dry mix formulations, tableting, and applications requiring extended shelf life and simplified transportation. However, additional dissolution steps and handling inefficiencies limit its broader adoption compared to liquid variants, reinforcing liquid glucose as the preferred form across large-scale industrial operations.
Key Growth Drivers
Expanding Demand from Food & Beverage Processing
Rising consumption of processed foods and ready-to-eat products continues to drive glucose usage as a sweetener, bulking agent, and fermentation substrate. Manufacturers rely on glucose to improve texture, mouthfeel, and shelf stability in bakery, confectionery, dairy, and beverage formulations. Its functional versatility supports applications ranging from browning and moisture retention to controlled sweetness. Growth in packaged foods across urban markets, coupled with cost competitiveness versus alternative sweeteners, reinforces sustained adoption of glucose in large-scale food and beverage processing operations.
- For instance, Abbott incorporates glucose-based carbohydrates in its medical nutrition formulations engineered for controlled digestion, where finished products are designed with osmolarity levels around 300 mOsm/kg and deliver approximately 15 grams of carbohydrates per serving, while manufacturing quality controls verify carbohydrate composition using enzymatic assays with detection limits below 0.1 grams demonstrating how precise glucose functionality underpins both nutritional performance and processing reliability.
Increasing Pharmaceutical and Medical Applications
Glucose demand benefits from its essential role in pharmaceutical formulations, intravenous solutions, and clinical nutrition. It serves as a primary energy source in parenteral nutrition, dialysis fluids, and oral rehydration products. Hospitals and healthcare providers increasingly use standardized, high-purity glucose to ensure patient safety and dosing accuracy. Expanding healthcare access, rising hospitalization rates, and greater emphasis on critical care and chronic disease management collectively strengthen glucose consumption across medical and pharmaceutical supply chains.
- For instance, LifeScan IP Holdings designs blood glucose monitoring systems validated to deliver analytical accuracy within ±15 mg/dL at lower glucose concentrations and within ±15 units at higher ranges, supported by test strip chemistries requiring sample volumes as low as 0.4 microliters and delivering results in approximately 5 seconds highlighting how stringent glucose handling and measurement standards underpin expanding medical and pharmaceutical applications.
Growth in Fermentation and Industrial Uses
Industrial fermentation applications significantly support glucose demand, particularly in bio-based chemicals, enzymes, organic acids, and amino acids. Glucose functions as a reliable carbon source for microbial fermentation due to its high conversion efficiency and process consistency. Expanding production of bioethanol, bioplastics, and specialty chemicals accelerates industrial uptake. Manufacturers favor glucose for its predictable performance, compatibility with automated processes, and availability at industrial scale, positioning it as a foundational input across multiple biochemical manufacturing pathways.
Key Trends & Opportunities
Shift Toward High-Purity and Specialty Grades
The glucose market is witnessing a clear shift toward high-purity and application-specific grades tailored for pharmaceuticals, nutraceuticals, and sensitive food applications. Customers increasingly demand tighter specifications for color, microbial load, and chemical consistency. This trend creates opportunities for producers investing in advanced refining, filtration, and quality control systems. Specialty glucose variants designed for controlled release, low endotoxin content, or enhanced solubility enable suppliers to differentiate portfolios and capture premium segments with stricter regulatory and performance requirements.
- For instance, GlySens Incorporated develops implantable glucose sensing systems designed for continuous operation over 180 days, with sensors calibrated to measure glucose concentrations across a range of 40 mg/dL to 400 mg/dL and transmit readings every 2 minutes, underscoring how high-purity glucose environments and stringent material control are critical to achieving long-duration stability and reliable analytical performance in specialty medical applications.
Rising Adoption in Clean-Label and Functional Formulations
Clean-label positioning influences ingredient selection across food and beverage categories, benefiting glucose derived from recognizable starch sources. Formulators favor glucose for its simple chemical profile and multifunctional role, reducing the need for additive-heavy recipes. Opportunities expand in functional foods where glucose supports energy delivery, fermentation-based nutrition, and flavor development without complex labeling. This trend aligns with consumer preference for transparent ingredients while allowing manufacturers to maintain processing efficiency and product consistency.
- For instance, Bayer AG leverages pharmaceutical- and nutrition-grade glucose inputs within its healthcare and diagnostics ecosystem, reflected in glucose monitoring technologies engineered to operate across measurement ranges from 10 mg/dL to 600 mg/dL, delivering results in approximately 5 seconds from capillary blood samples as small as 0.6 microliters demonstrating how clean, well-characterized glucose supports both transparent formulation strategies and high-precision functional performance.
Technological Optimization in Starch Processing
Advancements in starch hydrolysis, enzymatic conversion, and process automation improve glucose yield and operational efficiency. Producers increasingly adopt energy-efficient reactors, real-time monitoring, and precision enzyme dosing to optimize output and reduce waste. These innovations lower production costs while enhancing quality consistency, opening opportunities for capacity expansion and regional self-sufficiency. Technology-driven optimization also supports flexible production across corn, wheat, and alternative starch sources, improving resilience against raw material volatility.
Key Challenges
Volatility in Raw Material Supply and Pricing
Glucose production depends heavily on agricultural starch sources, making it vulnerable to crop yield fluctuations, climate variability, and commodity price swings. Supply disruptions or cost inflation in corn, wheat, or potato inputs directly affect production economics and pricing stability. Manufacturers face challenges in maintaining margins while honoring long-term supply contracts. Managing procurement risks through diversification, inventory strategies, and supplier partnerships remains critical but adds operational complexity to glucose manufacturing and distribution.
Regulatory and Quality Compliance Pressures
Stringent food safety and pharmaceutical regulations impose rigorous quality, traceability, and documentation requirements on glucose producers. Compliance with evolving standards across regions increases testing frequency, validation costs, and audit intensity. For pharmaceutical and medical-grade glucose, even minor deviations can lead to batch rejections or supply interruptions. Smaller producers may struggle to justify continuous investments in compliance infrastructure, creating barriers to entry and increasing competitive pressure from large, vertically integrated manufacturers.
Regional Analysis North America
North America leads the glucose market with an estimated 38% market share, supported by advanced food processing infrastructure and strong demand from pharmaceutical and biotechnology industries. The region benefits from abundant corn availability, enabling cost-efficient glucose production at scale. High consumption of packaged foods, confectionery, and beverages sustains steady demand, while pharmaceutical-grade glucose sees consistent uptake in intravenous solutions and clinical nutrition. Well-established regulatory frameworks and investments in high-purity processing technologies further strengthen North America’s position, allowing manufacturers to serve both domestic demand and export-oriented supply chains efficiently.
Europe
Europe accounts for approximately 29% of the global glucose market, driven by strong demand from food, beverage, and fermentation-based industries. The region emphasizes quality, traceability, and compliance, supporting higher adoption of refined and specialty glucose grades. Widespread use in bakery, confectionery, and dairy applications underpins volume demand, while industrial fermentation for bio-based chemicals adds incremental growth. Europe’s diversified starch base, including wheat and potato, reduces dependency on a single raw material. Sustainability initiatives and clean-label trends further encourage stable glucose consumption across Western and Central European markets.
Asia-Pacific
Asia-Pacific holds nearly 31% market share, reflecting rapid expansion in food processing, pharmaceuticals, and industrial manufacturing. Rising urbanization, population growth, and increasing consumption of packaged and convenience foods significantly boost glucose demand. The region also shows strong growth in fermentation-based industries, including amino acids, organic acids, and bioethanol. China and India drive volume through large-scale starch processing capacity and expanding healthcare sectors. Competitive manufacturing costs and improving processing technologies position Asia-Pacific as both a major consumption hub and an important global supply base.
Latin America
Latin America represents around 5% of the glucose market, supported by growing food and beverage industries and increasing industrial applications. Brazil and Mexico lead regional demand, benefiting from strong agricultural output and expanding starch processing capabilities. Glucose usage rises in confectionery, beverages, and fermentation processes, particularly in ethanol and food ingredients. Although the market remains smaller compared to developed regions, improving industrialization, rising disposable incomes, and investments in food processing infrastructure support gradual expansion of glucose consumption across the region.
Middle East & Africa
The Middle East & Africa accounts for approximately 3% market share, reflecting developing food processing and pharmaceutical sectors. Demand is driven by increasing imports of processed foods, gradual localization of manufacturing, and rising healthcare expenditure. Limited domestic starch processing capacity in several countries constrains large-scale production, leading to reliance on imports. However, investments in food manufacturing, pharmaceutical formulation, and industrial fermentation create long-term opportunities. Population growth and improving supply chains are expected to steadily support glucose demand across key Middle Eastern and African economies.
Glucose Market Segmentations:
By Source:
- Corn
- Wheat
By Grade:
- Standard Purity
- High Purity
By Form:
- Liquid
- Granular
By Geography
- North America
- U.S.
- Canada
- Mexico
- Europe
- Germany
- France
- U.K.
- Italy
- Spain
- Rest of Europe
- Asia Pacific
- China
- Japan
- India
- South Korea
- South-east Asia
- Rest of Asia Pacific
- Latin America
- Brazil
- Argentina
- Rest of Latin America
- Middle East & Africa
- GCC Countries
- South Africa
- Rest of the Middle East and Africa
Competitive Landscape
The competitive landscape of the glucose market players such as Trividia Health, Inc.; F. Hoffmann-La Roche Ltd.; Abbott; LifeScan IP Holdings; GlySens Incorporated; Bayer AG; Nova Diabetes Care; Ascensia Diabetes Care Holdings AG; Sanofi; Dexcom Inc. the glucose market is characterized by rapid technological advancement, strong brand competition, and continuous product innovation aimed at improving diabetes management outcomes. Market participants compete on the basis of measurement accuracy, sensor longevity, ease of use, and integration with digital health platforms such as mobile applications and cloud-based data analytics.
Continuous glucose monitoring systems are gaining prominence over traditional self-monitoring devices, intensifying competition around minimally invasive sensors and real-time data capabilities. Companies also differentiate through pricing strategies, reimbursement coverage, and wide distribution across hospitals, pharmacies, and e-commerce channels. Strategic partnerships with healthcare providers and investments in research and development further strengthen competitive positioning. Overall, the market remains highly dynamic, with innovation, regulatory compliance, and patient-centric design serving as the primary levers shaping competitive intensity.
Key Player Analysis
- Trividia Health, Inc.
- Hoffmann-La Roche Ltd.
- Abbott
- LifeScan IP Holdings
- GlySens Incorporated
- Bayer AG
- Nova Diabetes Care
- Ascensia Diabetes Care Holdings AG
- Sanofi
- Dexcom Inc.
Recent Developments
- In August 2024, Dexcom Inc. announced the launch of its over-the-counter continuous glucose monitoring (CGM) sensors in the United States. This new product aims to make glucose monitoring more accessible to individuals managing diabetes.
- In February 2024, Health Minister Mark Holland announced the long-time awaited details of the federal government's pharmacare plan with the assurance of covering diabetes contraception and treatment.
- In February 2024, Tandem Diabetes Care, Inc. a leading player in insulin delivery and diabetic technology announced the launch of the new Tandem Mobi, the smallest and durable automated insulin delivery system for diabetic patients.
Report Coverage
The research report offers an in-depth analysis based on Source, Grade, Form and Geography. It details leading market players, providing an overview of their business, product offerings, investments, revenue streams, and key applications. Additionally, the report includes insights into the competitive environment, SWOT analysis, current market trends, as well as the primary drivers and constraints. Furthermore, it discusses various factors that have driven market expansion in recent years. The report also explores market dynamics, regulatory scenarios, and technological advancements that are shaping the industry. It assesses the impact of external factors and global economic changes on market growth. Lastly, it provides strategic recommendations for new entrants and established companies to navigate the complexities of the market.
Future Outlook
- Continuous glucose monitoring adoption will accelerate as sensor accuracy, wear duration, and comfort continue to improve.
- Integration of glucose data with smartphones, wearables, and cloud platforms will strengthen real-time decision support.
- Artificial intelligence and predictive analytics will enhance trend analysis, alerts, and personalized glycemic insights.
- Non-invasive and minimally invasive monitoring technologies will attract strong research and commercialization focus.
- Broader reimbursement coverage will support wider penetration across both developed and emerging healthcare systems.
- Patient-centric designs emphasizing ease of use and reduced calibration will drive device replacement cycles.
- Home-based and remote glucose monitoring will expand alongside telehealth and digital care models.
- Combination of glucose monitoring with insulin delivery and therapy management will increase system-level solutions.
- Regulatory emphasis on data accuracy, cybersecurity, and interoperability will shape product development strategies.
- Emerging markets will witness faster uptake driven by rising diabetes prevalence and expanding healthcare access.
Request a Free Sample
Fill in your details and we'll send you a free sample report.
- Sample data tables & charts
- Research methodology
Need a Custom Version of This Report?
Tailor the scope, geography, or segments to your exact requirements.
- Custom geography or segment scope
- Direct access to our analyst team
Frequently Asked Questions
What is the current market size for the Glucose Market, and what is its projected size in 2032?
At what Compound Annual Growth Rate is the Glucose Market projected to grow between 2024 and 2032?
Which Glucose Market segment held the largest share in 2024?
What are the primary factors fueling the growth of the Glucose Market?
Who are the leading companies in the Glucose Market?
Which region commanded the largest share of the Glucose Market in 2024?
Table of Content
Chapter 1. Report Introduction
- 1.1 Report Description & Purpose
- 1.1.1 Report Title & Market Definition
- 1.1.2 Unique Selling Propositions (USP) & Key Differentiators
- 1.1.3 Value Proposition for Stakeholders
- 1.2 Research Objectives
- 1.2.1 Market Sizing Objectives (Volume & Revenue)
- 1.2.2 Segmentation Objectives
- 1.2.3 Competitive Intelligence Objectives
- 1.2.4 Forecast & Scenario Objectives
- 1.3 Report Scope
- 1.3.1 Glucose Scope – Types & Subtypes Covered
- 1.3.2 Geographic Scope – Regions & Countries Covered
- 1.3.3 Historical Period, Base Year & Forecast Period (2024; forecast to 2032)
- 1.3.4 Inclusions & Exclusions
- 1.4 HS Code & Classification Framework
- 1.5 Currency, Units & Pricing Basis
- 1.6 Target Stakeholders
- 1.7 Limitations & Assumptions
Chapter 2. Executive Summary
- 2.1 Global Glucose Market Snapshot
- 2.1.1 Market Size – Historical (2024) & Forecast (2024-2032) (2024: USD 51,745.8 million → 2032: USD 71,914.56 million)
- 2.1.2 Volume & Revenue – Global Totals
- 2.1.3 Key Market Highlights – Top Five Facts
- 2.2 Glucose Market Segmentation Snapshot
- 2.2.1 Market Split by Region – 2024 vs. 2032
- 2.3 Competitive Snapshot
- 2.3.1 Top 10 Players by Revenue Share – 2024
- 2.3.2 Top 10 Players by Volume Share – 2024
- 2.3.3 Recent Strategic Developments (18-Month Summary)
- 2.4 Key Investment Highlights & Strategic Conclusions
Chapter 3. Glucose Market Dynamics & Industry Analysis
- 3.1 Market Overview & Context
- 3.1.1 Glucose Market Position in the Broader Automotive Value Chain
- 3.1.2 OEM vs. Replacement Market Dynamics
- 3.1.3 Market Maturity & Development Stage by Region
- 3.2 Glucose Market Drivers
- 3.3 Glucose Market Restraints & Challenges
- 3.4 Glucose Market Opportunities
- 3.5 Porter's Five Forces Analysis
- 3.5.1 Threat of New Entrants
- 3.5.2 Bargaining Power of Suppliers
- 3.5.3 Bargaining Power of Buyers
- 3.5.4 Threat of Substitutes
- 3.5.5 Competitive Rivalry – Intensity Assessment
- 3.6 Glucose Value Chain Analysis
- 3.6.1 Upstream – Raw Material/Input Suppliers
- 3.6.1.1 Raw Material/Input 1
- 3.6.1.2 Raw Material/Input 2
- 3.6.1.3 Raw Material/Input 3
- 3.6.2 Midstream – Production/Manufacturing/Service Delivery
- 3.6.2.1 Production/Process Overview
- 3.6.2.2 Key Facility Locations & Capacity by Manufacturer
- 3.6.3 Downstream – Distribution & End Consumer
- 3.6.3.1 Primary Channel – B2B/OEM
- 3.6.3.2 Secondary Channels – Dealer, Retail, Online, Direct
- 3.6.4 Value Chain Profitability Analysis
- 3.6.1 Upstream – Raw Material/Input Suppliers
- 3.7 PESTEL Analysis
- 3.7.1 Political Factors
- 3.7.2 Economic Factors
- 3.7.3 Social Factors
- 3.7.4 Technological Factors
- 3.7.5 Environmental Factors
- 3.7.6 Legal Factors
- 3.8 Glucose Supply Chain Analysis
- 3.8.1 Raw Material/Input Supply Risk Assessment
- 3.8.2 Manufacturing Concentration Risk (Geographic Exposure)
- 3.8.3 Trade Disruption Impact Analysis
- 3.9 Regulatory & Policy Landscape
Note: The regulatory and policy landscape section covers regulations based on their applicability to the market, Glucose category, geography, and scope of the study. Only regulatory frameworks with a material impact on operations, compliance, trade, sustainability, or market access are analyzed in detail.
Chapter 4. Key Investment Pockets & Opportunity Analysis
- 4.1 Glucose Market Attractiveness Analysis
- 4.1.1 By Region – Investment Attractiveness Matrix (Volume × CAGR)
- 4.2 Absolute Revenue Growth Opportunity
- 4.2.1 By Region – Absolute USD Growth Through 2032
- 4.3 Incremental Volume Opportunity
- 4.3.1 By Region – Incremental Volume Through 2032
- 4.3.2 Segment – Incremental Volume
- 4.4 Emerging Submarket Opportunity Deep Dive (Subject to Applicability)
- 4.5 Emerging Market Opportunity Scorecards
- 4.5.1 United States
- 4.5.2 Europe
- 4.5.3 Asia
- 4.5.4 Middle East & Africa
Note: Emerging Market Opportunity Scorecards will be included based on relevance and strategic importance. Regions listed are indicative and may vary depending on data availability and market dynamics.
Chapter 5. Glucose Import-Export Analysis & Trade Flows
- 5.1 Global Trade Overview
- 5.1.1 Global Export Value by Country (2024)
- 5.1.2 Global Export Volume by Country (2024)
- 5.1.3 Global Import Value by Country (2024)
- 5.1.4 Global Import Volume by Country (2024)
- 5.1.5 Net Trade Balance by Country (2024)
- 5.2 Export Analysis – Segment
- 5.2.1 Type 1 (HS Code)
- 5.2.2 Type 2 (HS Code)
- 5.2.3 Type 3 (HS Code)
- 5.2.4 Type 4 (HS Code)
- 5.2.5 Type 5 (HS Code)
- 5.3 Import Analysis – Segment
- 5.3.1 Type 1 (HS Code)
- 5.3.2 Type 2 (HS Code)
- 5.3.3 Type 3 (HS Code)
- 5.3.4 Type 4 (HS Code)
- 5.3.5 Type 5 (HS Code)
- 5.4 Average Unit Trade Prices
- 5.4.1 Average Export Price – Segment & Country
- 5.4.2 Average Import Price – Segment & Source Country
- 5.4.3 Price Trends (2024)
- 5.5 Key Trade Route Analysis
- 5.5.1 Trade Route 1
- 5.5.2 Trade Route 2
- 5.5.3 Trade Route 3
- 5.5.4 Trade Route 4
- 5.5.5 Trade Route 5
- 5.6 Trade Policy Impact Assessment
- 5.6.1 US Anti-Dumping & Section 301 Tariffs
- 5.6.2 EU Customs Union Impact
- 5.6.3 Major Free Trade Agreements
- 5.6.4 USMCA Rules of Origin
Note: Trade policy analysis will be included only where relevant to the Glucose market.
Chapter 6. Competitive Landscape & Company Benchmarking
- 6.1 Glucose Market Concentration & Structure
- 6.1.1 Herfindahl-Hirschman Index (HHI) – vs. 2024
- 6.1.2 Tier 1, Tier 2 & Tier 3 Market Structure
- 6.1.3 Global, Regional & Local Player Dynamics
- 6.2 Glucose Market Share Analysis – 2024
- 6.2.1 Global Revenue Share by Company
- 6.2.2 Global Volume Share by Company
- 6.2.3 Regional Revenue Share
- 6.2.4 Market Share Evolution ( vs. 2024)
- 6.2.5 OEM Segment Share by Company
- 6.2.6 Replacement Segment Share by Company
- 6.3 Production/Delivery Capacity & Facility Analysis
- 6.3.1 Global Installed Capacity
- 6.3.2 Capacity Utilization Rates
- 6.3.3 Production/Output Volume
- 6.3.4 Facility Locations & Capacity Map
- 6.3.5 Planned Capacity Additions
- 6.4 Glucose Competitive Benchmarking Matrix
- 6.4.1 Revenue, Volume, CAGR & Profitability Comparison
- 6.4.2 Channel Revenue Mix
- 6.4.3 Geographic Revenue Exposure
- 6.4.4 R&D Intensity
- 6.4.5 Sustainability Maturity
- 6.5 Strategic Developments in Glucose (Last 24 Months)
- 6.5.1 Mergers, Acquisitions & Divestments
- 6.5.2 New Glucose Launches
- 6.5.3 Facility Expansions
- 6.5.4 Strategic Alliances, Joint Ventures & Partnerships
- 6.5.5 Distribution Expansion & Market Entry
- 6.5.6 Sustainability & ESG Initiatives
- 6.6 Competitive Strategy Mapping
- 6.6.1 Leader, Challenger, Follower & Niche Classification
- 6.6.2 Pricing Strategy Comparison
- 6.6.3 Channel Strategy Matrix
Note: Strategic developments are included based on their materiality and the availability of reliable information.
Chapter 7. Global Glucose Market – By Distribution Channel
- 7.1 Segment Overview
- 7.1.1 Volume & Revenue Split by Channel (2024 & 2032)
- 7.1.2 Channel Mix Evolution (2024-2032)
Chapter 8. Regional Market Analysis – Global Overview
- 8.1 Global Regional Overview
- 8.1.1 Regional Volume Share
- 8.1.2 Regional Revenue Share
- 8.1.3 Regional Volume by Region
- 8.1.4 Regional Revenue by Region
- 8.1.5 Regional Forecast Through 2032
- 8.2 Cross-Regional Segment Analysis
- 8.2.1 By Distribution Channel
- 8.2.2 By Brand/Price Tier
Chapter 9. North America Glucose Market
- 9.1 United States
- 9.2 Canada
- 9.3 Mexico
Chapter 10. Europe Glucose Market
- 10.1 Germany
- 10.2 France
- 10.3 Italy
- 10.4 United Kingdom
- 10.5 Spain
- 10.6 Poland
- 10.7 Russia
- 10.8 Netherlands
- 10.9 Belgium
- 10.10 Sweden
- 10.11 Denmark
- 10.12 Norway
- 10.13 Rest of Europe
Chapter 11. Asia Pacific Glucose Market
- 11.1 China
- 11.2 India
- 11.3 Japan
- 11.4 South Korea
- 11.5 Thailand
- 11.6 Indonesia
- 11.7 Vietnam
- 11.8 Malaysia
- 11.9 Australia
- 11.10 Rest of Asia Pacific
Chapter 12. Latin America Glucose Market
- 12.1 Brazil
- 12.2 Argentina
- 12.3 Colombia
- 12.4 Chile
- 12.5 Rest of Latin America
Chapter 13. Middle East Glucose Market
- 13.1 Saudi Arabia
- 13.2 United Arab Emirates
- 13.3 Turkey
- 13.4 Israel
- 13.5 Iran
- 13.6 Rest of the Middle East
Chapter 14. Africa Glucose Market
- 14.1 South Africa
- 14.2 Egypt
- 14.3 Nigeria
- 14.4 Morocco
- 14.5 Rest of Africa
Chapter 15. Glucose Company Profiles
- 15.1 [Company 01]
- 15.1.1 Company Overview
- 15.1.2 Key Management Personnel
- 15.1.3 Products & Services Portfolio
- 15.1.4 Financial Performance
- 15.1.5 Key Market Focus & Geographic Presence
- 15.1.6 Recent Developments & Strategic Initiatives
Note: The company profile list is preliminary and may change based on research findings, market developments, data availability, and client requirements.
Chapter 16. Appendices
- Appendix A – List of Abbreviations & Acronyms
- Appendix B – Industry Classification Code Reference – Full Series
- Appendix C – Production & Capacity Data Tables
- Appendix D – End-Use & Demand Base Tables
- Appendix E – Consumption & Replacement Rate Assumptions
- Appendix F – ASP Reference Tables
- Appendix G – Manufacturing & Facility Database
- Appendix H – Import-Export Data Tables
- Appendix I – Regulatory Summary Tables
- Appendix J – Primary Research Participant List (Anonymized)
- Appendix K – Primary Research Questionnaire Framework
- Appendix L – Data Sources & Bibliography
- Appendix M – Market Size Divergence & Source Comparison
Chapter 17. Research Methodology
- 17.1 Research Framework & Philosophy
- 17.2 Secondary Research – Sources, Hierarchy & Data Extraction
- 17.3 Data Modeling – Bottom-Up & Top-Down Market Sizing
- 17.4 Primary Research – Stakeholder Framework, LOI & Sample Sizes
- 17.5 Forecast Methodology – Regression, Scenario & Sensitivity Analysis
- 17.6 Quality Control – Four-Layer Validation Framework
- 17.7 Limitations & Standard Assumptions
- 17.8 Disclaimer
