
High Content Screening Market Size and Outlook
How big is the High Content Screening market?
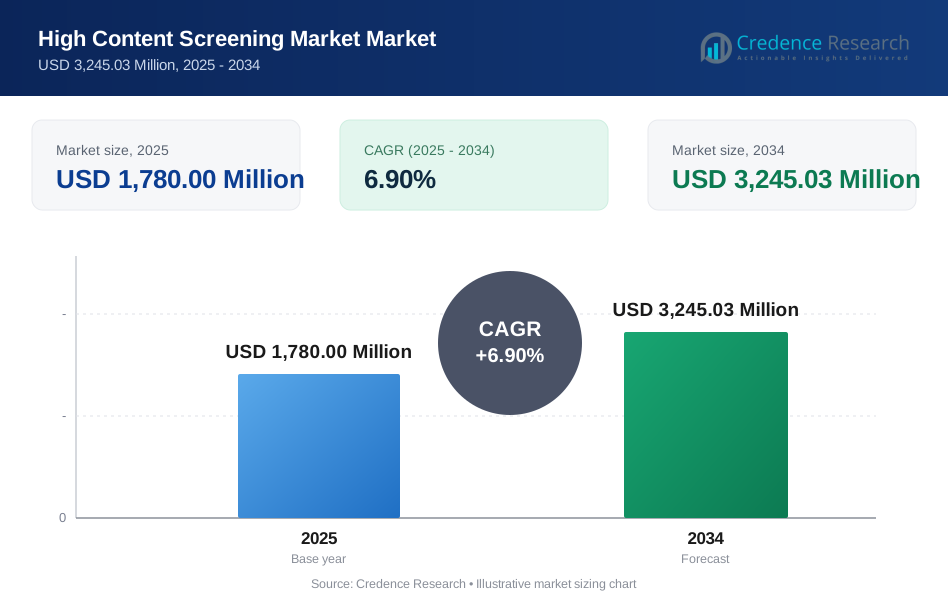
The High Content Screening market was valued at USD 1,780.00 million in 2025 and is projected to reach USD 3,245.03 million by 2034, expanding at a CAGR of 6.90%. North America holds the leading regional share, driven by robust pharmaceutical and biotechnology R&D investment.
The market has experienced steady growth since 2018, propelled by the increasing adoption of high content screening technologies in drug discovery and development. The integration of advanced imaging, automation, and data analytics has enabled researchers to accelerate compound screening and cellular analysis, supporting the expansion of this market.
Technological advancements, such as the integration of artificial intelligence and automated imaging, have transformed customer expectations and procurement strategies. Buyers now prioritize platforms that offer high throughput, reproducibility, and compatibility with advanced cell-based assays, influencing purchasing decisions and vendor selection.
Geographically, North America dominates due to its concentration of pharmaceutical and biotechnology companies, while Europe maintains a strong position with significant research infrastructure. The competitive landscape features established global players and emerging innovators, fostering a dynamic environment for product development and strategic partnerships.
What this report answers.
This report provides actionable insights for market entry, portfolio planning, pricing strategies, geographic expansion, and competitive assessment. It enables stakeholders to evaluate growth opportunities, benchmark performance, and anticipate shifts in demand and technology adoption across regions and segments.
Report Attributes
| Attribute | Detail |
|---|---|
| Historical period | 2018 |
| Base year | 2025 |
| Forecast period | 2025-2034 |
| Base-year market size | USD 1,780.00 Million |
| Forecast-year market size | USD 3,245.03 Million |
| Revenue CAGR | 6.90% |
| Segments covered | Product & Service, Instrument Type, Consumables & Accessories, Application, End User |
| Geographic scope | Global |
Eight Findings That Shape the Forecast
- The market is projected to grow from USD 1,780 million in 2025 to USD 3,245.03 million by 2034.
- North America leads with a 41.5% share, reflecting strong R&D investment.
- Europe holds the second-largest share at 28.0%.
- Regional demand in North America is driven by pharmaceutical innovation and funding.
- Instruments remain a core revenue segment due to high capital investment and replacement cycles.
- AI-driven automation is reshaping product design and workflow integration.
- Pharmaceutical and biotechnology companies are the primary end users.
- Emerging opportunities exist in advanced cell-based assays and AI-enabled analytics.
Market Size and Growth Outlook From 2025 to 2034
What is the High Content Screening market forecast for 2034
The High Content Screening market is forecast to reach USD 3,245.03 million by 2034, up from USD 1,780.00 million in 2025, reflecting a CAGR of 6.90% over the forecast period.
| Metric | Base year | Forecast year | CAGR |
|---|---|---|---|
| Revenue | USD 1,780.00 Million | USD 3,245.03 Million | 6.90% |
Growth is supported by increased adoption in drug discovery, recurring demand for consumables, and the integration of advanced imaging and analytics, which drive both replacement and new system purchases.
What the High Content Screening Market Covers
The High Content Screening market includes instruments, consumables and accessories, software, and services used for automated cellular imaging and analysis in drug discovery, toxicology, and basic research. It excludes adjacent markets such as general laboratory imaging, non-cell-based screening, and unrelated analytical platforms. Customers include pharmaceutical and biotechnology companies, academic and government institutes, and contract research organizations.
Instruments
Instruments comprise high content imaging platforms, cell detection and analysis systems, and cell imaging systems. These solutions address the need for high-throughput, automated cellular analysis, generating revenue through capital sales and ongoing service contracts. Their adoption is driven by the demand for reproducibility, scalability, and integration with laboratory workflows.
Consumables and Accessories
Consumables and accessories include reagents and assay kits, microplates, cell culture accessories, microscopy accessories, and plate sealers. These products support recurring revenue streams, as they are essential for each screening run. Their value proposition lies in compatibility, reliability, and performance consistency across experiments.
Software
Software solutions enable image acquisition, data analysis, and workflow automation. They are critical for extracting actionable insights from high content screening experiments and are often bundled with instruments or sold as standalone licenses. The revenue model includes perpetual licenses, subscriptions, and support services.
Services
Services encompass installation, training, maintenance, and technical support. These offerings ensure optimal instrument performance and user proficiency, contributing to customer retention and long-term value. Service contracts and on-demand support generate predictable revenue for vendors.
Applications
Applications span drug discovery and development, toxicology, and basic research. Each application area has distinct requirements for throughput, assay complexity, and data analysis, shaping procurement decisions and influencing vendor differentiation strategies.
High Content Screening Market Segmentation
The High Content Screening market is segmented by product and service, instrument type, consumables and accessories, application, and end user. Each dimension reflects distinct customer needs, procurement criteria, and revenue models, shaping the competitive landscape and growth opportunities across the value chain.
By Product & Service
This dimension includes instruments, consumables and accessories, software, and services. Instruments represent a significant capital investment and are central to laboratory workflows, while consumables and accessories generate recurring revenue through ongoing usage. Software and services provide critical support for data analysis, workflow automation, and system maintenance, enhancing customer retention and satisfaction.
| Segment | Revenue model | Growth profile |
|---|---|---|
| Instruments | Capital sales, service contracts | Steady replacement and upgrade demand |
| Consumables & Accessories | Recurring sales | Consistent, volume-driven growth |
| Software | Licenses, subscriptions | Expanding with data analytics adoption |
| Services | Contracts, on-demand support | Stable, linked to installed base |
By Instrument Type
Instrument type segmentation covers high content imaging platforms, cell detection and analysis systems, and cell imaging systems. High content imaging platforms are favored for their throughput and automation, supporting large-scale screening projects. Cell detection and analysis systems offer specialized capabilities for targeted applications, while cell imaging systems provide flexibility for diverse research needs.
By Consumables & Accessories
This segment includes reagents and assay kits, microplates, cell culture accessories, microscopy accessories, and plate sealers. Reagents and assay kits are essential for assay performance and reproducibility, while microplates and accessories ensure compatibility and workflow efficiency. Vendors differentiate through quality, reliability, and application-specific offerings.
By Application
Applications span drug discovery and development, toxicology, and basic research. Drug discovery and development is the largest application, driven by the need for high-throughput screening and compound profiling. Toxicology applications benefit from the ability to assess cellular responses to compounds, while basic research leverages high content screening for cancer cell line screening, epigenetics, gene expression analysis, and stem cell research.
By Drug Discovery & Development Application
This sub-segmentation includes primary and secondary screening, target identification and validation, compound profiling, and other drug discovery and development applications. Each subsegment addresses specific stages of the drug development pipeline, influencing procurement cycles and technology requirements.
By Basic Research Application
Basic research applications include cancer cell line screening, epigenetics, gene expression analysis, and stem cell research. These areas demand flexible, high-resolution imaging and robust data analysis, supporting innovation in disease modeling and therapeutic discovery.
By End User
End users comprise pharmaceutical and biotechnology companies, academic and government institutes, and contract research organizations (CROs and CDMOs). Pharmaceutical and biotechnology companies drive the majority of demand, prioritizing scalability, automation, and data integration. Academic and government institutes focus on research flexibility and grant-driven procurement, while CROs and CDMOs emphasize throughput and service quality to support client projects.
Detailed Segmentation Coverage
- By Product & Service: Instruments, Consumables & Accessories, Software, Services
- By Instrument Type: High Content Imaging Platforms, Cell Detection and Analysis Systems, Cell Imaging Systems
- By Consumables & Accessories: Reagents & Assay Kits, Microplates, Cell Culture Accessories, Microscopy Accessories, Plate Sealers
- By Application: Drug Discovery & Development, Toxicology, Basic Research
- By Drug Discovery & Development Application: Primary & Secondary Screening, Target Identification & Validation, Compound Profiling, Other Drug Discovery & Development Applications
- By Basic Research Application: Cancer Cell Line Screening, Epigenetics, Gene Expression Analysis, Stem Cell Research
- By End User: Pharmaceutical & Biotechnology Companies, Academic & Government Institutes, CROs & CDMOs
Request a Free Sample
Fill in your details and we'll send you a free sample report.
- Sample data tables & charts
- Research methodology
Market Dynamics
High Content Screening Market Trends to 2034
The High Content Screening market is shaped by automation, AI-driven analytics, modular system design, and the expansion of cloud-based data management. These trends are redefining how vendors deliver value, how buyers evaluate solutions, and how competitive differentiation is achieved across the value chain.
Automation and Workflow Integration
Automation is increasingly central to high content screening platforms, enabling laboratories to scale throughput and reduce manual intervention. Vendors are integrating robotic sample handling, automated plate readers, and seamless data transfer to streamline workflows. This trend reduces labor costs, minimizes human error, and supports reproducibility, making high content screening more attractive to pharmaceutical and biotechnology companies with high-volume screening needs. The commercial impact is a shift toward bundled solutions and service contracts that emphasize end-to-end workflow efficiency.
AI-Driven Image Analysis and Predictive Analytics
Artificial intelligence and machine learning are transforming image analysis in high content screening. Advanced algorithms enable rapid, unbiased interpretation of complex cellular data, supporting more accurate hit identification and phenotypic profiling. Vendors are differentiating through proprietary analytics platforms and user-friendly interfaces. This trend is driving demand for software upgrades and recurring analytics subscriptions, while also raising the bar for data validation and regulatory compliance.
Modular and Scalable System Design
Buyers are increasingly seeking modular, scalable high content screening systems that can adapt to evolving research needs. Vendors are responding with platforms that support incremental upgrades, flexible assay formats, and integration with third-party instruments. This approach reduces upfront capital requirements and extends system lifecycles, appealing to both large pharmaceutical companies and smaller research organizations. The result is a more dynamic competitive landscape, with vendors competing on flexibility and total cost of ownership.
Cloud-Based Data Management and Collaboration
The adoption of cloud-based data management solutions is enabling remote access, collaboration, and secure storage of high content screening data. Pharmaceutical and academic users benefit from centralized data repositories, streamlined sharing, and enhanced compliance with data integrity standards. Vendors are offering cloud-enabled platforms and subscription-based services, creating new revenue streams and supporting distributed research models. This trend is expected to accelerate as data volumes and collaboration requirements grow.
Where the Unserved Demand Sits
The largest opportunities in the High Content Screening market lie in expanding access for smaller research organizations, enabling advanced cell-based assays in emerging markets, integrating AI-driven analytics for non-specialist users, and addressing unmet needs in personalized medicine and rare disease research.
Expanding Access for Smaller Research Organizations
Many smaller academic and biotech organizations face barriers to adopting high content screening due to high capital costs and limited technical expertise. There is significant unserved demand for affordable, user-friendly platforms with modular features and flexible financing. Vendors that offer leasing, pay-per-use, or cloud-based solutions can unlock new customer segments. The principal risk is ensuring sufficient support and training to drive sustained usage and minimize churn.
Enabling Advanced Cell-Based Assays in Emerging Markets
Emerging markets in Asia Pacific and Latin America have growing pharmaceutical and academic research sectors but often lack access to advanced high content screening technologies. The unmet need is for robust, cost-effective systems that can operate in resource-constrained environments. Localized distribution, regulatory support, and tailored service models are required to convert latent demand into revenue. Execution risk centers on navigating complex import regulations and building local technical capacity.
Integrating AI-Driven Analytics for Non-Specialist Users
Non-specialist users in both industry and academia require intuitive, AI-enabled analytics to extract value from high content screening data without extensive training. There is white space for platforms that automate image analysis, provide actionable insights, and support regulatory compliance. Vendors must balance ease of use with analytical rigor, and the main risk is underestimating the validation and support needs of less-experienced users.
Addressing Personalized Medicine and Rare Disease Research
Personalized medicine and rare disease research demand high content screening solutions capable of handling small sample sizes and complex phenotypic assays. The opportunity lies in developing specialized reagents, assay kits, and data analysis tools tailored to these applications. Success depends on close collaboration with clinical researchers and regulatory bodies. The key risk is the fragmented nature of demand and the need for highly customized solutions.
High Content Screening Market Barriers
The main barriers to adoption in the High Content Screening market include high capital and operating costs, integration complexity with existing laboratory workflows, and the need for specialized technical expertise. These constraints affect procurement decisions, slow adoption among smaller organizations, and shape vendor strategies for market expansion.
High Capital and Operating Costs
High Content Screening platforms require substantial upfront investment, often exceeding the budgets of smaller research organizations and academic institutes. Ongoing operating costs, including consumables, maintenance, and software licenses, further increase the total cost of ownership. This barrier limits market access for price-sensitive buyers and can delay procurement cycles, especially in regions with constrained research funding. Vendors must address affordability through flexible pricing, leasing, or bundled service models to expand adoption.
Integration Complexity and Workflow Disruption
Integrating high content screening systems into existing laboratory workflows can be complex and disruptive. Compatibility with legacy instruments, data management systems, and assay protocols is often a concern for buyers. The need for customized installation, training, and workflow redesign increases implementation time and costs. This barrier is particularly acute for organizations with established processes or limited IT support, slowing the pace of technology adoption and reducing the appeal of new system purchases.
Specialized Technical Expertise and Training Requirements
Effective use of high content screening platforms requires specialized technical expertise in imaging, assay development, and data analysis. Many potential users lack the necessary skills or resources to fully leverage these technologies, leading to underutilization and suboptimal results. The need for ongoing training and support increases the burden on vendors and can deter adoption among less-experienced organizations. Addressing this barrier requires investment in user education, intuitive software interfaces, and responsive technical support.
Global Trade Context
Global High Content Screening Trade Segment Summary and Context for 2025
High Content Screening systems and consumables are primarily manufactured in North America, Europe, and parts of Asia Pacific, with cross-border trade driven by multinational pharmaceutical and biotechnology customers. The market relies on established distribution networks and regulatory harmonization to facilitate international procurement and deployment.
What Is Driving High Content Screening Demand
Growth in the High Content Screening market is driven by rising adoption in drug discovery, increasing demand for advanced cell-based assays, integration of artificial intelligence and automated imaging, and expanding pharmaceutical and biotechnology R&D investment.
Rising Adoption of High Content Screening in Drug Discovery
Drug discovery processes increasingly rely on high content screening to accelerate compound identification and validation. The ability to analyze multiple cellular parameters simultaneously enables researchers to identify promising drug candidates more efficiently. Pharmaceutical and biotechnology companies are investing in these platforms to reduce time-to-market and improve R&D productivity. However, high initial capital costs and integration complexity can limit adoption among smaller organizations.
Growing Demand for Advanced Cell-Based Assays
The shift toward physiologically relevant cell-based assays is fueling demand for high content screening technologies. These assays provide more predictive data on compound efficacy and toxicity, supporting better decision-making in early-stage drug development. Academic institutes and CROs are also adopting these platforms to enhance research quality and throughput. The need for specialized reagents and assay kits creates recurring revenue opportunities for vendors, though assay development complexity can slow adoption.
Evidence. The National Institutes of Health has reported increased funding for cell-based assay development, reflecting the growing emphasis on translational research and predictive toxicology.
Integration of Artificial Intelligence and Automated Imaging
Artificial intelligence and automated imaging are transforming high content screening workflows by enabling rapid, unbiased image analysis and data interpretation. These technologies reduce manual intervention, minimize errors, and increase throughput, making high content screening more accessible to a broader range of users. Vendors are differentiating through proprietary algorithms and user-friendly interfaces. However, data management and validation requirements can present challenges for some customers.
Increasing Pharmaceutical and Biotechnology R&D Investment
Rising global investment in pharmaceutical and biotechnology R&D is expanding the addressable market for high content screening. Companies are allocating greater resources to early-stage discovery and preclinical research, driving demand for advanced screening platforms. This trend is particularly pronounced in North America and Europe, where funding and infrastructure support rapid technology adoption. Economic uncertainty and budget constraints in some regions may temper growth rates.
Driver Impact Summary
| Driver | Expected Market Effect | Geographic Relevance | Impact Timeline |
|---|---|---|---|
| Rising Adoption of High Content Screening in Drug Discovery | Accelerates replacement and new system purchases, expands installed base | North America, Europe, Asia Pacific | Short to medium term |
| Growing Demand for Advanced Cell-Based Assays | Increases recurring consumables revenue, drives assay innovation | Global | Medium to long term |
| Integration of Artificial Intelligence and Automated Imaging | Enables workflow automation, reduces labor costs, enhances data quality | North America, Europe | Medium to long term |
| Increasing Pharmaceutical and Biotechnology R&D Investment | Expands total addressable market, supports premium pricing | North America, Europe, Asia Pacific | Short to medium term |
Regional Market Structure and Growth Outlook
North America leads the High Content Screening market, accounting for 41.5% of global revenue, followed by Europe at 28.0%. These regions benefit from strong pharmaceutical and biotechnology sectors, advanced research infrastructure, and robust funding for innovation. Asia Pacific, Latin America, the Middle East, and Africa present emerging opportunities, each with distinct adoption drivers and constraints.
North America
North America holds the largest share of the High Content Screening market, driven by the United States and Canada. The region benefits from a concentration of pharmaceutical and biotechnology companies, leading academic research institutions, and significant government and private R&D funding. Procurement cycles are shaped by a preference for advanced, integrated platforms and recurring demand for consumables and software upgrades. Local and international vendors compete on technology, service quality, and workflow integration. Regulatory harmonization and established distribution networks support market access, while high capital costs and technical complexity remain adoption barriers for smaller organizations. Strategic implications include a focus on premium product positioning and bundled service offerings to capture value from sophisticated buyers.
Europe
Europe accounts for 28.0% of global revenue, with major contributions from Germany, the United Kingdom, France, and Switzerland. The region is characterized by a strong academic research base, collaborative public-private partnerships, and a growing contract research sector. Procurement is influenced by grant funding cycles, regulatory requirements, and a preference for modular, scalable systems. European buyers emphasize data integrity, compliance, and interoperability, driving demand for advanced software and support services. Competition is intense, with both global and regional vendors vying for market share. Policy support for translational research and personalized medicine is expanding the addressable market, though budget constraints and procurement complexity can slow adoption.
Asia Pacific
Asia Pacific is an emerging growth region for High Content Screening, led by China, Japan, South Korea, and Australia. Rapid expansion of pharmaceutical manufacturing, increasing investment in life sciences, and government initiatives to boost research infrastructure are driving demand. Buyers in this region seek cost-effective, robust platforms that can operate in diverse laboratory environments. Local vendors are gaining ground through tailored solutions and competitive pricing, while international players focus on technology transfer and distribution partnerships. Market access is influenced by regulatory requirements, import tariffs, and the need for localized technical support. Strategic opportunities include expanding access to advanced cell-based assays and building local service capacity.
Latin America
Latin America presents moderate but growing demand for High Content Screening, with Brazil, Mexico, and Argentina as key markets. The region's pharmaceutical and academic sectors are investing in modernizing research infrastructure, though budget limitations and procurement delays are common. Buyers prioritize reliability, ease of use, and after-sales support. International vendors often partner with local distributors to navigate regulatory and logistical challenges. Policy initiatives to promote innovation and clinical research are gradually improving market access, but economic volatility and limited technical expertise remain constraints.
Middle East and Africa
The Middle East and Africa represent nascent markets for High Content Screening, with adoption concentrated in select academic and clinical research centers. The region faces challenges related to limited funding, infrastructure gaps, and a shortage of skilled personnel. Buyers are highly selective, focusing on proven, easy-to-maintain systems with strong vendor support. International companies typically enter through partnerships or government-funded projects. Market access is shaped by regulatory approvals, import restrictions, and the need for ongoing training. Strategic implications include the potential for targeted capacity-building initiatives and the introduction of entry-level platforms to stimulate demand.
Recent Developments and Strategic Implications
In January 2025, Molecular Devices LLC launched the ImageXpress HCS.ai High-Content Screening System, a fifth-generation high-content imager that combines faster acquisition, upgraded optics and integrated AI-driven analysis for complex 2D and 3D assays, which matters because screening labs are increasingly prioritizing throughput gains and easier interpretation of richer image datasets. This suggests tighter competitive pressure on other platform suppliers to match both speed and embedded AI usability in next-cycle instrument upgrades.
In July 2025, Sartorius AG launched the Incucyte CX3 Live-Cell Analysis System, adding confocal fluorescence imaging and parallel processing of up to six 96-well plates for continuous analysis of 3D cell models, which matters because organoid and spheroid workflows are pushing the market beyond endpoint imaging toward higher-throughput kinetic screening. This likely strengthens demand for incubator-based live-cell systems and raises the bar for rivals serving 3D assay development programs.
In April 2026, Agilent Technologies Inc. announced the launch of the BioTek Cytation 9 cell imaging multimode reader, combining multimode microplate reading with high-content cell imaging in one platform and positioning the system for basic research through high-content screening workflows, which matters because labs want broader assay coverage with less instrument sprawl and faster imaging throughput. This points to rising competition from hybrid reader-imager systems that can challenge standalone screening imagers on footprint, flexibility and total workflow efficiency.
In September 2026, Molecular Devices LLC and STEMCELL Technologies announced a validated automated workflow for culturing human intestinal organoids on the CellXpress.ai Automated Cell Culture System, describing it as the first milestone in a strategic collaboration and making the workflow available as a downloadable protocol, which matters because standardized upstream organoid preparation can reduce variability before high-content imaging and help more laboratories adopt human-relevant screening models at scale. This suggests differentiation in the market is moving beyond instruments alone toward validated end-to-end biology and automation ecosystems.
In September 2026, Agilent Technologies Inc. launched the Gen5 AI cell identification module for BioTek automated cell imagers, adding AI-based cell identification and segmentation directly into established Gen5 imaging workflows, which matters because software-led automation can reduce manual threshold tuning, improve reproducibility and extend the useful life of installed imaging systems in screening environments. This likely increases pressure on competitors to capture growth through AI software upgrades as well as new hardware placements.
Need a Custom Version of This Report?
Tailor the scope, geography, or segments to your exact requirements.
- Custom geography or segment scope
- Direct access to our analyst team
Competitive Landscape
Leading companies in the High Content Screening market include Thermo Fisher Scientific Inc., Danaher Corporation, Revvity Inc., Merck KGaA, Becton, Dickinson and Company, Sartorius AG, Yokogawa Electric Corporation, Agilent Technologies Inc., Bio-Rad Laboratories Inc., Bruker Corporation, Tecan Group Ltd., Corning Incorporated, Evident Corporation, Nikon Corporation, Carl Zeiss AG and Molecular Devices LLC.
The competitive landscape is characterized by a mix of established global players and specialized innovators. Large companies such as Thermo Fisher Scientific Inc., Danaher Corporation, and Merck KGaA leverage extensive product portfolios, global distribution networks, and strong brand recognition to maintain market presence. These firms invest heavily in R&D, enabling them to introduce advanced platforms with integrated automation, AI-driven analytics, and modular design. Their installed base and service infrastructure create high switching costs for customers, reinforcing long-term relationships and recurring revenue streams.
Emerging competitors and niche specialists focus on differentiated offerings, such as customizable assay kits, user-friendly software, or targeted applications for personalized medicine and rare disease research. Strategic partnerships, acquisitions, and technology licensing agreements are common as companies seek to expand capabilities and geographic reach. Pricing strategies vary, with premium solutions targeting sophisticated buyers and value-oriented products addressing underserved segments. The market remains dynamic, with ongoing innovation and consolidation shaping competitive dynamics and buyer options.
Key Companies
- Thermo Fisher Scientific Inc.
- Danaher Corporation
- Revvity Inc.
- Merck KGaA
- Becton, Dickinson and Company
- Sartorius AG
- Yokogawa Electric Corporation
- Agilent Technologies Inc.
- Bio-Rad Laboratories Inc.
- Bruker Corporation
- Tecan Group Ltd.
- Corning Incorporated
- Evident Corporation
- Nikon Corporation
- Carl Zeiss AG
- Molecular Devices LLC.
Frequently Asked Questions
What is the High Content Screening market size in 2025?
What is its forecast value by 2034?
What is the expected CAGR?
Which product or service segment leads the market?
Which region leads the market?
What drives demand in this market?
Who are the major companies in this market?
What are the main challenges and opportunities in this market?
Table of Content
Chapter 1. Report Introduction
- 1.1 Report Description & Purpose
- 1.1.1 Report Title & Market Definition
- 1.1.2 Unique Selling Propositions (USP) & Key Differentiators
- 1.1.3 Value Proposition for Stakeholders
- 1.2 Research Objectives
- 1.2.1 Market Sizing Objectives (Volume & Revenue)
- 1.2.2 Segmentation Objectives
- 1.2.3 Competitive Intelligence Objectives
- 1.2.4 Forecast & Scenario Objectives
- 1.3 Report Scope
- 1.3.1 High Content Screening Market Scope – Types & Subtypes Covered
- 1.3.2 Geographic Scope – Regions & Countries Covered
- 1.3.3 Historical Period, Base Year & Forecast Period (2018-2025; forecast to 2034)
- 1.3.4 Inclusions & Exclusions
- 1.4 HS Code & Classification Framework
- 1.5 Currency, Units & Pricing Basis
- 1.6 Target Stakeholders
- 1.7 Limitations & Assumptions
Chapter 2. Executive Summary
- 2.1 Global High Content Screening Market Market Snapshot
- 2.1.1 Market Size – Historical (2018-2025) & Forecast (2025-2034) (2025: USD 1,780.00 Million → 2034: USD 3,245.03 Million)
- 2.1.2 Volume & Revenue – Global Totals
- 2.1.3 Key Market Highlights – Top Five Facts
- 2.2 High Content Screening Market Market Segmentation Snapshot
- 2.2.1 Market Split – Product & Service – 2025 vs. 2034 (Volume & Revenue)
- 2.2.2 Market Split – Instrument Type – 2025 vs. 2034 (Volume & Revenue)
- 2.2.3 Market Split – Consumables & Accessories – 2025 vs. 2034 (Volume & Revenue)
- 2.2.4 Market Split – Application – 2025 vs. 2034 (Volume & Revenue)
- 2.2.5 Market Split – Drug Discovery & Development Application – 2025 vs. 2034 (Volume & Revenue)
- 2.2.6 Market Split – Basic Research Application – 2025 vs. 2034 (Volume & Revenue)
- 2.2.7 Market Split – End User – 2025 vs. 2034 (Volume & Revenue)
- 2.2.8 Market Split by Region – 2025 vs. 2034
- 2.3 Competitive Snapshot
- 2.3.1 Top 10 Players by Revenue Share – 2025
- 2.3.2 Top 10 Players by Volume Share – 2025
- 2.3.3 Recent Strategic Developments (18-Month Summary)
- 2.4 Key Investment Highlights & Strategic Conclusions
Chapter 3. High Content Screening Market Market Dynamics & Industry Analysis
- 3.1 Market Overview & Context
- 3.1.1 High Content Screening Market Market Position in the Broader Automotive Value Chain
- 3.1.2 OEM vs. Replacement Market Dynamics
- 3.1.3 Market Maturity & Development Stage by Region
- 3.2 High Content Screening Market Market Drivers
- 3.3 High Content Screening Market Market Restraints & Challenges
- 3.4 High Content Screening Market Market Opportunities
- 3.5 Porter's Five Forces Analysis
- 3.5.1 Threat of New Entrants
- 3.5.2 Bargaining Power of Suppliers
- 3.5.3 Bargaining Power of Buyers
- 3.5.4 Threat of Substitutes
- 3.5.5 Competitive Rivalry – Intensity Assessment
- 3.6 High Content Screening Market Value Chain Analysis
- 3.6.1 Upstream – Raw Material/Input Suppliers
- 3.6.1.1 Raw Material/Input 1
- 3.6.1.2 Raw Material/Input 2
- 3.6.1.3 Raw Material/Input 3
- 3.6.2 Midstream – Production/Manufacturing/Service Delivery
- 3.6.2.1 Production/Process Overview
- 3.6.2.2 Key Facility Locations & Capacity by Manufacturer
- 3.6.3 Downstream – Distribution & End Consumer
- 3.6.3.1 Primary Channel – B2B/OEM
- 3.6.3.2 Secondary Channels – Dealer, Retail, Online, Direct
- 3.6.4 Value Chain Profitability Analysis
- 3.6.1 Upstream – Raw Material/Input Suppliers
- 3.7 PESTEL Analysis
- 3.7.1 Political Factors
- 3.7.2 Economic Factors
- 3.7.3 Social Factors
- 3.7.4 Technological Factors
- 3.7.5 Environmental Factors
- 3.7.6 Legal Factors
- 3.8 High Content Screening Market Supply Chain Analysis
- 3.8.1 Raw Material/Input Supply Risk Assessment
- 3.8.2 Manufacturing Concentration Risk (Geographic Exposure)
- 3.8.3 Trade Disruption Impact Analysis
- 3.9 Regulatory & Policy Landscape
Note: The regulatory and policy landscape section covers regulations based on their applicability to the market, High Content Screening Market category, geography, and scope of the study. Only regulatory frameworks with a material impact on operations, compliance, trade, sustainability, or market access are analyzed in detail.
Chapter 4. Key Investment Pockets & Opportunity Analysis
- 4.1 High Content Screening Market Market Attractiveness Analysis
- 4.1.1 By Region – Investment Attractiveness Matrix (Volume × CAGR)
- 4.1.2 Product & Service – Investment Attractiveness Matrix
- 4.1.3 Instrument Type – Investment Attractiveness Matrix
- 4.1.4 Consumables & Accessories – Investment Attractiveness Matrix
- 4.1.5 Application – Investment Attractiveness Matrix
- 4.1.6 Drug Discovery & Development Application – Investment Attractiveness Matrix
- 4.1.7 Basic Research Application – Investment Attractiveness Matrix
- 4.1.8 End User – Investment Attractiveness Matrix
- 4.2 Absolute Revenue Growth Opportunity
- 4.2.1 By Region – Absolute USD Growth Through 2034
- 4.2.2 Product & Service – Absolute USD Growth
- 4.2.3 Instrument Type – Absolute USD Growth
- 4.2.4 Consumables & Accessories – Absolute USD Growth
- 4.2.5 Application – Absolute USD Growth
- 4.2.6 Drug Discovery & Development Application – Absolute USD Growth
- 4.2.7 Basic Research Application – Absolute USD Growth
- 4.2.8 End User – Absolute USD Growth
- 4.3 Incremental Volume Opportunity
- 4.3.1 By Region – Incremental Volume Through 2034
- 4.3.2 Product & Service – Incremental Volume
- 4.4 Emerging Submarket Opportunity Deep Dive (Subject to Applicability)
- 4.5 Emerging Market Opportunity Scorecards
- 4.5.1 United States
- 4.5.2 Europe
- 4.5.3 Asia
- 4.5.4 Middle East & Africa
Note: Emerging Market Opportunity Scorecards will be included based on relevance and strategic importance. Regions listed are indicative and may vary depending on data availability and market dynamics.
Chapter 5. High Content Screening Market Import-Export Analysis & Trade Flows
- 5.1 Global Trade Overview
- 5.1.1 Global Export Value by Country (2018-2025)
- 5.1.2 Global Export Volume by Country (2018-2025)
- 5.1.3 Global Import Value by Country (2018-2025)
- 5.1.4 Global Import Volume by Country (2018-2025)
- 5.1.5 Net Trade Balance by Country (2018-2025)
- 5.2 Export Analysis – Product & Service
- 5.2.1 Type 1 (HS Code)
- 5.2.2 Type 2 (HS Code)
- 5.2.3 Type 3 (HS Code)
- 5.2.4 Type 4 (HS Code)
- 5.2.5 Type 5 (HS Code)
- 5.3 Import Analysis – Product & Service
- 5.3.1 Type 1 (HS Code)
- 5.3.2 Type 2 (HS Code)
- 5.3.3 Type 3 (HS Code)
- 5.3.4 Type 4 (HS Code)
- 5.3.5 Type 5 (HS Code)
- 5.4 Average Unit Trade Prices
- 5.4.1 Average Export Price – Product & Service & Country
- 5.4.2 Average Import Price – Product & Service & Source Country
- 5.4.3 Price Trends (2018-2025)
- 5.5 Key Trade Route Analysis
- 5.5.1 Trade Route 1
- 5.5.2 Trade Route 2
- 5.5.3 Trade Route 3
- 5.5.4 Trade Route 4
- 5.5.5 Trade Route 5
- 5.6 Trade Policy Impact Assessment
- 5.6.1 US Anti-Dumping & Section 301 Tariffs
- 5.6.2 EU Customs Union Impact
- 5.6.3 Major Free Trade Agreements
- 5.6.4 USMCA Rules of Origin
Note: Trade policy analysis will be included only where relevant to the High Content Screening Market market.
Chapter 6. Competitive Landscape & Company Benchmarking
- 6.1 High Content Screening Market Market Concentration & Structure
- 6.1.1 Herfindahl-Hirschman Index (HHI) – 2018 vs. 2025
- 6.1.2 Tier 1, Tier 2 & Tier 3 Market Structure
- 6.1.3 Global, Regional & Local Player Dynamics
- 6.2 High Content Screening Market Market Share Analysis – 2025
- 6.2.1 Global Revenue Share by Company
- 6.2.2 Global Volume Share by Company
- 6.2.3 Regional Revenue Share
- 6.2.4 Market Share Evolution (2018 vs. 2025)
- 6.2.5 OEM Segment Share by Company
- 6.2.6 Replacement Segment Share by Company
- 6.3 Production/Delivery Capacity & Facility Analysis
- 6.3.1 Global Installed Capacity
- 6.3.2 Capacity Utilization Rates
- 6.3.3 Production/Output Volume
- 6.3.4 Facility Locations & Capacity Map
- 6.3.5 Planned Capacity Additions
- 6.4 High Content Screening Market Competitive Benchmarking Matrix
- 6.4.1 Revenue, Volume, CAGR & Profitability Comparison
- 6.4.2 Channel Revenue Mix
- 6.4.3 Geographic Revenue Exposure
- 6.4.4 R&D Intensity
- 6.4.5 Sustainability Maturity
- 6.5 Strategic Developments in High Content Screening Market (Last 24 Months)
- 6.5.1 Mergers, Acquisitions & Divestments
- 6.5.2 New High Content Screening Market Launches
- 6.5.3 Facility Expansions
- 6.5.4 Strategic Alliances, Joint Ventures & Partnerships
- 6.5.5 Distribution Expansion & Market Entry
- 6.5.6 Sustainability & ESG Initiatives
- 6.6 Competitive Strategy Mapping
- 6.6.1 Leader, Challenger, Follower & Niche Classification
- 6.6.2 Pricing Strategy Comparison
- 6.6.3 Channel Strategy Matrix
Note: Strategic developments are included based on their materiality and the availability of reliable information.
Chapter 7. Global High Content Screening Market Market – Product & Service
- 7.1 Segment Overview
- 7.1.1 Market Volume Share (2018, 2025 & 2026)
- 7.1.2 Market Revenue Share (2018, 2025 & 2026)
- 7.1.3 Market Forecast Through 2034
- 7.1.4 Key Growth Drivers & Restraints
- 7.1.5 Leading Brands
- 7.2 Types Covered – Product & Service
- Instruments
- Consumables & Accessories
- Software
- Services
Chapter 8. Global High Content Screening Market Market – Instrument Type
- 8.1 Segment Overview
- 8.1.1 Market Volume Share (2018, 2025 & 2026)
- 8.1.2 Market Revenue Share (2018, 2025 & 2026)
- 8.1.3 Market Forecast Through 2034
- 8.1.4 Key Growth Drivers & Restraints
- 8.1.5 Leading Brands
- 8.2 Types Covered – Instrument Type
- High Content Imaging Platforms
- Cell Detection and Analysis Systems
- Cell Imaging Systems
Chapter 9. Global High Content Screening Market Market – Consumables & Accessories
- 9.1 Segment Overview
- 9.1.1 Market Volume Share (2018, 2025 & 2026)
- 9.1.2 Market Revenue Share (2018, 2025 & 2026)
- 9.1.3 Market Forecast Through 2034
- 9.1.4 Key Growth Drivers & Restraints
- 9.1.5 Leading Brands
- 9.2 Types Covered – Consumables & Accessories
- Reagents & Assay Kits
- Microplates
- Cell Culture Accessories
- Microscopy Accessories
- Plate Sealers
Chapter 10. Global High Content Screening Market Market – Application
- 10.1 Segment Overview
- 10.1.1 Market Volume Share (2018, 2025 & 2026)
- 10.1.2 Market Revenue Share (2018, 2025 & 2026)
- 10.1.3 Market Forecast Through 2034
- 10.1.4 Key Growth Drivers & Restraints
- 10.1.5 Leading Brands
- 10.2 Types Covered – Application
- Drug Discovery & Development
- Toxicology
- Basic Research
Chapter 11. Global High Content Screening Market Market – Drug Discovery & Development Application
- 11.1 Segment Overview
- 11.1.1 Market Volume Share (2018, 2025 & 2026)
- 11.1.2 Market Revenue Share (2018, 2025 & 2026)
- 11.1.3 Market Forecast Through 2034
- 11.1.4 Key Growth Drivers & Restraints
- 11.1.5 Leading Brands
- 11.2 Types Covered – Drug Discovery & Development Application
- Primary & Secondary Screening
- Target Identification & Validation
- Compound Profiling
- Other Drug Discovery & Development Applications
Chapter 12. Global High Content Screening Market Market – Basic Research Application
- 12.1 Segment Overview
- 12.1.1 Market Volume Share (2018, 2025 & 2026)
- 12.1.2 Market Revenue Share (2018, 2025 & 2026)
- 12.1.3 Market Forecast Through 2034
- 12.1.4 Key Growth Drivers & Restraints
- 12.1.5 Leading Brands
- 12.2 Types Covered – Basic Research Application
- Cancer Cell Line Screening
- Epigenetics
- Gene Expression Analysis
- Stem Cell Research
Chapter 13. Global High Content Screening Market Market – End User
- 13.1 Segment Overview
- 13.1.1 Market Volume Share (2018, 2025 & 2026)
- 13.1.2 Market Revenue Share (2018, 2025 & 2026)
- 13.1.3 Market Forecast Through 2034
- 13.1.4 Key Growth Drivers & Restraints
- 13.1.5 Leading Brands
- 13.2 Types Covered – End User
- Pharmaceutical & Biotechnology Companies
- Academic & Government Institutes
- CROs & CDMOs
Chapter 14. Global High Content Screening Market Market – By Distribution Channel
- 14.1 Segment Overview
- 14.1.1 Volume & Revenue Split by Channel (2025 & 2034)
- 14.1.2 Channel Mix Evolution (2018-2034)
Chapter 15. Regional Market Analysis – Global Overview
- 15.1 Global Regional Overview
- 15.1.1 Regional Volume Share
- 15.1.2 Regional Revenue Share
- 15.1.3 Regional Volume by Region
- 15.1.4 Regional Revenue by Region
- 15.1.5 Regional Forecast Through 2034
- 15.2 Cross-Regional Segment Analysis
- 15.2.1 Product & Service
- 15.2.2 Instrument Type
- 15.2.3 Consumables & Accessories
- 15.2.4 Application
- 15.2.5 Drug Discovery & Development Application
- 15.2.6 Basic Research Application
- 15.2.7 End User
- 15.2.8 By Distribution Channel
- 15.2.9 By Brand/Price Tier
Chapter 16. North America High Content Screening Market Market
- 16.1 United States
- 16.2 Canada
- 16.3 Mexico
Chapter 17. Europe High Content Screening Market Market
- 17.1 Germany
- 17.2 France
- 17.3 Italy
- 17.4 United Kingdom
- 17.5 Spain
- 17.6 Poland
- 17.7 Russia
- 17.8 Netherlands
- 17.9 Belgium
- 17.10 Sweden
- 17.11 Denmark
- 17.12 Norway
- 17.13 Rest of Europe
Chapter 18. Asia Pacific High Content Screening Market Market
- 18.1 China
- 18.2 India
- 18.3 Japan
- 18.4 South Korea
- 18.5 Thailand
- 18.6 Indonesia
- 18.7 Vietnam
- 18.8 Malaysia
- 18.9 Australia
- 18.10 Rest of Asia Pacific
Chapter 19. Latin America High Content Screening Market Market
- 19.1 Brazil
- 19.2 Argentina
- 19.3 Colombia
- 19.4 Chile
- 19.5 Rest of Latin America
Chapter 20. Middle East High Content Screening Market Market
- 20.1 Saudi Arabia
- 20.2 United Arab Emirates
- 20.3 Turkey
- 20.4 Israel
- 20.5 Iran
- 20.6 Rest of the Middle East
Chapter 21. Africa High Content Screening Market Market
- 21.1 South Africa
- 21.2 Egypt
- 21.3 Nigeria
- 21.4 Morocco
- 21.5 Rest of Africa
Chapter 22. High Content Screening Market Company Profiles
- 22.1 "Thermo Fisher Scientific Inc.
- 22.1.1 Company Overview
- 22.1.2 Key Management Personnel
- 22.1.3 Products & Services Portfolio
- 22.1.4 Financial Performance
- 22.1.5 Key Market Focus & Geographic Presence
- 22.1.6 Recent Developments & Strategic Initiatives
- 22.2 Danaher Corporation
- 22.3 Revvity Inc.
- 22.4 Merck KGaA
- 22.5 Becton
- 22.6 Dickinson and Company
- 22.7 Sartorius AG
- 22.8 Yokogawa Electric Corporation
- 22.9 Agilent Technologies Inc.
- 22.10 Bio-Rad Laboratories Inc.
- 22.11 Bruker Corporation
- 22.12 Tecan Group Ltd.
- 22.13 Corning Incorporated
- 22.14 Evident Corporation
- 22.15 Nikon Corporation
- 22.16 Carl Zeiss AG and Molecular Devices LLC."
Note: The company profile list is preliminary and may change based on research findings, market developments, data availability, and client requirements.
Chapter 23. Appendices
- Appendix A – List of Abbreviations & Acronyms
- Appendix B – Industry Classification Code Reference – Full Series
- Appendix C – Production & Capacity Data Tables
- Appendix D – End-Use & Demand Base Tables
- Appendix E – Consumption & Replacement Rate Assumptions
- Appendix F – ASP Reference Tables
- Appendix G – Manufacturing & Facility Database
- Appendix H – Import-Export Data Tables
- Appendix I – Regulatory Summary Tables
- Appendix J – Primary Research Participant List (Anonymized)
- Appendix K – Primary Research Questionnaire Framework
- Appendix L – Data Sources & Bibliography
- Appendix M – Market Size Divergence & Source Comparison
Chapter 24. Research Methodology
- 24.1 Research Framework & Philosophy
- 24.2 Secondary Research – Sources, Hierarchy & Data Extraction
- 24.3 Data Modeling – Bottom-Up & Top-Down Market Sizing
- 24.4 Primary Research – Stakeholder Framework, LOI & Sample Sizes
- 24.5 Forecast Methodology – Regression, Scenario & Sensitivity Analysis
- 24.6 Quality Control – Four-Layer Validation Framework
- 24.7 Limitations & Standard Assumptions
- 24.8 Disclaimer
