
Market Overview
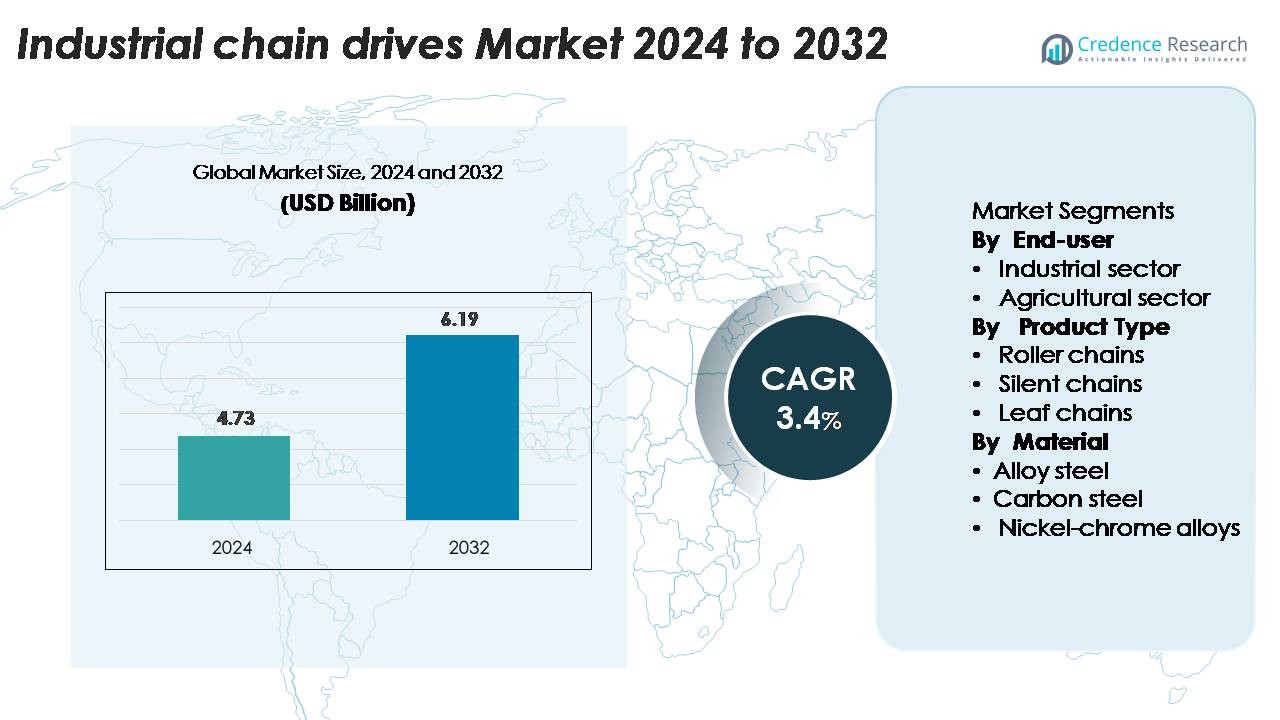
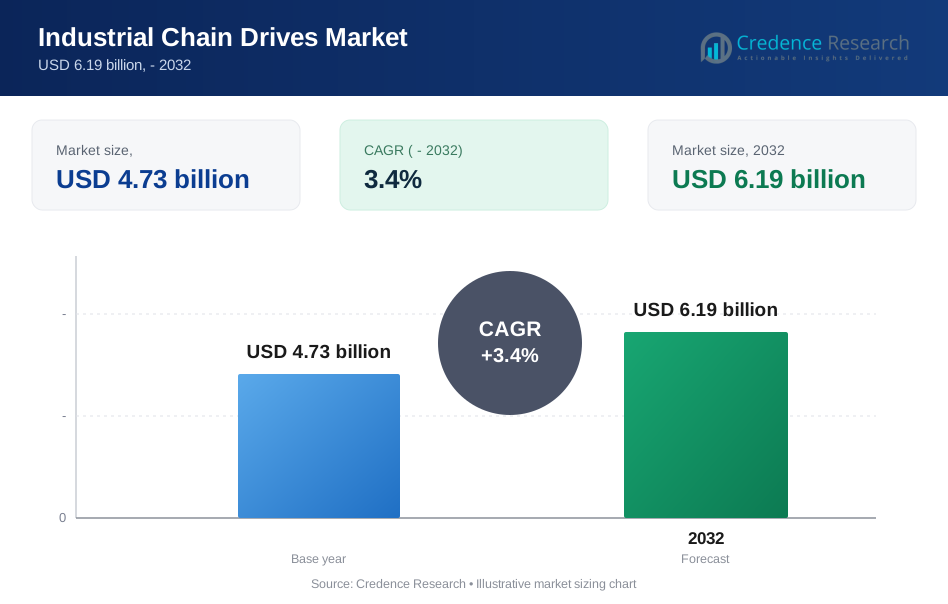
Industrial chain drives market size was valued at USD 4.73 billion in 2024 and is anticipated to reach USD 6.19 billion by 2032, at a CAGR of 3.4% during the forecast period.
| REPORT ATTRIBUTE | DETAILS |
|---|---|
| Historical Period | 2020-2023 |
| Base Year | 2024 |
| Forecast Period | 2025-2032 |
| Industrial Chain Drives Market Size 2024 | USD 4.73 Billion |
| Industrial Chain Drives Market, CAGR | 3.4% |
| Industrial Chain Drives Market Size 2032 | USD 6.19 Billion |
The Industrial Chain Drives Market is shaped by strong competition among leading players such as Tsubakimoto Chain Co., Renold PLC, Rexnord Corporation, Iwis, Timken Company, SKF Group, KettenWulf, Diamond Chain Company, Regina Catene Calibrate S.p.A., and Donghua Chain Group. These companies focus on high-strength roller chains, corrosion-resistant alloys, and optimized designs for heavy-load applications across automotive, mining, packaging, and logistics. Asia-Pacific leads the market with a 35% share, driven by large manufacturing clusters and rapid automation. North America holds 32%, supported by strong industrial upgrades, while Europe captures 28%, backed by advanced engineering and precision machinery production.
Market Insights
- The Industrial Chain Drives Market was valued at USD 6.1 billion in 2024 and is projected to reach USD 10.3 billion by 2032, growing at a CAGR of 6.5% during the forecast period.
- Strong demand from the industrial end-user segment, which holds the largest share, drives market expansion as factories depend on heavy-duty roller chains for reliable power transmission and reduced downtime.
- The market shows rising trends in noise-optimized chains, corrosion-resistant alloys, and high-speed conveyor chains, supported by increased automation across automotive and packaging industries.
- Competitive activity intensifies as key players such as Tsubakimoto, Renold, Rexnord, Iwis, Regina, Diamond Chain Company, and Donghua invest in high-durability chain designs, longer service life materials, and precision engineering to strengthen global presence.
- Asia-Pacific leads with 35%, followed by North America at 32% and Europe at 28%, reflecting strong manufacturing clusters, advanced industrial upgrades, and steady adoption in automotive, mining, and food processing sectors.
Market Segmentation Analysis:
By End-user
The industrial sector holds the dominant share in the end-user segment because factories rely on chain drives for continuous and heavy mechanical operations. High adoption in automotive, mining, packaging, and food processing boosts demand for strong and efficient systems. Growing automation in APAC plants increases usage as companies seek reliable power transmission with lower downtime and stable performance.
- For instance, Tsubakimoto Chain Co.’s “Low Noise Roller Chain” uses uniquely structured spring rollers and delivers a noise-level reduction of 6-8 dB versus its standard RS Roller Chain, while operating up to speeds of 200 m/min and temperatures from −10°C to 60°C.
By Product Type
The roller chains segment leads the product category due to its wide use across conveyors, engines, and heavy machinery. These chains support high loads and offer long service life, which makes them suitable for tough industrial settings. Rising investment in automated manufacturing drives demand because roller chains ensure stable and precise motion control.
- For instance, Renold’s Synergy Roller Chain demonstrated a proven wear life exceeding 21,000 hours in controlled endurance testing, while maintaining tensile strengths above 1,000 MPa due to its precision-engineered, triple-surface-hardened pins.
By Material
The alloy steel segment dominates the material category as industries prefer strong and wear-resistant components for harsh environments. This material performs well under heavy loads in mining, construction, and metal processing. Demand grows because companies seek materials that reduce maintenance frequency while improving durability and system efficiency.
Key Growth Drivers
Rising Automation Across Manufacturing Plants
Growing automation in factories drives strong demand for industrial chain drives. Modern plants use advanced machines that need reliable power transmission for smooth output. Chain drives support heavy loads and run well in tough environments, so manufacturers prefer them. APAC plants expand fast, and automation levels rise each year. This shift increases the use of conveyors, robotic lines, and high-speed machinery. These systems depend on stable chain drive performance. Many industries upgrade older machines to reduce downtime and lower repair costs. Chain drives help meet these goals with long service life and strong design. Companies also invest in efficient components to improve plant productivity. This trend lifts adoption across automotive, metals, food, and packaging units.
· For instance, Tsubaki’s high-performance G8 Series roller chain (ANSI standard) uses solid bush construction with their patented Lube Groove technology. The minimum tensile strength (breaking load) for a single-strand size RS80-1 chain is specified by the company at a high 71.6 kN (compared to the ANSI standard minimum of 55.6 kN), providing stable power transmission for demanding automated equipment.
Expansion of Heavy Industrial Activities
Heavy industries create strong demand because they rely on chain drives for continuous operation. Mining, steel, cement, and oil industries run machines that require stable mechanical power flow. Chain drives perform well under shock loads and extreme temperatures. This makes them ideal for high-stress industrial work. Growing infrastructure projects in APAC and Africa support more mining and metal processing activity. These industries increase spending on robust equipment to handle output growth. Many companies also want machines with low maintenance needs. Chain drives meet this need well. Their durable design protects machinery and cuts breakdowns. This supports higher use across harsh operating sites.
· For instance, Donghua offers Heavy Duty (HSP series) Chains for demanding industrial applications that achieve an ultimate tensile strength up to 50% higher than the standard DIN/ISO requirements by adopting an integrated optimum design of structural dimensions, parts material, and heat treatment process.
Growth in Agricultural Mechanization
Farms across major countries are shifting toward mechanized operations. This creates rising demand for compact and strong chain drives. Modern farming machines, including harvesters, seeders, and balers, rely on chain systems for stable movement. Rural electrification and farm income support mechanized tools. This increases use of reliable chain components. Many farmers also shift from manual work to powered tools for better yield. Agricultural equipment makers choose chain drives because these systems handle dirt, vibration, and long working hours. This reliability helps farmers reduce repair costs. Growth in large farming operations, especially in APAC, strengthens demand.
Key Trends & Opportunities
Demand for High-Strength and Corrosion-Resistant Materials
A strong trend involves the use of advanced materials in chain drive systems. Manufacturers design chains with high-strength alloys that handle heat and moisture better. These materials improve durability in demanding plants. Industries like food processing, chemicals, and marine operations need corrosion-resistant solutions. This shift creates opportunities for suppliers offering advanced alloy steel and nickel-chrome chains. Many companies seek longer product life to reduce maintenance. This increases interest in premium materials. Growing environmental rules also push companies to adopt cleaner and stronger chain solutions. This trend opens room for innovation.
- For instance, according to typical industry specifications for stainless steel roller chains that meet DIN 8187 / ISO 606 standards (which includes Regina's B-series), the minimum tensile strength for a 10B-1 size chain is approximately 14.7 kN. The chain material, SS304, is generally rated for operational stability at temperatures up to 400 °C (752 °F), a common high-temperature limit for this material
Rising Adoption of Predictive Maintenance Solutions
Digital tools support new opportunities for chain drive makers. Companies now use sensors and monitoring software to track chain performance in real time. Predictive maintenance helps reduce machine failure and improves plant uptime. This trend grows fast as plants expand automation. Chain drive makers respond by offering products that support easy inspection and monitoring. Many companies want chains that align well with digital tools. This creates a clear opportunity for smart-compatible mechanical components. These innovations help users plan service better and avoid sudden breakdowns. This demand is strong in automotive and heavy industries.
- For instance, SKF's Enlight Collect IMx-1 wireless vibration and temperature monitoring sensor operates with a selectable maximum frequency of up to 10 kHz and provides periodic condition data for rotating equipment for up to four years on a single battery, as documented in SKF’s product specification sheet.
Key Challenges
High Maintenance and Lubrication Costs
Maintenance remains a major challenge for chain drive users. Chains require frequent lubrication and tension checks. This increases downtime and cost, especially in large factories. Harsh environments also speed up wear. Plants must replace components sooner if systems are not maintained well. Many companies want low-maintenance solutions but face limited options. Lubrication systems need skilled workers, which adds more cost. High maintenance needs push some users toward belts or gear drives in light applications. This challenge affects adoption in cost-sensitive sectors and small industries. Reducing service cost remains a key concern.
Competition from Alternative Power Transmission Systems
Chain drives face strong competition from belts, gear drives, and electric systems. Some industries choose belts because they run quieter and need less maintenance. Gear systems offer high precision in advanced machinery. Electric drives support clean and efficient power transfer. These alternatives attract users in modern plants. Companies that want low vibration and noise often shift away from chain drives. This limits growth in several sectors. Chain drive makers must improve technology to remain competitive. They also need to focus on material upgrades and design improvements. The challenge remains significant in fast-evolving industries.
Regional Analysis
North America
North America holds a 32% market share due to strong adoption of automated manufacturing systems across automotive, logistics, and metal processing plants. The region benefits from early integration of high-durability roller chains, corrosion-resistant components, and smart monitoring systems that support predictive maintenance. Demand rises as U.S. and Canadian factories upgrade power-transmission assemblies to improve uptime and reduce operational delays. Growth in food and beverage facilities also strengthens replacements for stainless-steel chain solutions. Ongoing reshoring of industrial production increases procurement of heavy-duty chain drives for high-load, continuous-operation environments.
Europe
Europe accounts for a 28% market share, supported by its advanced engineering base and strong presence of machinery makers. Germany, Italy, and France rely heavily on precision chain drives in packaging, automotive, and petrochemical applications. Adoption grows as EU manufacturers shift toward energy-efficient operations and noise-optimized chain systems for faster production lines. Stringent regulatory standards also push industries to choose high-grade alloy-steel chains with extended service life. Demand increases in robotic assembly and conveyor systems, where consistent load handling and stable motion control are critical to plant productivity.
Asia-Pacific
Asia-Pacific leads with a 35% market share, driven by rapid industrialization, large-scale manufacturing clusters, and expanding construction and mining operations. China, Japan, South Korea, and India rely on heavy-duty roller chains and high-speed conveyor chains to support intense production schedules. Growing automation in APAC factories accelerates replacement cycles for precision-engineered chain systems. Local suppliers expand output of corrosion-resistant chains to meet rising demand from electronics, automotive, and steel processing industries. Continuous investment in smart factories strengthens adoption of advanced chain designs that handle high loads with reduced wear.
Latin America
Latin America holds a 3% market share, influenced by moderate industrial growth and increasing modernization of material-handling facilities. Brazil and Mexico remain the main buyers due to strong automotive and food processing activities. Mining operations in Chile and Peru also contribute to demand for heavy-load industrial chains. Companies adopt rugged carbon-steel and alloy-steel chains to maintain stable performance in harsh environments. Upgrades in packaging lines and agro-processing plants further support procurement of reliable power-transmission components. Market expansion continues as regional factories shift toward automated and semi-automated production setups.
Middle East & Africa
The Middle East & Africa region accounts for a 2% market share, driven by the expansion of oil & gas, mining, and cement industries. Gulf nations invest in high-resilience chain drives to support continuous operations in extreme temperatures and abrasive conditions. South Africa’s mining sector adds demand for heavy-duty, wear-resistant chain systems. Industrial diversification projects in the UAE and Saudi Arabia strengthen adoption of conveyor and roller chains for logistics and material-handling infrastructure. Growth remains steady as manufacturers upgrade equipment to ensure longer service life and reduced maintenance downtime.
Market Segmentations:
By End-user
- Industrial sector
- Agricultural sector
By Product Type
- Roller chains
- Silent chains
- Leaf chains
By Material
- Alloy steel
- Carbon steel
- Nickel-chrome alloys
By Geography
- North America
- U.S.
- Canada
- Mexico
- Europe
- Germany
- France
- U.K.
- Italy
- Spain
- Rest of Europe
- Asia Pacific
- China
- Japan
- India
- South Korea
- South-east Asia
- Rest of Asia Pacific
- Latin America
- Brazil
- Argentina
- Rest of Latin America
- Middle East & Africa
- GCC Countries
- South Africa
- Rest of the Middle East and Africa
Competitive Landscape
The competitive landscape of the industrial chain drives market features a mix of global manufacturers and specialized regional suppliers that compete on product durability, material quality, and performance in high-load applications. Leading companies focus on developing advanced roller, silent, and leaf chain systems designed for heavy-duty industrial environments. Many players invest in high-strength alloy steel and corrosion-resistant materials to extend product life and reduce maintenance for end users. Automation growth pushes manufacturers to offer precision-engineered chain solutions compatible with modern machinery. Firms also expand distribution networks across APAC, North America, and Europe to strengthen market presence. Strategic partnerships with equipment makers, continuous upgrades in manufacturing processes, and targeted product innovations help companies maintain competitiveness.
Key Player Analysis
- Rexnord Corporation
- KettenWulf
- Timken Company
- Donghua Chain Group
- Regina Catene Calibrate S.p.A.
- Diamond Chain Company
- SKF Group
- Renold PLC
- Iwis
- Tsubakimoto Chain Co.
Recent Developments
- In March 2025, Timken Company announced a CEO transition with Tarak B. Mehta departing and Richard G. Kyle appointed interim President & CEO while a search for a permanent leader proceeds.
- In March 19, 2025 that Regal Rexnord Corporation (parent of Rexnord Corporation) it estimates an annualized tariff-cost impact of approximately USD 60 million and plans mitigation efforts.
Report Coverage
The research report offers an in-depth analysis based on End-User, Product type, Material and Geography. It details leading market players, providing an overview of their business, product offerings, investments, revenue streams, and key applications. Additionally, the report includes insights into the competitive environment, SWOT analysis, current market trends, as well as the primary drivers and constraints. Furthermore, it discusses various factors that have driven market expansion in recent years. The report also explores market dynamics, regulatory scenarios, and technological advancements that are shaping the industry. It assesses the impact of external factors and global economic changes on market growth. Lastly, it provides strategic recommendations for new entrants and established companies to navigate the complexities of the market.
Future Outlook
- Demand for industrial chain drives will rise as factories increase automation.
- APAC will remain the strongest growth region due to expanding industrial output.
- Roller chains will continue to dominate because of high load-handling capability.
- Use of advanced alloy materials will grow to improve durability and performance.
- Silent and precision chain systems will gain traction in low-noise applications.
- Adoption of predictive maintenance and monitoring tools will increase across plants.
- Manufacturers will focus on energy-efficient and low-maintenance chain designs.
- Agricultural mechanization will support steady demand in developing markets.
- Replacement demand will grow as industries upgrade aging mechanical systems.
- Partnerships and product innovation will help major players strengthen competitiveness.
Request a Free Sample
Fill in your details and we'll send you a free sample report.
- Sample data tables & charts
- Research methodology
Need a Custom Version of This Report?
Tailor the scope, geography, or segments to your exact requirements.
- Custom geography or segment scope
- Direct access to our analyst team
Frequently Asked Questions
What is the current market size for Industrial Chain Drives Market, and what is its projected size in 2032?
At what Compound Annual Growth Rate is the Industrial Chain Drives Market projected to grow between 2025 and 2032?
Which Industrial Chain Drives Market segment held the largest share in 2024?
What are the primary factors fueling the growth of the Industrial Chain Drives Market?
Who are the leading companies in the Industrial Chain Drives Market?
Which region commanded the largest share of the Industrial Chain Drives Market in 2024?
Table of Content
Chapter 1. Report Introduction
- 1.1 Report Description & Purpose
- 1.1.1 Report Title & Market Definition
- 1.1.2 Unique Selling Propositions (USP) & Key Differentiators
- 1.1.3 Value Proposition for Stakeholders
- 1.2 Research Objectives
- 1.2.1 Market Sizing Objectives (Volume & Revenue)
- 1.2.2 Segmentation Objectives
- 1.2.3 Competitive Intelligence Objectives
- 1.2.4 Forecast & Scenario Objectives
- 1.3 Report Scope
- 1.3.1 Industrial Chain Drives Scope – Types & Subtypes Covered
- 1.3.2 Geographic Scope – Regions & Countries Covered
- 1.3.3 Historical Period, Base Year & Forecast Period (the historical period; forecast to 2032)
- 1.3.4 Inclusions & Exclusions
- 1.4 HS Code & Classification Framework
- 1.5 Currency, Units & Pricing Basis
- 1.6 Target Stakeholders
- 1.7 Limitations & Assumptions
Chapter 2. Executive Summary
- 2.1 Global Industrial Chain Drives Market Snapshot
- 2.1.1 Market Size – Historical (the historical period) & Forecast (2032) (base year: USD 4.73 billion → 2032: USD 6.19 billion)
- 2.1.2 Volume & Revenue – Global Totals
- 2.1.3 Key Market Highlights – Top Five Facts
- 2.2 Industrial Chain Drives Market Segmentation Snapshot
- 2.2.1 Market Split by Region – vs. 2032
- 2.3 Competitive Snapshot
- 2.3.1 Top 10 Players by Revenue Share –
- 2.3.2 Top 10 Players by Volume Share –
- 2.3.3 Recent Strategic Developments (18-Month Summary)
- 2.4 Key Investment Highlights & Strategic Conclusions
Chapter 3. Industrial Chain Drives Market Dynamics & Industry Analysis
- 3.1 Market Overview & Context
- 3.1.1 Industrial Chain Drives Market Position in the Broader Automotive Value Chain
- 3.1.2 OEM vs. Replacement Market Dynamics
- 3.1.3 Market Maturity & Development Stage by Region
- 3.2 Industrial Chain Drives Market Drivers
- 3.3 Industrial Chain Drives Market Restraints & Challenges
- 3.4 Industrial Chain Drives Market Opportunities
- 3.5 Porter's Five Forces Analysis
- 3.5.1 Threat of New Entrants
- 3.5.2 Bargaining Power of Suppliers
- 3.5.3 Bargaining Power of Buyers
- 3.5.4 Threat of Substitutes
- 3.5.5 Competitive Rivalry – Intensity Assessment
- 3.6 Industrial Chain Drives Value Chain Analysis
- 3.6.1 Upstream – Raw Material/Input Suppliers
- 3.6.1.1 Raw Material/Input 1
- 3.6.1.2 Raw Material/Input 2
- 3.6.1.3 Raw Material/Input 3
- 3.6.2 Midstream – Production/Manufacturing/Service Delivery
- 3.6.2.1 Production/Process Overview
- 3.6.2.2 Key Facility Locations & Capacity by Manufacturer
- 3.6.3 Downstream – Distribution & End Consumer
- 3.6.3.1 Primary Channel – B2B/OEM
- 3.6.3.2 Secondary Channels – Dealer, Retail, Online, Direct
- 3.6.4 Value Chain Profitability Analysis
- 3.6.1 Upstream – Raw Material/Input Suppliers
- 3.7 PESTEL Analysis
- 3.7.1 Political Factors
- 3.7.2 Economic Factors
- 3.7.3 Social Factors
- 3.7.4 Technological Factors
- 3.7.5 Environmental Factors
- 3.7.6 Legal Factors
- 3.8 Industrial Chain Drives Supply Chain Analysis
- 3.8.1 Raw Material/Input Supply Risk Assessment
- 3.8.2 Manufacturing Concentration Risk (Geographic Exposure)
- 3.8.3 Trade Disruption Impact Analysis
- 3.9 Regulatory & Policy Landscape
Note: The regulatory and policy landscape section covers regulations based on their applicability to the market, Industrial Chain Drives category, geography, and scope of the study. Only regulatory frameworks with a material impact on operations, compliance, trade, sustainability, or market access are analyzed in detail.
Chapter 4. Key Investment Pockets & Opportunity Analysis
- 4.1 Industrial Chain Drives Market Attractiveness Analysis
- 4.1.1 By Region – Investment Attractiveness Matrix (Volume × CAGR)
- 4.2 Absolute Revenue Growth Opportunity
- 4.2.1 By Region – Absolute USD Growth Through 2032
- 4.3 Incremental Volume Opportunity
- 4.3.1 By Region – Incremental Volume Through 2032
- 4.3.2 Segment – Incremental Volume
- 4.4 Emerging Submarket Opportunity Deep Dive (Subject to Applicability)
- 4.5 Emerging Market Opportunity Scorecards
- 4.5.1 United States
- 4.5.2 Europe
- 4.5.3 Asia
- 4.5.4 Middle East & Africa
Note: Emerging Market Opportunity Scorecards will be included based on relevance and strategic importance. Regions listed are indicative and may vary depending on data availability and market dynamics.
Chapter 5. Industrial Chain Drives Import-Export Analysis & Trade Flows
- 5.1 Global Trade Overview
- 5.1.1 Global Export Value by Country (the historical period)
- 5.1.2 Global Export Volume by Country (the historical period)
- 5.1.3 Global Import Value by Country (the historical period)
- 5.1.4 Global Import Volume by Country (the historical period)
- 5.1.5 Net Trade Balance by Country (the historical period)
- 5.2 Export Analysis – Segment
- 5.2.1 Type 1 (HS Code)
- 5.2.2 Type 2 (HS Code)
- 5.2.3 Type 3 (HS Code)
- 5.2.4 Type 4 (HS Code)
- 5.2.5 Type 5 (HS Code)
- 5.3 Import Analysis – Segment
- 5.3.1 Type 1 (HS Code)
- 5.3.2 Type 2 (HS Code)
- 5.3.3 Type 3 (HS Code)
- 5.3.4 Type 4 (HS Code)
- 5.3.5 Type 5 (HS Code)
- 5.4 Average Unit Trade Prices
- 5.4.1 Average Export Price – Segment & Country
- 5.4.2 Average Import Price – Segment & Source Country
- 5.4.3 Price Trends (the historical period)
- 5.5 Key Trade Route Analysis
- 5.5.1 Trade Route 1
- 5.5.2 Trade Route 2
- 5.5.3 Trade Route 3
- 5.5.4 Trade Route 4
- 5.5.5 Trade Route 5
- 5.6 Trade Policy Impact Assessment
- 5.6.1 US Anti-Dumping & Section 301 Tariffs
- 5.6.2 EU Customs Union Impact
- 5.6.3 Major Free Trade Agreements
- 5.6.4 USMCA Rules of Origin
Note: Trade policy analysis will be included only where relevant to the Industrial Chain Drives market.
Chapter 6. Competitive Landscape & Company Benchmarking
- 6.1 Industrial Chain Drives Market Concentration & Structure
- 6.1.1 Herfindahl-Hirschman Index (HHI) – vs.
- 6.1.2 Tier 1, Tier 2 & Tier 3 Market Structure
- 6.1.3 Global, Regional & Local Player Dynamics
- 6.2 Industrial Chain Drives Market Share Analysis –
- 6.2.1 Global Revenue Share by Company
- 6.2.2 Global Volume Share by Company
- 6.2.3 Regional Revenue Share
- 6.2.4 Market Share Evolution ( vs. )
- 6.2.5 OEM Segment Share by Company
- 6.2.6 Replacement Segment Share by Company
- 6.3 Production/Delivery Capacity & Facility Analysis
- 6.3.1 Global Installed Capacity
- 6.3.2 Capacity Utilization Rates
- 6.3.3 Production/Output Volume
- 6.3.4 Facility Locations & Capacity Map
- 6.3.5 Planned Capacity Additions
- 6.4 Industrial Chain Drives Competitive Benchmarking Matrix
- 6.4.1 Revenue, Volume, CAGR & Profitability Comparison
- 6.4.2 Channel Revenue Mix
- 6.4.3 Geographic Revenue Exposure
- 6.4.4 R&D Intensity
- 6.4.5 Sustainability Maturity
- 6.5 Strategic Developments in Industrial Chain Drives (Last 24 Months)
- 6.5.1 Mergers, Acquisitions & Divestments
- 6.5.2 New Industrial Chain Drives Launches
- 6.5.3 Facility Expansions
- 6.5.4 Strategic Alliances, Joint Ventures & Partnerships
- 6.5.5 Distribution Expansion & Market Entry
- 6.5.6 Sustainability & ESG Initiatives
- 6.6 Competitive Strategy Mapping
- 6.6.1 Leader, Challenger, Follower & Niche Classification
- 6.6.2 Pricing Strategy Comparison
- 6.6.3 Channel Strategy Matrix
Note: Strategic developments are included based on their materiality and the availability of reliable information.
Chapter 7. Global Industrial Chain Drives Market – By Distribution Channel
- 7.1 Segment Overview
- 7.1.1 Volume & Revenue Split by Channel ( & 2032)
- 7.1.2 Channel Mix Evolution (2032)
Chapter 8. Regional Market Analysis – Global Overview
- 8.1 Global Regional Overview
- 8.1.1 Regional Volume Share
- 8.1.2 Regional Revenue Share
- 8.1.3 Regional Volume by Region
- 8.1.4 Regional Revenue by Region
- 8.1.5 Regional Forecast Through 2032
- 8.2 Cross-Regional Segment Analysis
- 8.2.1 By Distribution Channel
- 8.2.2 By Brand/Price Tier
Chapter 9. North America Industrial Chain Drives Market
- 9.1 United States
- 9.2 Canada
- 9.3 Mexico
Chapter 10. Europe Industrial Chain Drives Market
- 10.1 Germany
- 10.2 France
- 10.3 Italy
- 10.4 United Kingdom
- 10.5 Spain
- 10.6 Poland
- 10.7 Russia
- 10.8 Netherlands
- 10.9 Belgium
- 10.10 Sweden
- 10.11 Denmark
- 10.12 Norway
- 10.13 Rest of Europe
Chapter 11. Asia Pacific Industrial Chain Drives Market
- 11.1 China
- 11.2 India
- 11.3 Japan
- 11.4 South Korea
- 11.5 Thailand
- 11.6 Indonesia
- 11.7 Vietnam
- 11.8 Malaysia
- 11.9 Australia
- 11.10 Rest of Asia Pacific
Chapter 12. Latin America Industrial Chain Drives Market
- 12.1 Brazil
- 12.2 Argentina
- 12.3 Colombia
- 12.4 Chile
- 12.5 Rest of Latin America
Chapter 13. Middle East Industrial Chain Drives Market
- 13.1 Saudi Arabia
- 13.2 United Arab Emirates
- 13.3 Turkey
- 13.4 Israel
- 13.5 Iran
- 13.6 Rest of the Middle East
Chapter 14. Africa Industrial Chain Drives Market
- 14.1 South Africa
- 14.2 Egypt
- 14.3 Nigeria
- 14.4 Morocco
- 14.5 Rest of Africa
Chapter 15. Industrial Chain Drives Company Profiles
- 15.1 [Company 01]
- 15.1.1 Company Overview
- 15.1.2 Key Management Personnel
- 15.1.3 Products & Services Portfolio
- 15.1.4 Financial Performance
- 15.1.5 Key Market Focus & Geographic Presence
- 15.1.6 Recent Developments & Strategic Initiatives
Note: The company profile list is preliminary and may change based on research findings, market developments, data availability, and client requirements.
Chapter 16. Appendices
- Appendix A – List of Abbreviations & Acronyms
- Appendix B – Industry Classification Code Reference – Full Series
- Appendix C – Production & Capacity Data Tables
- Appendix D – End-Use & Demand Base Tables
- Appendix E – Consumption & Replacement Rate Assumptions
- Appendix F – ASP Reference Tables
- Appendix G – Manufacturing & Facility Database
- Appendix H – Import-Export Data Tables
- Appendix I – Regulatory Summary Tables
- Appendix J – Primary Research Participant List (Anonymized)
- Appendix K – Primary Research Questionnaire Framework
- Appendix L – Data Sources & Bibliography
- Appendix M – Market Size Divergence & Source Comparison
Chapter 17. Research Methodology
- 17.1 Research Framework & Philosophy
- 17.2 Secondary Research – Sources, Hierarchy & Data Extraction
- 17.3 Data Modeling – Bottom-Up & Top-Down Market Sizing
- 17.4 Primary Research – Stakeholder Framework, LOI & Sample Sizes
- 17.5 Forecast Methodology – Regression, Scenario & Sensitivity Analysis
- 17.6 Quality Control – Four-Layer Validation Framework
- 17.7 Limitations & Standard Assumptions
- 17.8 Disclaimer
