
Market Overview:
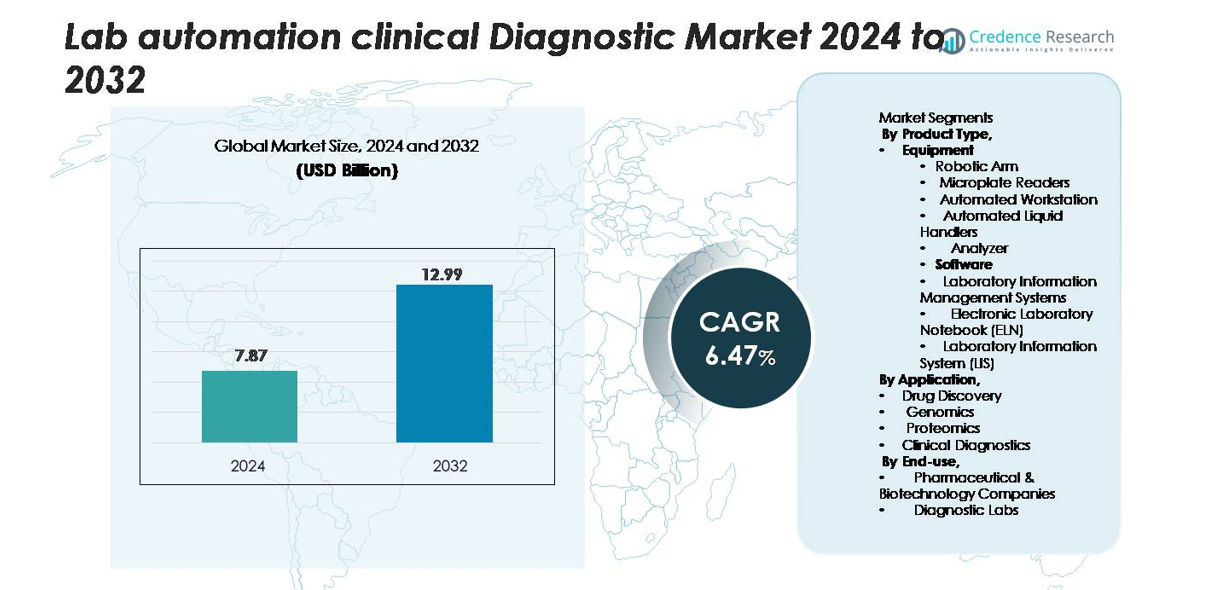
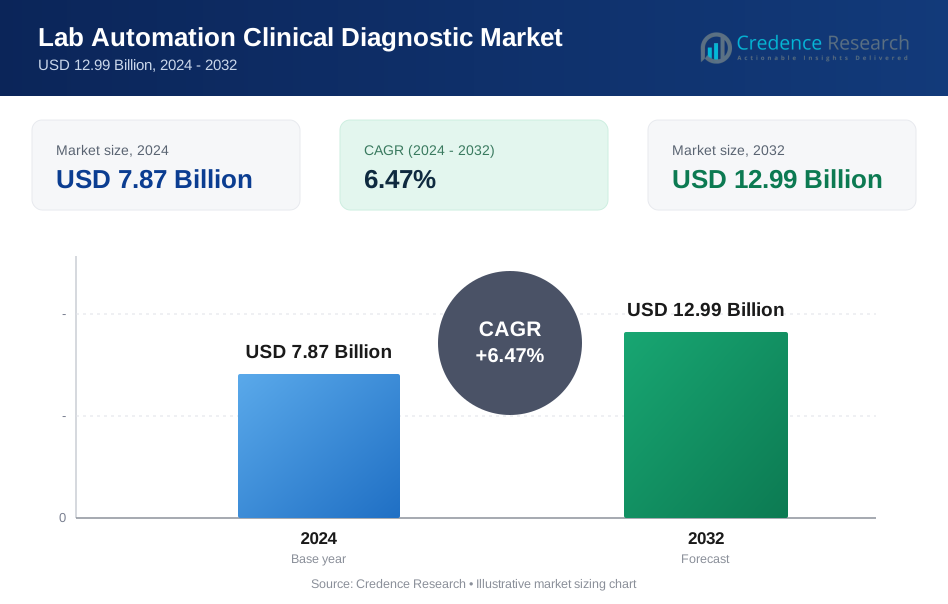
Lab Automation in Clinical Diagnostics market size was valued at USD 7.87 Billion in 2024 and is anticipated to reach USD 12.99 Billion by 2032, at a CAGR of 6.47% during the forecast period.
| REPORT ATTRIBUTE | DETAILS |
|---|---|
| Historical Period | 2020-2023 |
| Base Year | 2024 |
| Forecast Period | 2025-2032 |
| Lab Automation Clinical Diagnostic Market Size 2024 | USD 7.87 Billion |
| Lab Automation Clinical Diagnostic Market, CAGR | 6.47% |
| Lab Automation Clinical Diagnostic Market Size 2032 | USD 12.99 Billion |
The Lab Automation in Clinical Diagnostics market includes major players such as Roche Diagnostics, Siemens Healthineers, Beckman Coulter, Abbott Laboratories, Thermo Fisher Scientific, and Agilent Technologies. These companies compete through advanced robotic sample processors, modular analyzers, automated liquid handling systems, and AI-enabled workflow software. Strategic partnerships with diagnostic chains and hospitals support product adoption, while continuous upgrades in LIMS and ELN platforms enhance interoperability and data accuracy. North America leads the global market with 38% share, supported by strong laboratory infrastructure and high automation spending. Europe follows with 28% share, driven by strict clinical quality standards and rising demand for molecular diagnostics across central laboratories and university hospitals.
Market Insights
- The Lab Automation in Clinical Diagnostics market reached USD 7.87 Billion in 2024 and will hit USD 12.99 Billion by 2032 at a 6.47% CAGR, supported by rising investments in automated analyzers, LIMS platforms, and robotic liquid handling systems.
- Automation adoption grows due to high test volumes, shortage of skilled laboratory staff, and rising demand for faster, error-free clinical reporting across hematology, microbiology, and molecular diagnostics.
- Key trends include AI-enabled sample tracking, modular automation lines, cloud-connected data systems, digital pathology integration, and full workflow interoperability between analyzers and LIMS platforms.
- Global competition involves Roche Diagnostics, Siemens Healthineers, Abbott, Thermo Fisher, and Beckman Coulter, with each company expanding AI-driven automation portfolios, software partnerships, and automated liquid handling systems for high-throughput labs.
- North America holds 38% share, Europe accounts for 28%, Asia-Pacific has 23%, and diagnostic laboratories represent the dominant end-use segment. Equipment remains the largest product category, led by automated liquid handlers.
Market Segmentation Analysis:
By Product Type
Equipment holds the leading share in the Lab Automation in Clinical Diagnostics market due to the high adoption of robotic arms, automated workstations, and liquid handlers that increase testing speed and accuracy. Automated liquid handlers account for the dominant sub-segment, capturing the largest share as laboratories prefer precise, contamination-free sample processing. Microplate readers and analyzers support high-throughput screening, enabling faster clinical decisions. Software solutions such as LIMS and ELN continue to grow, but hardware demand remains higher because hospitals and diagnostic centers prioritize automation systems that reduce manual intervention and operational errors.
- For instance, Hamilton's Microlab STAR liquid handling platform supports up to 384-channel pipetting and can process up to 384 samples in a single automated run (when using a 384-well plate with the 384-channel head) with sub-microliter minimum volumes documented at 0.1 µL using the CO-RE 384 MultiProbe Head. This automation significantly reduces human error in clinical workflows.
By Application
Clinical diagnostics represents the largest application segment, accounting for the highest market share as healthcare systems move toward automated sample handling, real-time reporting, and reduced turnaround time. Automation technologies assist in managing surging test volumes in microbiology, hematology, immunoassay, and molecular diagnostics. Drug discovery, genomics, and proteomics are expanding due to increasing R&D investments and personalized medicine initiatives. Laboratories adopt robotics and integrated analyzers to support precision-based workflows, ensuring reproducibility and improved productivity. However, clinical diagnostics continues to dominate because of routine sample load, increased disease surveillance, and demand for high-speed analysis.
- For instance, Roche’s cobas® 8800 system can deliver up to 960 PCR test results in an 8-hour shift and process 96 samples every 30 minutes, enabling high-volume infectious disease testing with minimal operator contact.
By End-use
Diagnostic laboratories hold the dominant share in this market, driven by rising test volumes, workforce shortages, and the need for error-free workflows. These centers invest in automated liquid handlers, modular workstations, and LIMS platforms to handle thousands of daily samples. Pharmaceutical and biotechnology companies follow as strong adopters, using automation for drug screening, quality control, and biomarker analysis. Research and academic institutes are increasing adoption for genomics and proteomics studies. Yet diagnostic labs retain leadership, as automation enables cost-efficient operations, faster reporting, and standardized clinical outcomes.
Key Growth Drivers
Rising Demand for High-Throughput Testing and Faster Turnaround
Clinical diagnostic laboratories face pressure to process large sample volumes with faster results, driven by infectious disease surveillance, chronic illness monitoring, and routine screening. Manual workflows slow down reporting and increase the risk of human error. Lab automation delivers high-throughput processing, standardized sample handling, and real-time reporting, enabling laboratories to meet strict service-level expectations. Automated liquid handlers, robotic arms, and modular analyzers support bulk specimen testing with minimal intervention. Hospitals and private diagnostic chains adopt automation to reduce bottlenecks in hematology, molecular testing, microbiology, and immunoassay workflows. Faster turnaround helps physicians make quicker clinical decisions, improves patient outcomes, and strengthens operational efficiency. The shift toward high-volume auto-analysis also reduces labor costs and minimizes contamination risk. As healthcare providers expand diagnostic capacity, demand for scalable automation platforms continues to grow, reinforcing this driver.
- For instance, Roche’s cobas® 8800 molecular system can generate up to 960 test results in an 8-hour shift and run continuously for 24 hours with fully automated sample loading and de-capping, ensuring rapid turnaround without operator intervention. Automated liquid handlers, robotic arms, and modular analyzers support bulk specimen testing with minimal manual handling
Labor Shortages and the Need for Error-Free Sample Processing
Healthcare systems face a global shortage of trained laboratory technicians and pathologists. This gap expands as testing volumes grow, leaving laboratories vulnerable to backlogs, delayed reporting, and overworked staff. Automation supports consistent, round-the-clock operations without fatigue-related errors. Automated liquid handlers, barcode-based specimen tracking, and smart analyzers improve precision in sample preparation, aliquoting, and reporting. This reduces risk of sample mix-ups, data loss, or manual pipetting errors. Diagnostic chains adopt integrated workstations and LIMS platforms to maintain compliance with regulatory standards and traceability requirements. Error-free processing is critical in infectious disease testing, genetic screening, oncology diagnostics, and blood banking. With automation, smaller laboratories can deliver standardized performance comparable to advanced centers. Workforce shortages, paired with rising test complexity, make automation a long-term operational necessity, not a luxury purchase, sustaining market expansion.
- For instance, Beckman Coulter's high-volume DxA 5000 automation system is documented to process up to 1,200 specimens per hour, featuring fully automated centrifugation, decapping, aliquoting, and sorting.
Growth of Molecular Diagnostics and Personalized Medicine
Advancements in molecular diagnostics, genomics, and liquid biopsy create demand for precise, repeatable sample handling beyond manual capabilities. PCR-based testing, sequencing workflows, and multiplex assays require accuracy at microliter scale, pushing laboratories toward automated systems. Automated platforms reduce cross-contamination risk, improve yield consistency, and support complex workflows such as nucleic acid extraction, amplification, and plate management. Personalized medicine initiatives increase demand for molecular profiling, cancer biomarker testing, pharmacogenomics, and genetic screening. Pharmaceutical companies and research institutions also adopt automation to accelerate biomarker discovery and drug screening cycles. Post-pandemic healthcare infrastructure upgrades further strengthen adoption of high-throughput molecular diagnostic systems. As precision-based diagnostics expand from research to routine clinical use, automation becomes critical for scaling these technologies with clinical reliability and cost efficiency.
Key Trends & Opportunities
Integration of AI, Machine Learning, and Data-Driven Workflow Management
Laboratories increasingly deploy AI-enabled analytical tools for anomaly detection, automated quality checks, and predictive maintenance. Machine learning algorithms support interpretation of imaging results, real-time decision support, and automated result validation. This reduces reliance on manual review and speeds up reporting. Automated systems also generate large data volumes, creating demand for analytics platforms that visualize workflow performance, reagent usage, and instrument health. Predictive analytics lowers downtime, while AI-based scheduling improves resource utilization. Manufacturers are integrating cloud-connected LIMS and ELN platforms to enable remote monitoring, multi-site data sharing, and digital audit trails. These capabilities create opportunities for software vendors and diagnostic device suppliers to bundle hardware with AI-enhanced analytics and subscription-based platforms. As hospitals embrace digital pathology and smart diagnostics, AI-driven automation becomes a core trend shaping future laboratory infrastructure.
- For instance, Roche's NAVIFY® Diagnostics uses machine-learning triage to improve efficiency and reduce manual review time within the digital pathology workflow. Automated systems also generate large data volumes, creating demand for analytics platforms—such as Roche's NAVIFY Analytics for Pathology Lab—that visualize workflow performance, reagent usage, and instrument health to help laboratories identify bottlenecks and optimize operations.
Shift Toward Fully Connected and Modular Automation Systems
A major trend is the transition from standalone instruments to fully connected modular automation lines that manage entire workflows—from sample receipt to final reporting. Modular systems allow labs to scale capacity without replacing full infrastructure, which appeals to mid-sized diagnostic centers. Connectivity between robots, analyzers, and data systems eliminates manual handoffs and reduces contamination risk. Vendors introduce plug-and-play modules for sample sorting, decapping, centrifugation, aliquoting, and storage. Cloud-enabled dashboards support centralized monitoring across multi-location networks. This trend opens new opportunities for automation suppliers offering tailored solutions for labs with varying budgets and volumes. Growth of networked diagnostic chains and public health testing programs accelerates adoption of integrated automation ecosystems.
- For instance, Beckman Coulter’s DxA 5000 Fit connects decapping, aliquoting, centrifugation, and sorting into a single modular track that processes up to 300 samples per hour and automatically rejects compromised tubes using an onboard vision system with millisecond scanning speed.
Expanding Automation in Emerging Markets
Emerging economies increase investments in diagnostic infrastructure, backed by government funding, private healthcare expansion, and rising chronic disease testing. Many countries are shifting from manual pathology rooms to semi-automated and fully automated labs. Lower equipment costs, leasing options, and vendor-supported installation services accelerate market entry. Multinational diagnostic chains and tele-pathology models create demand for standardized automated systems. Opportunities arise for low-maintenance equipment, compact analyzers, and cloud-based software designed for resource-constrained laboratories. As healthcare access expands, routine blood tests, infectious disease screening, and molecular diagnostics drive sustained adoption across developing regions.
Key Challenges
High Capital Investment and Limited Budget Flexibility
Full automation requires substantial upfront spending on robotic handlers, analyzers, conveyor systems, and software platforms, making adoption difficult for small and mid-sized labs. Maintenance contracts, consumables, and operator training add ongoing costs. Public hospitals in developing regions often rely on restricted procurement budgets, slowing transition to automation. Leasing models and pay-per-use options reduce pressure, but many labs still delay investment. Vendors face pressure to offer flexible pricing, scalable modules, and compact systems designed for smaller facilities. Budget constraints remain a major barrier preventing universal automation across the clinical diagnostic landscape.
Integration Complexity and Lack of Skilled Operators
Automated systems must integrate with existing LIS, legacy analyzers, and hospital information systems, which can create compatibility issues. Poor interoperability leads to workflow disruptions, manual data transfers, or duplicate records. Many laboratories lack trained automation engineers capable of installing, calibrating, and troubleshooting advanced hardware. This increases reliance on vendor support and lengthens deployment timelines. In low-resource settings, power instability, inadequate space, and limited IT infrastructure further restrict adoption. Without proper training and standardized protocols, laboratories risk underutilizing advanced equipment, reducing return on investment. Integration complexity remains a critical challenge despite ongoing improvements in plug-and-play designs.
Regional Analysis
North America
North America holds the largest share of the Lab Automation in Clinical Diagnostics market, accounting for over 38% of total revenue. The region benefits from advanced healthcare infrastructure, strong reimbursement systems, and early adoption of robotic analyzers and LIMS platforms. High test volumes in infectious disease screening, oncology diagnostics, and precision medicine accelerate demand for automated workstations in hospitals and reference labs. Large diagnostic chains invest in AI-enabled interpretation tools and high-throughput automation to reduce turnaround time. The presence of leading automation manufacturers and significant R&D funding continue to reinforce North America’s dominant market position.
Europe
Europe accounts for around 28% of the market, driven by strict clinical quality standards and broad adoption of molecular diagnostics. Germany, the United Kingdom, and France lead deployment of automated hematology and microbiology systems across public laboratories and university hospitals. The region supports digitization of pathology workflows, replacing manual microscopy with automated imaging and data management tools. Rising demand for chronic disease monitoring and aging population needs increases diagnostic volumes. Investments in laboratory modernization, coupled with government-backed healthcare spending, keep Europe a strong growth contributor. Cross-border diagnostic networks further support the expansion of automated platforms.
Asia-Pacific
Asia-Pacific holds nearly 23% of global revenue and represents the fastest-growing regional market. China, Japan, South Korea, and India are expanding diagnostic infrastructure to manage rising testing needs in infectious diseases, oncology, and metabolic disorders. Healthcare providers invest in automated liquid handlers, modular analyzers, and cloud-connected LIMS to overcome technician shortages and reduce reporting errors. The growing presence of private hospitals and corporate diagnostic chains accelerates adoption. Government healthcare reforms and increased spending support modernization of laboratories across urban and semi-urban areas. Cost-effective automation solutions and localized manufacturing further strengthen regional growth.
Latin America
Latin America contributes approximately 6% of the market, supported by increasing automation in central laboratories and private diagnostic networks. Brazil and Mexico lead adoption, driven by high testing volumes and demand for faster reporting in infectious disease management. Many laboratories transition from manual workflows to semi-automated analyzers and barcode-based specimen tracking to reduce error rates. Budget limitations slow full-scale robotics deployment, but leasing and service-based acquisition models improve accessibility. International diagnostic chains expand their presence in major cities, increasing demand for scalable automation platforms. Gradual digitization of healthcare records also boosts adoption of LIMS and ELN systems.
Middle East & Africa
The Middle East & Africa region holds around 5% of the market, with adoption led by Saudi Arabia, the United Arab Emirates, and South Africa. Healthcare modernization programs and investments in advanced hospital laboratories drive demand for automated analyzers and integrated diagnostic systems. Private healthcare providers adopt robotic workstations to improve sample accuracy and reduce turnaround time in high-volume clinical testing. However, limited funding and uneven infrastructure restrict widespread deployment across developing countries. Growth opportunities arise from government-backed healthcare reforms, rising chronic disease screening, and international partnerships to equip new laboratories with automation platforms.
Market Segmentations:
By Product Type
- Equipment
- Robotic Arm
- Microplate Readers
- Automated Workstation
- Automated Liquid Handlers
- Analyzers
- Software
-
- Laboratory Information Management Systems
- Electronic Laboratory Notebook (ELN)
- Laboratory Information System (LIS)
By Application
- Drug Discovery
- Genomics
- Proteomics
- Clinical Diagnostics
By End-use
- Pharmaceutical & Biotechnology Companies
- Diagnostic Labs
- Research & Academic Institutes
By Geography
- North America
- U.S.
- Canada
- Mexico
- Europe
- Germany
- France
- U.K.
- Italy
- Spain
- Rest of Europe
- Asia Pacific
- China
- Japan
- India
- South Korea
- South-east Asia
- Rest of Asia Pacific
- Latin America
- Brazil
- Argentina
- Rest of Latin America
- Middle East & Africa
- GCC Countries
- South Africa
- Rest of the Middle East and Africa
Competitive Landscape
The competitive landscape of the Lab Automation in Clinical Diagnostics market includes global technology providers, diagnostic instrument manufacturers, and software platform developers focused on workflow digitization and high-throughput testing. Companies compete on innovation in robotic sample handling, AI-enabled analyzers, integrated LIMS platforms, and modular automation systems designed for scalable deployment. Leading players expand portfolios through product launches, mergers, and collaborations with diagnostic laboratories and healthcare networks. Pricing flexibility, remote support, and cloud connectivity remain key differentiators as laboratories seek reliable uptime and faster reporting. The market also sees rising competition from regional manufacturers offering compact, cost-efficient automation built for mid-sized labs in emerging economies. Software vendors strengthen interoperability across LIS, ELN, and data analytics tools to streamline clinical workflows. With increasing demand for precision diagnostics and reduced manual intervention, industry competition continues to favor companies delivering fully integrated, connected, and data-driven automation solutions tailored for high-volume testing environments.
Key Player Analysis
- Thermo Fisher Scientific, Inc.
- Eppendorf AG
- Agilent Technologies, Inc.
- Bio Tek Instruments, Inc.
- Siemens Healthineers
- PerkinElmer Inc.
- Danaher Corporation
- Qiagen N.V.
Recent Developments
- In June 2025, Thermo Fisher announced intent to sell parts of its diagnostics business (including microbiology unit) for about USD 4 billion, signaling a strategic realignment.
- In March 2025, PerkinElmer Inc., the firm launched the QSight® 500 LC/MS/MS system, which enables laboratories to perform over 25,000 continuous analyses without cleaning in complex sample matrices.
Report Coverage
The research report offers an in-depth analysis based on Product type, Application, End-Use and Geography. It details leading market players, providing an overview of their business, product offerings, investments, revenue streams, and key applications. Additionally, the report includes insights into the competitive environment, SWOT analysis, current market trends, as well as the primary drivers and constraints. Furthermore, it discusses various factors that have driven market expansion in recent years. The report also explores market dynamics, regulatory scenarios, and technological advancements that are shaping the industry. It assesses the impact of external factors and global economic changes on market growth. Lastly, it provides strategic recommendations for new entrants and established companies to navigate the complexities of the market.
Future Outlook
- Demand for automation will rise as laboratories handle higher sample volumes and complex diagnostic workloads.
- AI and machine learning tools will improve result interpretation, anomaly detection, and workflow optimization.
- Cloud-connected LIMS platforms will enable multi-site data sharing, remote monitoring, and real-time quality control.
- Robotic liquid handlers and modular workstations will replace manual sample preparation in high-throughput labs.
- Integrated automation lines will reduce human errors and speed up clinical turnaround time.
- Adoption of automated molecular testing systems will grow with expansion of precision medicine.
- Compact and cost-efficient automation will see increasing demand in mid-sized and emerging-market laboratories.
- Vendor service models such as leasing and pay-per-use plans will make automation more accessible.
- Interoperability between diagnostic analyzers, LIS, ELN, and hospital systems will become a competitive requirement.
- Automation will remain essential for workforce-constrained laboratories seeking standardized and scalable operations.
Request a Free Sample
Fill in your details and we'll send you a free sample report.
- Sample data tables & charts
- Research methodology
Need a Custom Version of This Report?
Tailor the scope, geography, or segments to your exact requirements.
- Custom geography or segment scope
- Direct access to our analyst team
Frequently Asked Questions
What is the current market size for Lab Automation in Clinical Diagnostics, and what is its projected size in 2032?
At what Compound Annual Growth Rate is the Lab Automation in Clinical Diagnostics market projected to grow between 2025 and 2032?
Which Lab Automation in Clinical Diagnostics segment held the largest share in 2024?
What are the primary factors fueling the growth of the Lab Automation in Clinical Diagnostics market?
Who are the leading companies in the Lab Automation in Clinical Diagnostics market?
Table of Content
Chapter 1. Report Introduction
- 1.1 Report Description & Purpose
- 1.1.1 Report Title & Market Definition
- 1.1.2 Unique Selling Propositions (USP) & Key Differentiators
- 1.1.3 Value Proposition for Stakeholders
- 1.2 Research Objectives
- 1.2.1 Market Sizing Objectives (Volume & Revenue)
- 1.2.2 Segmentation Objectives
- 1.2.3 Competitive Intelligence Objectives
- 1.2.4 Forecast & Scenario Objectives
- 1.3 Report Scope
- 1.3.1 Lab Automation Clinical Diagnostic Scope – Types & Subtypes Covered
- 1.3.2 Geographic Scope – Regions & Countries Covered
- 1.3.3 Historical Period, Base Year & Forecast Period (2024; forecast to 2032)
- 1.3.4 Inclusions & Exclusions
- 1.4 HS Code & Classification Framework
- 1.5 Currency, Units & Pricing Basis
- 1.6 Target Stakeholders
- 1.7 Limitations & Assumptions
Chapter 2. Executive Summary
- 2.1 Global Lab Automation Clinical Diagnostic Market Snapshot
- 2.1.1 Market Size – Historical (2024) & Forecast (2024-2032) (2024: USD 7.87 Billion → 2032: USD 12.99 Billion)
- 2.1.2 Volume & Revenue – Global Totals
- 2.1.3 Key Market Highlights – Top Five Facts
- 2.2 Lab Automation Clinical Diagnostic Market Segmentation Snapshot
- 2.2.1 Market Split by Region – 2024 vs. 2032
- 2.3 Competitive Snapshot
- 2.3.1 Top 10 Players by Revenue Share – 2024
- 2.3.2 Top 10 Players by Volume Share – 2024
- 2.3.3 Recent Strategic Developments (18-Month Summary)
- 2.4 Key Investment Highlights & Strategic Conclusions
Chapter 3. Lab Automation Clinical Diagnostic Market Dynamics & Industry Analysis
- 3.1 Market Overview & Context
- 3.1.1 Lab Automation Clinical Diagnostic Market Position in the Broader Automotive Value Chain
- 3.1.2 OEM vs. Replacement Market Dynamics
- 3.1.3 Market Maturity & Development Stage by Region
- 3.2 Lab Automation Clinical Diagnostic Market Drivers
- 3.3 Lab Automation Clinical Diagnostic Market Restraints & Challenges
- 3.4 Lab Automation Clinical Diagnostic Market Opportunities
- 3.5 Porter's Five Forces Analysis
- 3.5.1 Threat of New Entrants
- 3.5.2 Bargaining Power of Suppliers
- 3.5.3 Bargaining Power of Buyers
- 3.5.4 Threat of Substitutes
- 3.5.5 Competitive Rivalry – Intensity Assessment
- 3.6 Lab Automation Clinical Diagnostic Value Chain Analysis
- 3.6.1 Upstream – Raw Material/Input Suppliers
- 3.6.1.1 Raw Material/Input 1
- 3.6.1.2 Raw Material/Input 2
- 3.6.1.3 Raw Material/Input 3
- 3.6.2 Midstream – Production/Manufacturing/Service Delivery
- 3.6.2.1 Production/Process Overview
- 3.6.2.2 Key Facility Locations & Capacity by Manufacturer
- 3.6.3 Downstream – Distribution & End Consumer
- 3.6.3.1 Primary Channel – B2B/OEM
- 3.6.3.2 Secondary Channels – Dealer, Retail, Online, Direct
- 3.6.4 Value Chain Profitability Analysis
- 3.6.1 Upstream – Raw Material/Input Suppliers
- 3.7 PESTEL Analysis
- 3.7.1 Political Factors
- 3.7.2 Economic Factors
- 3.7.3 Social Factors
- 3.7.4 Technological Factors
- 3.7.5 Environmental Factors
- 3.7.6 Legal Factors
- 3.8 Lab Automation Clinical Diagnostic Supply Chain Analysis
- 3.8.1 Raw Material/Input Supply Risk Assessment
- 3.8.2 Manufacturing Concentration Risk (Geographic Exposure)
- 3.8.3 Trade Disruption Impact Analysis
- 3.9 Regulatory & Policy Landscape
Note: The regulatory and policy landscape section covers regulations based on their applicability to the market, Lab Automation Clinical Diagnostic category, geography, and scope of the study. Only regulatory frameworks with a material impact on operations, compliance, trade, sustainability, or market access are analyzed in detail.
Chapter 4. Key Investment Pockets & Opportunity Analysis
- 4.1 Lab Automation Clinical Diagnostic Market Attractiveness Analysis
- 4.1.1 By Region – Investment Attractiveness Matrix (Volume × CAGR)
- 4.2 Absolute Revenue Growth Opportunity
- 4.2.1 By Region – Absolute USD Growth Through 2032
- 4.3 Incremental Volume Opportunity
- 4.3.1 By Region – Incremental Volume Through 2032
- 4.3.2 Segment – Incremental Volume
- 4.4 Emerging Submarket Opportunity Deep Dive (Subject to Applicability)
- 4.5 Emerging Market Opportunity Scorecards
- 4.5.1 United States
- 4.5.2 Europe
- 4.5.3 Asia
- 4.5.4 Middle East & Africa
Note: Emerging Market Opportunity Scorecards will be included based on relevance and strategic importance. Regions listed are indicative and may vary depending on data availability and market dynamics.
Chapter 5. Lab Automation Clinical Diagnostic Import-Export Analysis & Trade Flows
- 5.1 Global Trade Overview
- 5.1.1 Global Export Value by Country (2024)
- 5.1.2 Global Export Volume by Country (2024)
- 5.1.3 Global Import Value by Country (2024)
- 5.1.4 Global Import Volume by Country (2024)
- 5.1.5 Net Trade Balance by Country (2024)
- 5.2 Export Analysis – Segment
- 5.2.1 Type 1 (HS Code)
- 5.2.2 Type 2 (HS Code)
- 5.2.3 Type 3 (HS Code)
- 5.2.4 Type 4 (HS Code)
- 5.2.5 Type 5 (HS Code)
- 5.3 Import Analysis – Segment
- 5.3.1 Type 1 (HS Code)
- 5.3.2 Type 2 (HS Code)
- 5.3.3 Type 3 (HS Code)
- 5.3.4 Type 4 (HS Code)
- 5.3.5 Type 5 (HS Code)
- 5.4 Average Unit Trade Prices
- 5.4.1 Average Export Price – Segment & Country
- 5.4.2 Average Import Price – Segment & Source Country
- 5.4.3 Price Trends (2024)
- 5.5 Key Trade Route Analysis
- 5.5.1 Trade Route 1
- 5.5.2 Trade Route 2
- 5.5.3 Trade Route 3
- 5.5.4 Trade Route 4
- 5.5.5 Trade Route 5
- 5.6 Trade Policy Impact Assessment
- 5.6.1 US Anti-Dumping & Section 301 Tariffs
- 5.6.2 EU Customs Union Impact
- 5.6.3 Major Free Trade Agreements
- 5.6.4 USMCA Rules of Origin
Note: Trade policy analysis will be included only where relevant to the Lab Automation Clinical Diagnostic market.
Chapter 6. Competitive Landscape & Company Benchmarking
- 6.1 Lab Automation Clinical Diagnostic Market Concentration & Structure
- 6.1.1 Herfindahl-Hirschman Index (HHI) – vs. 2024
- 6.1.2 Tier 1, Tier 2 & Tier 3 Market Structure
- 6.1.3 Global, Regional & Local Player Dynamics
- 6.2 Lab Automation Clinical Diagnostic Market Share Analysis – 2024
- 6.2.1 Global Revenue Share by Company
- 6.2.2 Global Volume Share by Company
- 6.2.3 Regional Revenue Share
- 6.2.4 Market Share Evolution ( vs. 2024)
- 6.2.5 OEM Segment Share by Company
- 6.2.6 Replacement Segment Share by Company
- 6.3 Production/Delivery Capacity & Facility Analysis
- 6.3.1 Global Installed Capacity
- 6.3.2 Capacity Utilization Rates
- 6.3.3 Production/Output Volume
- 6.3.4 Facility Locations & Capacity Map
- 6.3.5 Planned Capacity Additions
- 6.4 Lab Automation Clinical Diagnostic Competitive Benchmarking Matrix
- 6.4.1 Revenue, Volume, CAGR & Profitability Comparison
- 6.4.2 Channel Revenue Mix
- 6.4.3 Geographic Revenue Exposure
- 6.4.4 R&D Intensity
- 6.4.5 Sustainability Maturity
- 6.5 Strategic Developments in Lab Automation Clinical Diagnostic (Last 24 Months)
- 6.5.1 Mergers, Acquisitions & Divestments
- 6.5.2 New Lab Automation Clinical Diagnostic Launches
- 6.5.3 Facility Expansions
- 6.5.4 Strategic Alliances, Joint Ventures & Partnerships
- 6.5.5 Distribution Expansion & Market Entry
- 6.5.6 Sustainability & ESG Initiatives
- 6.6 Competitive Strategy Mapping
- 6.6.1 Leader, Challenger, Follower & Niche Classification
- 6.6.2 Pricing Strategy Comparison
- 6.6.3 Channel Strategy Matrix
Note: Strategic developments are included based on their materiality and the availability of reliable information.
Chapter 7. Global Lab Automation Clinical Diagnostic Market – By Distribution Channel
- 7.1 Segment Overview
- 7.1.1 Volume & Revenue Split by Channel (2024 & 2032)
- 7.1.2 Channel Mix Evolution (2024-2032)
Chapter 8. Regional Market Analysis – Global Overview
- 8.1 Global Regional Overview
- 8.1.1 Regional Volume Share
- 8.1.2 Regional Revenue Share
- 8.1.3 Regional Volume by Region
- 8.1.4 Regional Revenue by Region
- 8.1.5 Regional Forecast Through 2032
- 8.2 Cross-Regional Segment Analysis
- 8.2.1 By Distribution Channel
- 8.2.2 By Brand/Price Tier
Chapter 9. North America Lab Automation Clinical Diagnostic Market
- 9.1 United States
- 9.2 Canada
- 9.3 Mexico
Chapter 10. Europe Lab Automation Clinical Diagnostic Market
- 10.1 Germany
- 10.2 France
- 10.3 Italy
- 10.4 United Kingdom
- 10.5 Spain
- 10.6 Poland
- 10.7 Russia
- 10.8 Netherlands
- 10.9 Belgium
- 10.10 Sweden
- 10.11 Denmark
- 10.12 Norway
- 10.13 Rest of Europe
Chapter 11. Asia Pacific Lab Automation Clinical Diagnostic Market
- 11.1 China
- 11.2 India
- 11.3 Japan
- 11.4 South Korea
- 11.5 Thailand
- 11.6 Indonesia
- 11.7 Vietnam
- 11.8 Malaysia
- 11.9 Australia
- 11.10 Rest of Asia Pacific
Chapter 12. Latin America Lab Automation Clinical Diagnostic Market
- 12.1 Brazil
- 12.2 Argentina
- 12.3 Colombia
- 12.4 Chile
- 12.5 Rest of Latin America
Chapter 13. Middle East Lab Automation Clinical Diagnostic Market
- 13.1 Saudi Arabia
- 13.2 United Arab Emirates
- 13.3 Turkey
- 13.4 Israel
- 13.5 Iran
- 13.6 Rest of the Middle East
Chapter 14. Africa Lab Automation Clinical Diagnostic Market
- 14.1 South Africa
- 14.2 Egypt
- 14.3 Nigeria
- 14.4 Morocco
- 14.5 Rest of Africa
Chapter 15. Lab Automation Clinical Diagnostic Company Profiles
- 15.1 [Company 01]
- 15.1.1 Company Overview
- 15.1.2 Key Management Personnel
- 15.1.3 Products & Services Portfolio
- 15.1.4 Financial Performance
- 15.1.5 Key Market Focus & Geographic Presence
- 15.1.6 Recent Developments & Strategic Initiatives
Note: The company profile list is preliminary and may change based on research findings, market developments, data availability, and client requirements.
Chapter 16. Appendices
- Appendix A – List of Abbreviations & Acronyms
- Appendix B – Industry Classification Code Reference – Full Series
- Appendix C – Production & Capacity Data Tables
- Appendix D – End-Use & Demand Base Tables
- Appendix E – Consumption & Replacement Rate Assumptions
- Appendix F – ASP Reference Tables
- Appendix G – Manufacturing & Facility Database
- Appendix H – Import-Export Data Tables
- Appendix I – Regulatory Summary Tables
- Appendix J – Primary Research Participant List (Anonymized)
- Appendix K – Primary Research Questionnaire Framework
- Appendix L – Data Sources & Bibliography
- Appendix M – Market Size Divergence & Source Comparison
Chapter 17. Research Methodology
- 17.1 Research Framework & Philosophy
- 17.2 Secondary Research – Sources, Hierarchy & Data Extraction
- 17.3 Data Modeling – Bottom-Up & Top-Down Market Sizing
- 17.4 Primary Research – Stakeholder Framework, LOI & Sample Sizes
- 17.5 Forecast Methodology – Regression, Scenario & Sensitivity Analysis
- 17.6 Quality Control – Four-Layer Validation Framework
- 17.7 Limitations & Standard Assumptions
- 17.8 Disclaimer
