
Market Overview
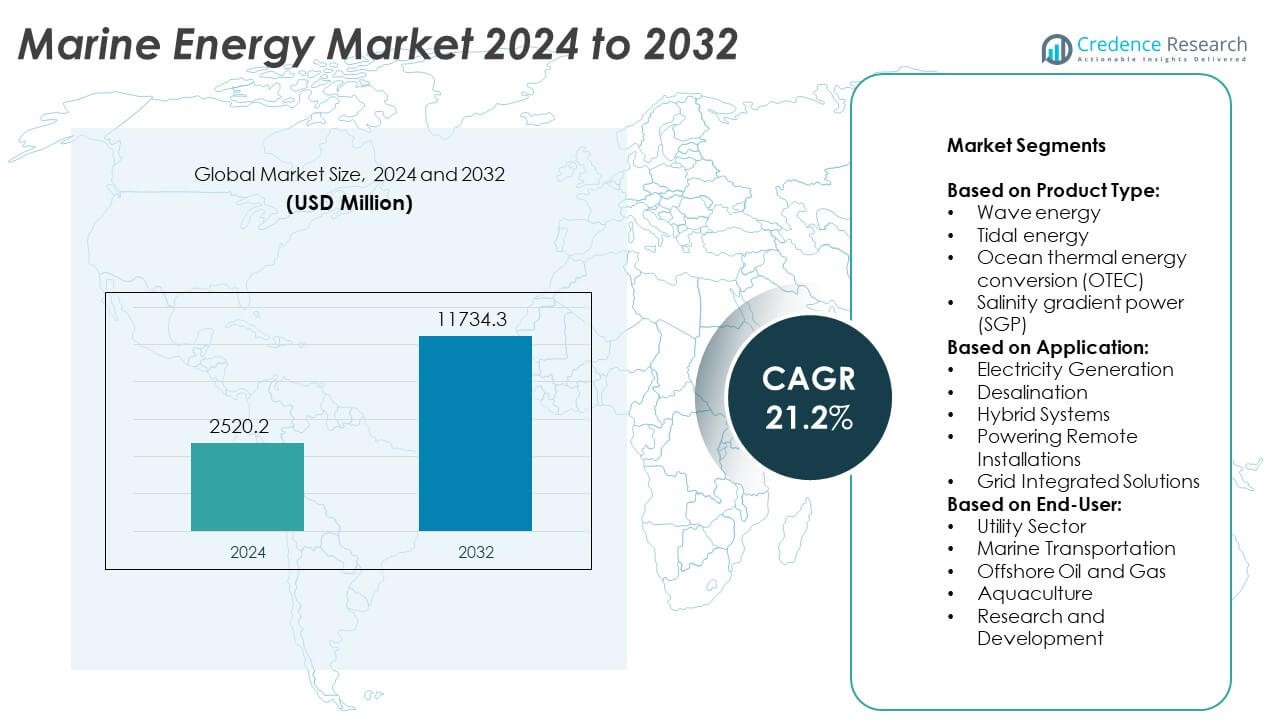
Marine Energy Market size was valued at USD 2520.2 million in 2024 and is anticipated to reach USD 11734.3 million by 2032, at a CAGR of 21.2% during the forecast period.
| REPORT ATTRIBUTE | DETAILS |
|---|---|
| Historical Period | 2020-2024 |
| Base Year | 2024 |
| Forecast Period | 2025-2032 |
| Marine Energy Market Size 2024 | USD 2520.2 Million |
| Marine Energy Market, CAGR | 21.2% |
| Marine Energy Market Size 2032 | USD 11734.3 Million |
Marine Energy market grows through rising demand for renewable power, supportive government policies, and technological advancements enhancing efficiency and cost-effectiveness. It benefits from increasing investment in wave, tidal, and ocean thermal projects to diversify energy sources and reduce carbon emissions. Trends include integration with hybrid renewable systems, expansion of demonstration projects into commercial operations, and adoption of AI-driven monitoring for performance optimization.
North America leads development with advanced research facilities and strong pilot projects in the United States and Canada, while Europe maintains dominance through extensive tidal and wave deployments in the UK, France, and Portugal. Asia-Pacific experiences rapid growth driven by large-scale investments in China, Japan, and Australia. Latin America explores wave energy potential in Chile and Brazil, and Middle East & Africa advance early-stage projects in South Africa and island nations. Key players in the Marine Energy market include Voith Hydro, Ocean Power Technologies, and Marine Current Turbines (MCT), each contributing innovative solutions to expand commercial adoption globally.
Market Insights
- Marine Energy market was valued at USD 2520.2 million in 2024 and is projected to reach USD 11734.3 million by 2032, growing at a CAGR of 21.2% during the forecast period.
- The market grows on the back of rising global demand for renewable energy, supportive government incentives, and advancements in wave, tidal, and ocean thermal energy technologies. It benefits from predictable energy generation and potential to reduce carbon emissions.
- Key trends include the integration of hybrid renewable systems, expansion of demonstration projects into full-scale commercial operations, and deployment of AI-based monitoring to improve efficiency and reduce downtime.
- Competition features established players such as Voith Hydro, Ocean Power Technologies, and Marine Current Turbines (MCT), alongside emerging innovators like Wello Oy and AWS Ocean Energy. Strategic partnerships, technology licensing, and infrastructure collaborations are shaping competitive positioning.
- High capital costs, long permitting processes, and technical challenges in harsh marine environments act as major restraints, impacting scalability and delaying large-scale adoption. Environmental concerns and grid integration complexities also limit faster deployment.
- North America demonstrates strong growth potential with advanced R&D and active government support, while Europe remains a leader due to mature projects and robust policy frameworks. Asia-Pacific shows accelerating adoption driven by China, Japan, and Australia’s coastal energy programs. Latin America and Middle East & Africa are emerging with untapped marine energy resources.
- Long-term growth will depend on continued technological innovation, reduced costs, and expanded collaboration between governments, private investors, and research institutions to unlock full resource potential.
Market Drivers
Rising Global Demand for Renewable and Sustainable Power Sources
Marine Energy market benefits from the accelerating shift toward renewable power to reduce dependence on fossil fuels. Governments and private sectors prioritize ocean-based energy solutions to meet carbon neutrality targets. It offers consistent power generation potential, unlike intermittent solar or wind sources. Coastal nations invest heavily in wave, tidal, and ocean thermal projects to diversify their energy mix. Technological innovations increase efficiency and reduce operational costs, encouraging adoption. Supportive global policies create a favorable environment for scaling commercial projects.
- For instance, ORPC’s RivGen Power System in Alaska delivers 40 kW of continuous electricity to a remote community, reducing diesel fuel consumption by approximately 28,000 liters annually.
Government Incentives and Supportive Regulatory Frameworks Driving Commercial Deployment
Many countries implement feed-in tariffs, tax credits, and grant programs to attract investors to marine energy projects. It gains momentum through favorable permitting processes and research funding for pilot deployments. Stable policy frameworks reduce investment risks and encourage long-term infrastructure development. Collaboration between governments and technology developers accelerates commercialization timelines. National targets for renewable capacity expansion provide clear market growth signals. Public-private partnerships foster innovation and enhance market competitiveness.
- For instance, The SeaGen tidal power system, developed by Marine Current Turbines, achieved a rated capacity of 1.2 MW and produced over 11.6 GWh of electricity while operating in Northern Ireland.
Advancements in Technology Enhancing Energy Conversion Efficiency
Continuous improvements in turbine design, hydrodynamic modeling, and materials science increase power output from marine resources. It benefits from AI-driven monitoring systems that optimize performance and reduce maintenance needs. Modular and scalable device designs make deployment in varied marine environments more feasible. Cost reductions in installation and grid connection improve economic viability. Enhanced durability of equipment extends operational lifespan in harsh ocean conditions. Integration with hybrid renewable systems broadens its application potential.
Rising Coastal Energy Demand and Strategic Infrastructure Development
Rapid urbanization in coastal regions increases demand for clean, locally generated energy. It offers a strategic solution for island nations and remote coastal communities with limited grid connectivity. Large-scale infrastructure investments improve transmission capabilities from offshore installations to mainland grids. Ports and maritime industries explore marine power integration to reduce operational emissions. Regional energy security concerns drive governments to harness domestic marine resources. Growth in coastal economic zones supports the development of dedicated marine energy hubs.
Market Trends
Integration of Hybrid Renewable Systems to Maximize Energy Reliability
Marine Energy market sees growing adoption of hybrid systems combining tidal, wave, and offshore wind technologies. It enables continuous power generation by balancing variable resource availability. Hybrid projects reduce reliance on grid storage and improve energy supply stability. Developers integrate advanced forecasting models to optimize operational scheduling. Strategic co-location of infrastructure minimizes installation costs and maximizes ocean space utilization. This approach attracts utility-scale investments and strengthens long-term project feasibility.
- For instance, The RivGen Power System in Igiugig, Alaska, initially provided about one-third of the community's electricity needs upon its 2014 commissioning. Later, in July 2019, it delivered 35 kW to the local microgrid, demonstrating its increasing contribution to the community's energy supply.
Technological Innovation Driving Higher Energy Yields and Cost Reduction
Rapid advancements in turbine hydrodynamics, mooring systems, and energy converters improve efficiency and reliability. It benefits from AI-based predictive maintenance that lowers downtime and operational costs. New materials with high corrosion resistance extend the lifespan of marine equipment in harsh environments. Floating platforms allow deployment in deeper waters with stronger energy potential. Scalable device architectures simplify expansion from pilot projects to commercial arrays. These developments make marine power more competitive with other renewables.
- For instance, Wello Oy’s Penguin wave energy converter—which ranged between 0.5 MW and 1 MW in rated capacity with a hull length between 30 m and 56 m—operated successfully at EMEC and withstood waves of up to 18.7 m tall.
Expansion of Demonstration Projects into Commercial-Scale Operations
Pilot programs worldwide transition into full-scale commercial deployments, signaling market maturity. It gains credibility from proven performance metrics and consistent power delivery in diverse oceanic conditions. Governments allocate more funding toward large-scale infrastructure and grid connection solutions. Successful demonstration projects attract private capital and corporate partnerships. Coastal regions with strong marine currents emerge as prime locations for commercial expansion. This shift accelerates the pace of global renewable integration.
Rising Strategic Investments in Offshore Energy Infrastructure
Infrastructure development aligns with the increasing demand for ocean-based renewable capacity. It benefits from purpose-built ports, subsea cabling, and maintenance hubs designed for marine installations. Countries with advanced maritime industries leverage existing capabilities to support the sector’s growth. International collaborations promote standardization and reduce project execution risks. Investments in local manufacturing facilities shorten supply chains and reduce costs. These advancements position marine power as a central component of the renewable energy landscape.
Market Challenges Analysis
High Capital Costs and Long Development Timelines Restricting Scalability
Marine Energy market faces significant barriers due to high upfront investment requirements for technology deployment and infrastructure. It demands specialized materials, subsea cabling, and robust installation processes that increase overall project costs. Long permitting cycles and environmental impact assessments extend development timelines, delaying returns on investment. Limited availability of dedicated financing mechanisms reduces accessibility for small and medium-sized developers. The need for extensive site-specific research further adds to project complexity. These financial and procedural hurdles slow the pace of commercial adoption in many regions.
Technical, Environmental, and Operational Risks Impacting Reliability
Marine energy projects encounter operational challenges from harsh ocean conditions, including strong currents, storms, and biofouling on equipment. It requires advanced engineering solutions to ensure device durability and consistent energy output. Uncertainties in long-term performance data limit investor confidence and hinder widespread funding. Potential environmental impacts on marine ecosystems demand rigorous monitoring and compliance with strict regulations. Integration with existing grid infrastructure can be complex in remote or offshore locations. These risks collectively make the path to large-scale deployment more demanding for the sector.
Market Opportunities
Untapped Global Marine Resources Offering Significant Expansion Potential
Marine Energy market holds vast opportunities due to the abundance of wave, tidal, and ocean thermal resources worldwide. It can harness predictable and consistent energy flows, providing a stable renewable power source for coastal nations. Many regions with strong marine currents remain underexplored, offering scope for first-mover advantages. Governments in island and remote communities increasingly prioritize ocean-based energy to reduce fuel import dependence. Advancements in site mapping and resource assessment improve the accuracy of project feasibility studies. This untapped potential positions marine power as a key contributor to future energy diversification.
Technological Synergies and Cross-Sector Collaboration Driving Growth
Opportunities arise from integrating marine power with offshore wind farms, aquaculture facilities, and desalination plants. It benefits from shared infrastructure, reducing installation and operational costs. Collaboration between energy developers, maritime industries, and research institutions accelerates innovation. Hybrid renewable platforms create multi-use ocean spaces that maximize economic returns. Expansion into energy storage integration strengthens the ability to provide stable supply to grids. These synergies open new revenue streams and enhance the sector’s global competitiveness.
Market Segmentation Analysis:
By Product Type:
Marine Energy market encompasses diverse technologies, with wave energy harnessing surface motion to drive turbines and generators. It benefits from predictable wave patterns in regions with strong coastal swells. Tidal energy leverages the gravitational pull of the moon and sun to produce consistent power, often through barrages or underwater turbines. Ocean thermal energy conversion (OTEC) uses temperature differentials between surface and deep water to generate electricity in tropical waters. Salinity gradient power (SGP) exploits osmotic pressure differences between freshwater and seawater, offering niche but promising applications. Each technology varies in maturity, scalability, and regional suitability, driving targeted investments.
- For instance, Verdant Power’s Roosevelt Island Tidal Energy (RITE) project in New York achieved a rated capacity of 105 kW per turbine, generating over 70 MWh during its grid-connected demonstration phase.
By Application:
Electricity generation remains the primary application, with large-scale arrays supplying power to coastal grids. It supports desalination plants in water-scarce regions by providing a renewable energy source for freshwater production. Hybrid systems integrate multiple marine and offshore renewable technologies to ensure steady output. Powering remote installations, including defense outposts and isolated communities, offers strategic benefits where grid connections are impractical. Grid integrated solutions enhance national energy security by diversifying renewable sources. These applications collectively strengthen the role of marine energy in sustainable infrastructure.
- For instance, Nova Innovation’s tidal turbines in Shetland deliver 600 kW of combined capacity, supplying clean electricity to over 300 homes and supporting local aquaculture operations.
By End-User:
The utility sector leads adoption, leveraging marine power for stable, large-scale electricity supply. It serves marine transportation through shore-to-ship power solutions that reduce port emissions. Offshore oil and gas operators deploy marine energy systems to power rigs and support operations while lowering environmental impact. Aquaculture facilities use it for on-site power, reducing reliance on diesel generators. Research and development organizations focus on refining conversion technologies and testing in varied oceanic environments. The broad spectrum of end-users reflects the sector’s versatility and long-term growth potential.
Segments:
Based on Product Type:
- Wave energy
- Tidal energy
- Ocean thermal energy conversion (OTEC)
- Salinity gradient power (SGP)
Based on Application:
- Electricity Generation
- Desalination
- Hybrid Systems
- Powering Remote Installations
- Grid Integrated Solutions
Based on End-User:
- Utility Sector
- Marine Transportation
- Offshore Oil and Gas
- Aquaculture
- Research and Development
Based on the Geography:
- North America
- U.S.
- Canada
- Mexico
- Europe
- UK
- France
- Germany
- Italy
- Spain
- Russia
- Belgium
- Netherlands
- Austria
- Sweden
- Poland
- Denmark
- Switzerland
- Rest of Europe
- Asia Pacific
- China
- Japan
- South Korea
- India
- Australia
- Thailand
- Indonesia
- Vietnam
- Malaysia
- Philippines
- Taiwan
- Rest of Asia Pacific
- Latin America
- Brazil
- Argentina
- Peru
- Chile
- Colombia
- Rest of Latin America
- Middle East
- UAE
- KSA
- Israel
- Turkey
- Iran
- Rest of Middle East
- Africa
- Egypt
- Nigeria
- Algeria
- Morocco
- Rest of Africa
Regional Analysis
North America
North America accounts for 28% of the global Marine Energy market, driven by strong governmental and private sector support for renewable energy development. The United States leads with significant investments in tidal and wave energy projects along the Pacific Northwest and Atlantic coasts. It benefits from advanced research institutions and pilot programs that demonstrate commercial feasibility. Canada’s extensive coastline and strong tidal flows in regions like the Bay of Fundy position it as a major contributor to regional capacity. Federal and state incentives, along with favorable regulatory frameworks, encourage private investment and technology innovation. Ongoing collaborations between utilities, technology providers, and coastal communities are expected to expand installed capacity in the coming years.
Europe
Europe holds 32% of the Marine Energy market, making it the largest regional contributor. The region leads in tidal stream and wave energy deployments, with the United Kingdom, France, and Portugal at the forefront. It benefits from robust policy support under the European Green Deal and funding through Horizon Europe programs. The UK’s Orkney Islands serve as a global hub for marine energy testing and innovation. France advances tidal projects in Brittany, while Portugal focuses on wave energy initiatives along its western coast. Strong cross-border collaborations, coupled with a mature supply chain, continue to strengthen Europe’s dominance in the sector.
Asia-Pacific
Asia-Pacific represents 25% of the Marine Energy market, with rapid expansion driven by coastal energy demand and large-scale renewable integration goals. China invests heavily in tidal and wave energy research, aiming to commercialize domestic technology for both domestic use and export. It benefits from abundant marine resources across diverse climatic zones, from tropical to temperate waters. Japan focuses on integrating marine energy into island power systems, while Australia advances wave energy projects along its southern and western coasts. Government-led demonstration programs and regional partnerships accelerate deployment, particularly in countries with significant island populations. The region’s vast resource base positions it for long-term market growth.
Latin America
Latin America captures 8% of the Marine Energy market, with growing interest in wave and tidal energy to diversify renewable portfolios. Chile leads with wave energy potential along its long Pacific coastline, supported by research partnerships with European developers. It benefits from favorable marine conditions that allow consistent power generation. Brazil explores tidal and wave technologies to supplement hydropower during low-rainfall periods. Government support is emerging, but commercial deployment remains in the early stages. Increased private sector engagement and international collaboration are expected to unlock untapped opportunities.
Middle East & Africa
Middle East & Africa account for 7% of the Marine Energy market, primarily in early development phases. South Africa explores wave and tidal energy to strengthen its renewable mix, especially in coastal provinces. It benefits from high wave energy potential along the Atlantic and Indian Ocean coasts. Island nations in the Indian Ocean, such as Mauritius and Seychelles, pursue OTEC and hybrid systems to reduce diesel dependency. In the Middle East, interest in desalination powered by marine energy is gaining traction. Limited infrastructure and investment remain challenges, but strategic partnerships could accelerate regional adoption.
Key Player Analysis
- Oceanlinx
- Voith Hydro
- Verdant Power
- AWS Ocean Energy
- Marine Current Turbines (MCT)
- Ocean Power Technologies
- BioPower Systems
- Wello Oy
- Caegie Clean Energy
- Aquamarine Power
- OpenHydro
- ORPC
- Pulse Tidal
Competitive Analysis
The leading players in the Marine Energy market include Voith Hydro, Ocean Power Technologies, Marine Current Turbines (MCT), Wello Oy, AWS Ocean Energy, and Verdant Power. These companies focus on advancing wave, tidal, and ocean thermal technologies to achieve higher efficiency and commercial viability. Each invests heavily in R&D to develop durable systems capable of withstanding harsh marine conditions while delivering consistent power output. They pursue strategic collaborations with utilities, governments, and research institutions to accelerate deployment and secure project financing. Many target niche applications such as powering remote installations, integrating with hybrid renewable systems, and supporting desalination infrastructure. Technological innovations in turbine design, energy converters, and AI-based monitoring systems enhance operational performance and lower maintenance costs. Regional specialization plays a critical role, with some focusing on high tidal flow regions and others emphasizing wave-rich coastlines. The ability to demonstrate proven performance at scale remains the key factor in attracting investors and gaining regulatory approvals. Companies that align technological capability with scalable infrastructure and supportive policy environments are better positioned to capture market opportunities. The competitive landscape remains dynamic, with early movers leveraging field experience to strengthen their market share while new entrants introduce disruptive concepts to challenge established players.
Recent Developments
- In 2025, BioPower Systems is indeed involved in discussions surrounding marine energy innovation and commercialization, alongside other key players in the field. This focus includes exploring the potential of wave and tidal energy as viable renewable energy sources.
- In March 2024, Orbital Marine Power based in UK, was chosen as the technology partner for Orcas Power and Light Cooperative's tidal energy project. This project is situated in Washington's Rosario Strait, close to Blakely Island.
- In 2024, HydroWing, a UK-based company, partnered with Indonesia's PLN to establish the nation's first tidal current power plant. The 10 MW facility will be located in East Nusa Tenggara, utilizing the strong tidal currents between the Pacific and Indian Oceans.
Market Concentration & Characteristics
Marine Energy market exhibits a moderately concentrated structure, with a mix of established companies and innovative startups competing for project contracts and technology leadership. It is characterized by high entry barriers due to significant capital requirements, complex permitting processes, and the need for advanced engineering expertise. Leading players maintain a competitive edge through proprietary technologies, proven pilot projects, and strong relationships with government agencies and utilities. The sector emphasizes reliability, efficiency, and adaptability to diverse marine environments, with solutions tailored to wave, tidal, and thermal resource profiles. Strategic partnerships and cross-sector collaborations play a central role in accelerating deployment and reducing costs. Regional specialization is evident, with companies focusing on areas that align with their technological strengths and resource availability. Continuous research, field testing, and regulatory compliance shape the pace of commercialization. While competition remains global, project feasibility often depends on localized conditions and supportive policy frameworks, reinforcing the importance of regional expertise and operational resilience.
Report Coverage
The research report offers an in-depth analysis based on Product Type, Application, End-User and Geography. It details leading market players, providing an overview of their business, product offerings, investments, revenue streams, and key applications. Additionally, the report includes insights into the competitive environment, SWOT analysis, current market trends, as well as the primary drivers and constraints. Furthermore, it discusses various factors that have driven market expansion in recent years. The report also explores market dynamics, regulatory scenarios, and technological advancements that are shaping the industry. It assesses the impact of external factors and global economic changes on market growth. Lastly, it provides strategic recommendations for new entrants and established companies to navigate the complexities of the market.
Future Outlook
- The market will expand with growing demand for renewable and predictable energy sources.
- Government incentives and favorable regulations will accelerate commercial deployment.
- Technological innovations will improve efficiency and lower operational costs.
- Hybrid renewable projects combining marine energy with offshore wind will increase.
- Large-scale demonstration projects will transition into full commercial operations.
- AI-driven monitoring systems will optimize performance and reduce downtime.
- Investment in offshore infrastructure will support faster grid integration.
- Emerging markets with untapped marine resources will attract global developers.
- Collaboration between industry, academia, and governments will drive innovation.
- Environmental sustainability goals will position marine energy as a core clean power solution.
Request a Free Sample
Fill in your details and we'll send you a free sample report.
- Sample data tables & charts
- Research methodology
Need a Custom Version of This Report?
Tailor the scope, geography, or segments to your exact requirements.
- Custom geography or segment scope
- Direct access to our analyst team
Frequently Asked Questions
What is the current market size for Marine Energy market, and what is its projected size in 2032?
At what Compound Annual Growth Rate is the Marine Energy Market projected to grow between 2025 and 2032?
Which Marine Energy market segment held the largest share in 2024?
What are the primary factors fueling the growth of the Marine Energy market?
Who are the leading companies in the Marine Energy Market?
Which region commanded the largest share of the Marine Energy market in 2024?
Table of Content
Chapter 1. Report Introduction
- 1.1 Report Description & Purpose
- 1.1.1 Report Title & Market Definition
- 1.1.2 Unique Selling Propositions (USP) & Key Differentiators
- 1.1.3 Value Proposition for Stakeholders
- 1.2 Research Objectives
- 1.2.1 Market Sizing Objectives (Volume & Revenue)
- 1.2.2 Segmentation Objectives
- 1.2.3 Competitive Intelligence Objectives
- 1.2.4 Forecast & Scenario Objectives
- 1.3 Report Scope
- 1.3.1 Marine Energy Scope – Types & Subtypes Covered
- 1.3.2 Geographic Scope – Regions & Countries Covered
- 1.3.3 Historical Period, Base Year & Forecast Period (2024; forecast to 2032)
- 1.3.4 Inclusions & Exclusions
- 1.4 HS Code & Classification Framework
- 1.5 Currency, Units & Pricing Basis
- 1.6 Target Stakeholders
- 1.7 Limitations & Assumptions
Chapter 2. Executive Summary
- 2.1 Global Marine Energy Market Snapshot
- 2.1.1 Market Size – Historical (2024) & Forecast (2024-2032) (2024: USD 2520.2 million → 2032: USD 11734.3 million)
- 2.1.2 Volume & Revenue – Global Totals
- 2.1.3 Key Market Highlights – Top Five Facts
- 2.2 Marine Energy Market Segmentation Snapshot
- 2.2.1 Market Split by Region – 2024 vs. 2032
- 2.3 Competitive Snapshot
- 2.3.1 Top 10 Players by Revenue Share – 2024
- 2.3.2 Top 10 Players by Volume Share – 2024
- 2.3.3 Recent Strategic Developments (18-Month Summary)
- 2.4 Key Investment Highlights & Strategic Conclusions
Chapter 3. Marine Energy Market Dynamics & Industry Analysis
- 3.1 Market Overview & Context
- 3.1.1 Marine Energy Market Position in the Broader Automotive Value Chain
- 3.1.2 OEM vs. Replacement Market Dynamics
- 3.1.3 Market Maturity & Development Stage by Region
- 3.2 Marine Energy Market Drivers
- 3.3 Marine Energy Market Restraints & Challenges
- 3.4 Marine Energy Market Opportunities
- 3.5 Porter's Five Forces Analysis
- 3.5.1 Threat of New Entrants
- 3.5.2 Bargaining Power of Suppliers
- 3.5.3 Bargaining Power of Buyers
- 3.5.4 Threat of Substitutes
- 3.5.5 Competitive Rivalry – Intensity Assessment
- 3.6 Marine Energy Value Chain Analysis
- 3.6.1 Upstream – Raw Material/Input Suppliers
- 3.6.1.1 Raw Material/Input 1
- 3.6.1.2 Raw Material/Input 2
- 3.6.1.3 Raw Material/Input 3
- 3.6.2 Midstream – Production/Manufacturing/Service Delivery
- 3.6.2.1 Production/Process Overview
- 3.6.2.2 Key Facility Locations & Capacity by Manufacturer
- 3.6.3 Downstream – Distribution & End Consumer
- 3.6.3.1 Primary Channel – B2B/OEM
- 3.6.3.2 Secondary Channels – Dealer, Retail, Online, Direct
- 3.6.4 Value Chain Profitability Analysis
- 3.6.1 Upstream – Raw Material/Input Suppliers
- 3.7 PESTEL Analysis
- 3.7.1 Political Factors
- 3.7.2 Economic Factors
- 3.7.3 Social Factors
- 3.7.4 Technological Factors
- 3.7.5 Environmental Factors
- 3.7.6 Legal Factors
- 3.8 Marine Energy Supply Chain Analysis
- 3.8.1 Raw Material/Input Supply Risk Assessment
- 3.8.2 Manufacturing Concentration Risk (Geographic Exposure)
- 3.8.3 Trade Disruption Impact Analysis
- 3.9 Regulatory & Policy Landscape
Note: The regulatory and policy landscape section covers regulations based on their applicability to the market, Marine Energy category, geography, and scope of the study. Only regulatory frameworks with a material impact on operations, compliance, trade, sustainability, or market access are analyzed in detail.
Chapter 4. Key Investment Pockets & Opportunity Analysis
- 4.1 Marine Energy Market Attractiveness Analysis
- 4.1.1 By Region – Investment Attractiveness Matrix (Volume × CAGR)
- 4.2 Absolute Revenue Growth Opportunity
- 4.2.1 By Region – Absolute USD Growth Through 2032
- 4.3 Incremental Volume Opportunity
- 4.3.1 By Region – Incremental Volume Through 2032
- 4.3.2 Segment – Incremental Volume
- 4.4 Emerging Submarket Opportunity Deep Dive (Subject to Applicability)
- 4.5 Emerging Market Opportunity Scorecards
- 4.5.1 United States
- 4.5.2 Europe
- 4.5.3 Asia
- 4.5.4 Middle East & Africa
Note: Emerging Market Opportunity Scorecards will be included based on relevance and strategic importance. Regions listed are indicative and may vary depending on data availability and market dynamics.
Chapter 5. Marine Energy Import-Export Analysis & Trade Flows
- 5.1 Global Trade Overview
- 5.1.1 Global Export Value by Country (2024)
- 5.1.2 Global Export Volume by Country (2024)
- 5.1.3 Global Import Value by Country (2024)
- 5.1.4 Global Import Volume by Country (2024)
- 5.1.5 Net Trade Balance by Country (2024)
- 5.2 Export Analysis – Segment
- 5.2.1 Type 1 (HS Code)
- 5.2.2 Type 2 (HS Code)
- 5.2.3 Type 3 (HS Code)
- 5.2.4 Type 4 (HS Code)
- 5.2.5 Type 5 (HS Code)
- 5.3 Import Analysis – Segment
- 5.3.1 Type 1 (HS Code)
- 5.3.2 Type 2 (HS Code)
- 5.3.3 Type 3 (HS Code)
- 5.3.4 Type 4 (HS Code)
- 5.3.5 Type 5 (HS Code)
- 5.4 Average Unit Trade Prices
- 5.4.1 Average Export Price – Segment & Country
- 5.4.2 Average Import Price – Segment & Source Country
- 5.4.3 Price Trends (2024)
- 5.5 Key Trade Route Analysis
- 5.5.1 Trade Route 1
- 5.5.2 Trade Route 2
- 5.5.3 Trade Route 3
- 5.5.4 Trade Route 4
- 5.5.5 Trade Route 5
- 5.6 Trade Policy Impact Assessment
- 5.6.1 US Anti-Dumping & Section 301 Tariffs
- 5.6.2 EU Customs Union Impact
- 5.6.3 Major Free Trade Agreements
- 5.6.4 USMCA Rules of Origin
Note: Trade policy analysis will be included only where relevant to the Marine Energy market.
Chapter 6. Competitive Landscape & Company Benchmarking
- 6.1 Marine Energy Market Concentration & Structure
- 6.1.1 Herfindahl-Hirschman Index (HHI) – vs. 2024
- 6.1.2 Tier 1, Tier 2 & Tier 3 Market Structure
- 6.1.3 Global, Regional & Local Player Dynamics
- 6.2 Marine Energy Market Share Analysis – 2024
- 6.2.1 Global Revenue Share by Company
- 6.2.2 Global Volume Share by Company
- 6.2.3 Regional Revenue Share
- 6.2.4 Market Share Evolution ( vs. 2024)
- 6.2.5 OEM Segment Share by Company
- 6.2.6 Replacement Segment Share by Company
- 6.3 Production/Delivery Capacity & Facility Analysis
- 6.3.1 Global Installed Capacity
- 6.3.2 Capacity Utilization Rates
- 6.3.3 Production/Output Volume
- 6.3.4 Facility Locations & Capacity Map
- 6.3.5 Planned Capacity Additions
- 6.4 Marine Energy Competitive Benchmarking Matrix
- 6.4.1 Revenue, Volume, CAGR & Profitability Comparison
- 6.4.2 Channel Revenue Mix
- 6.4.3 Geographic Revenue Exposure
- 6.4.4 R&D Intensity
- 6.4.5 Sustainability Maturity
- 6.5 Strategic Developments in Marine Energy (Last 24 Months)
- 6.5.1 Mergers, Acquisitions & Divestments
- 6.5.2 New Marine Energy Launches
- 6.5.3 Facility Expansions
- 6.5.4 Strategic Alliances, Joint Ventures & Partnerships
- 6.5.5 Distribution Expansion & Market Entry
- 6.5.6 Sustainability & ESG Initiatives
- 6.6 Competitive Strategy Mapping
- 6.6.1 Leader, Challenger, Follower & Niche Classification
- 6.6.2 Pricing Strategy Comparison
- 6.6.3 Channel Strategy Matrix
Note: Strategic developments are included based on their materiality and the availability of reliable information.
Chapter 7. Global Marine Energy Market – By Distribution Channel
- 7.1 Segment Overview
- 7.1.1 Volume & Revenue Split by Channel (2024 & 2032)
- 7.1.2 Channel Mix Evolution (2024-2032)
Chapter 8. Regional Market Analysis – Global Overview
- 8.1 Global Regional Overview
- 8.1.1 Regional Volume Share
- 8.1.2 Regional Revenue Share
- 8.1.3 Regional Volume by Region
- 8.1.4 Regional Revenue by Region
- 8.1.5 Regional Forecast Through 2032
- 8.2 Cross-Regional Segment Analysis
- 8.2.1 By Distribution Channel
- 8.2.2 By Brand/Price Tier
Chapter 9. North America Marine Energy Market
- 9.1 United States
- 9.2 Canada
- 9.3 Mexico
Chapter 10. Europe Marine Energy Market
- 10.1 Germany
- 10.2 France
- 10.3 Italy
- 10.4 United Kingdom
- 10.5 Spain
- 10.6 Poland
- 10.7 Russia
- 10.8 Netherlands
- 10.9 Belgium
- 10.10 Sweden
- 10.11 Denmark
- 10.12 Norway
- 10.13 Rest of Europe
Chapter 11. Asia Pacific Marine Energy Market
- 11.1 China
- 11.2 India
- 11.3 Japan
- 11.4 South Korea
- 11.5 Thailand
- 11.6 Indonesia
- 11.7 Vietnam
- 11.8 Malaysia
- 11.9 Australia
- 11.10 Rest of Asia Pacific
Chapter 12. Latin America Marine Energy Market
- 12.1 Brazil
- 12.2 Argentina
- 12.3 Colombia
- 12.4 Chile
- 12.5 Rest of Latin America
Chapter 13. Middle East Marine Energy Market
- 13.1 Saudi Arabia
- 13.2 United Arab Emirates
- 13.3 Turkey
- 13.4 Israel
- 13.5 Iran
- 13.6 Rest of the Middle East
Chapter 14. Africa Marine Energy Market
- 14.1 South Africa
- 14.2 Egypt
- 14.3 Nigeria
- 14.4 Morocco
- 14.5 Rest of Africa
Chapter 15. Marine Energy Company Profiles
- 15.1 [Company 01]
- 15.1.1 Company Overview
- 15.1.2 Key Management Personnel
- 15.1.3 Products & Services Portfolio
- 15.1.4 Financial Performance
- 15.1.5 Key Market Focus & Geographic Presence
- 15.1.6 Recent Developments & Strategic Initiatives
Note: The company profile list is preliminary and may change based on research findings, market developments, data availability, and client requirements.
Chapter 16. Appendices
- Appendix A – List of Abbreviations & Acronyms
- Appendix B – Industry Classification Code Reference – Full Series
- Appendix C – Production & Capacity Data Tables
- Appendix D – End-Use & Demand Base Tables
- Appendix E – Consumption & Replacement Rate Assumptions
- Appendix F – ASP Reference Tables
- Appendix G – Manufacturing & Facility Database
- Appendix H – Import-Export Data Tables
- Appendix I – Regulatory Summary Tables
- Appendix J – Primary Research Participant List (Anonymized)
- Appendix K – Primary Research Questionnaire Framework
- Appendix L – Data Sources & Bibliography
- Appendix M – Market Size Divergence & Source Comparison
Chapter 17. Research Methodology
- 17.1 Research Framework & Philosophy
- 17.2 Secondary Research – Sources, Hierarchy & Data Extraction
- 17.3 Data Modeling – Bottom-Up & Top-Down Market Sizing
- 17.4 Primary Research – Stakeholder Framework, LOI & Sample Sizes
- 17.5 Forecast Methodology – Regression, Scenario & Sensitivity Analysis
- 17.6 Quality Control – Four-Layer Validation Framework
- 17.7 Limitations & Standard Assumptions
- 17.8 Disclaimer
