
Market Overview:
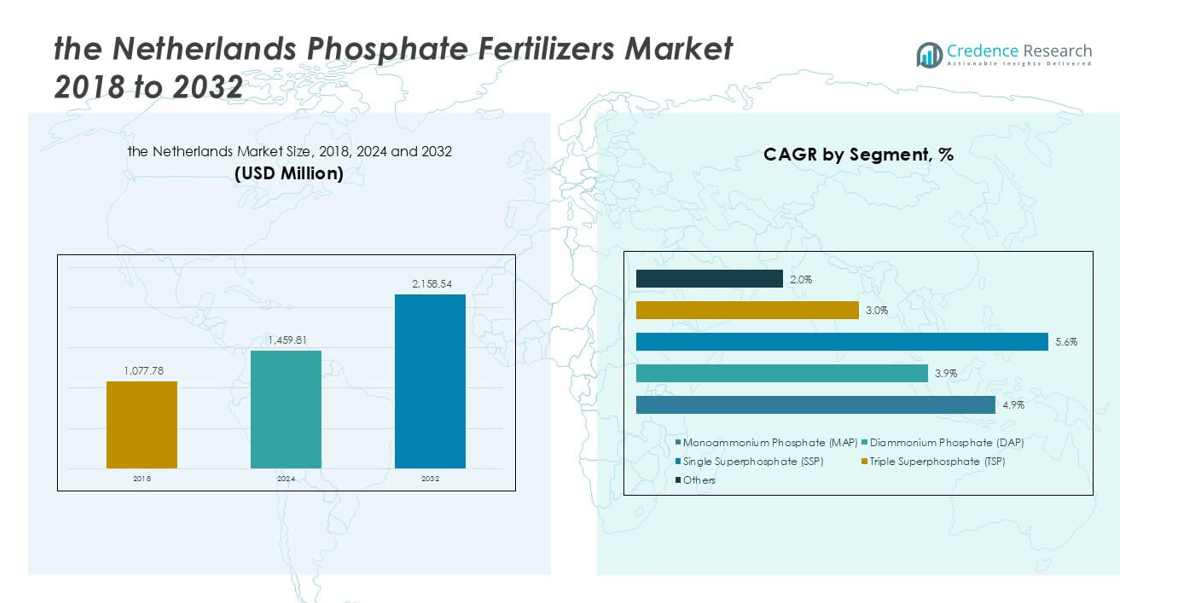
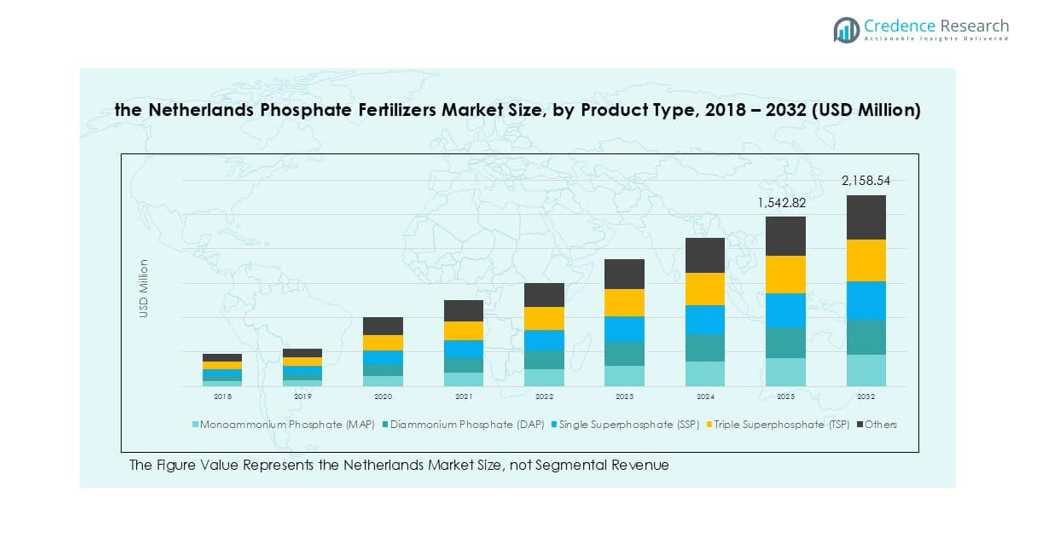
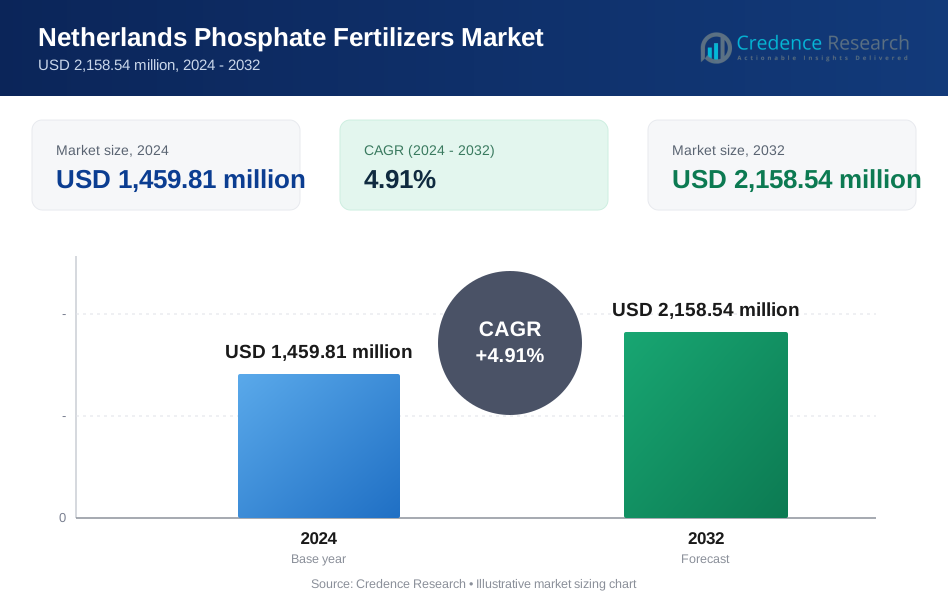
The Netherlands Phosphate Fertilizers market size was valued at USD 1,077.78 million in 2018 to USD 1,459.81 million in 2024 and is anticipated to reach USD 2,158.54 million by 2032, at a CAGR of 4.91% during the forecast period.
| REPORT ATTRIBUTE | DETAILS |
|---|---|
| Historical Period | 2020-2023 |
| Base Year | 2024 |
| Forecast Period | 2025-2032 |
| Netherlands Phosphate Fertilizers Market Size 2024 | USD 1,459.81 million |
| Netherlands Phosphate Fertilizers Market, CAGR | 4.91% |
| Netherlands Phosphate Fertilizers Market Size 2032 | USD 2,158.54 million |
The Netherlands phosphate fertilizers market is led by key players such as Yara International, EuroChem Group, ICL Group Ltd., BASF SE, OCI Nitrogen, Nutrien Ltd., CF Industries Holdings, K+S AG, Helm AG, and COMPO Expert GmbH. These companies focus on supplying high-efficiency MAP, DAP, and water-soluble fertilizers tailored for precision agriculture and greenhouse farming. West Netherlands holds the largest share at 38%, driven by intensive horticulture and export-oriented production. South Netherlands follows with 27%, supported by mixed farming and strong livestock sectors. Strategic partnerships, digital crop nutrition tools, and sustainable formulations strengthen competitiveness across these regions.
Market Insights
- The Netherlands phosphate fertilizers market was valued at USD 1,459.81 million in 2024 and is projected to reach USD 2,158.54 million by 2032, growing at a CAGR of 4.91%.
- Rising demand for high-value crops, greenhouse farming, and precision agriculture drives consumption of MAP and DAP fertilizers, supporting yield improvement and sustainable farming goals.
- Key trends include adoption of water-soluble fertilizers, fertigation systems, and variable-rate application technologies that optimize nutrient use and minimize phosphorus losses.
- Leading players such as Yara International, EuroChem Group, and ICL Group dominate through strong distribution networks, R&D investments, and digital advisory platforms, offering specialized products for Dutch farmers.
- West Netherlands holds 38% share, followed by South Netherlands with 27%; cereals & grains lead applications with 45% share, reflecting strong phosphate demand for wheat, barley, and maize production.
Market Segmentation Analysis:
By Product Type
Monoammonium Phosphate (MAP) dominates the Netherlands phosphate fertilizers market, accounting for over 40% share in 2024. Its high solubility and balanced phosphorus-nitrogen ratio support strong demand in intensive farming systems. MAP is preferred for precision agriculture and greenhouse applications due to its compatibility with fertigation. Diammonium Phosphate (DAP) follows, driven by large-scale field applications in grain cultivation. Single Superphosphate (SSP) and Triple Superphosphate (TSP) maintain niche use, mainly in crops requiring sulfur supplementation. Growth is supported by rising adoption of water-soluble fertilizers and sustainable farming practices in Dutch agriculture.
- For instance, OCI Nitrogen produced 25,000 metric tons of SSP for onion and sugar beet growers in Zeeland in 2024.
By Application
Cereals & grains lead the market, representing nearly 45% of total phosphate fertilizer use in 2024. High phosphate demand in wheat, barley, and maize production drives this dominance. Farmers rely on phosphate fertilizers to improve root development, yield, and nutrient uptake. Oilseeds hold a notable share as rapeseed and sunflower cultivation expands with biofuel demand. Fruits & vegetables see steady growth supported by greenhouse farming and horticultural exports. The shift toward high-value crops and adoption of precision farming techniques strengthen phosphate fertilizer consumption across applications.
- For instance, in 2023, the Netherlands harvested an estimated 1.1 million metric tons of wheat. Phosphate fertilizer application rates vary by soil type, crop, and the soil's existing phosphate content, with arable land rates being around 40 kg P₂O₅/ha as of 2021.
Market Overview
Rising Demand for High-Value Crops
The Netherlands phosphate fertilizers market grows with strong demand for high-value crops like vegetables, fruits, and flowers. Dutch farmers rely on phosphate-based fertilizers to boost root development, flowering, and nutrient absorption. Greenhouse farming and precision agriculture expand phosphate consumption across controlled environments. This driver is strengthened by the country’s position as a leading exporter of horticultural products. Increasing focus on quality yields and consistent supply to international markets continues to push phosphate fertilizer use, supporting market growth during the forecast period.
- For instance, in 2023, Dutch greenhouse cultivation covered approximately 10,150 hectares, a decrease from previous years due to economic factors like high energy costs. Phosphate application rates in this fertigation systems vary considerably based on the crop, growth stage, and nutrient management strategy, rather than conforming to a single average figure.
Expansion of Sustainable Farming Practices
Sustainable agriculture adoption drives phosphate fertilizer consumption in the Netherlands. Farmers increasingly favor water-soluble and efficient phosphate fertilizers to reduce nutrient loss and enhance soil productivity. Government programs promoting balanced fertilization and precision farming technologies further support this trend. MAP and DAP fertilizers are widely applied in fertigation systems to optimize nutrient delivery. Growing awareness of environmental impact and regulatory compliance encourages efficient fertilizer use. This shift sustains demand for high-quality phosphate fertilizers tailored to low-carbon, resource-efficient agricultural systems.
- For instance, the Dutch government and its partners have allocated hundreds of millions of euros for various sustainable agriculture initiatives, including those addressing soil health and nutrient efficiency.
Supportive Government and EU Policies
Government and EU policies play a major role in strengthening phosphate fertilizer demand. Programs supporting soil fertility management and crop productivity encourage the balanced application of phosphorus. EU Common Agricultural Policy incentives and national sustainability initiatives push farmers to adopt modern nutrient management practices. These policies ensure stable demand while guiding farmers toward environmentally compliant fertilizers. The availability of subsidies and research-backed recommendations increases adoption rates of MAP, DAP, and TSP fertilizers, enabling steady growth for the Netherlands phosphate fertilizers market.
Key Trends & Opportunities
Adoption of Precision Agriculture Technologies
Precision farming is transforming phosphate fertilizer usage in the Netherlands. GPS-guided equipment, variable rate application systems, and soil testing technologies enable targeted phosphorus application. This reduces waste and optimizes nutrient efficiency, supporting higher yields with lower input costs. Fertigation and drip irrigation systems also gain traction, increasing demand for water-soluble phosphate fertilizers. These innovations align with sustainability goals and help farmers comply with strict nutrient management regulations, offering significant opportunities for suppliers of advanced phosphate-based products.
- For instance, Lely has continued to expand its digital farm management software, Horizon, and its circular manure system, Sphere, among Dutch dairy farms. The Sphere system, in particular, is designed to separate manure and convert nitrogen emissions into valuable fertilizer components, which helps farmers manage mineral cycles to comply with strict Dutch environmental regulations, such as those related to the Manure and Fertilizer Act.
Growth in Greenhouse and Horticulture Sector
The Netherlands maintains a global leadership position in greenhouse farming, which drives phosphate fertilizer demand. Greenhouses require consistent and controlled nutrient supply, making water-soluble MAP and DAP the preferred products. Rising exports of vegetables, flowers, and ornamental plants sustain high fertilizer consumption. Technological advancements in hydroponics and automated fertigation create opportunities for fertilizer companies to develop specialized solutions. This trend ensures steady demand growth across horticultural production, strengthening the overall phosphate fertilizers market.
Key Challenges
Stringent Environmental Regulations
The Netherlands enforces strict phosphorus management rules to protect water quality and prevent eutrophication. Farmers face limitations on phosphorus application rates, which can restrict fertilizer use. Compliance requires investment in soil testing, nutrient planning, and precision application technologies. These regulations create pressure on suppliers to develop low-runoff and highly efficient fertilizers. Companies must innovate to meet both productivity and sustainability requirements, which can raise production costs and affect market margins.
Price Volatility of Raw Materials
Fluctuations in phosphate rock and ammonia prices impact production costs for fertilizers. Global supply chain disruptions and geopolitical tensions can create unpredictable pricing trends. This volatility affects farmers’ purchasing decisions and may lead to reduced fertilizer application in cost-sensitive periods. Manufacturers face pressure to manage procurement costs and maintain competitive pricing. Stable supply agreements and diversification of sourcing remain critical to mitigating risks and ensuring consistent product availability in the Netherlands market.
Regional Analysis
West Netherlands
West Netherlands leads with 38% market share. Greenhouse clusters in Westland drive MAP and DAP demand. Horticulture exports require precise fertigation and water-soluble grades. Flevoland’s arable farms add steady bulk phosphate use. Ports and blending facilities improve logistics and pricing stability. Sustainability programs encourage variable-rate phosphorus applications. Suppliers target premium greenhouse formulations and advisory services.
South Netherlands
South Netherlands holds 27% share. Mixed farming supports broad product portfolios, including TSP and SSP. Brabant’s pig and dairy sectors require nutrient planning compliance. Limburg’s maize and sugar beet acreage sustains basal phosphate demand. Zeeland benefits from proximity to import terminals. Precision spreaders and soil testing reduce losses and boost efficiency. Vendors emphasize compliant, high-efficiency blends.
East Netherlands
East Netherlands accounts for 20% share. Dairy grasslands and maize rotations anchor phosphate needs. Growers adopt MAP for root vigor and early growth. Conservation tillage expands targeted placement practices. Advisory agencies promote balanced P applications and runoff control. Local co-ops coordinate seasonal procurement and storage. Demand favors reliable, agronomy-backed offerings.
North Netherlands
North Netherlands represents 15% share. Large arable fields in Groningen use bulk MAP and DAP. Potato and cereal rotations rely on starter phosphorus. Friesland’s dairy farms tighten phosphorus budgets under regulations. Drenthe’s sandy soils require careful timing and placement. Farmers invest in VRA tools and tissue testing. Distributors compete on logistics and technical support.
Market Segmentations:
By Product Type:
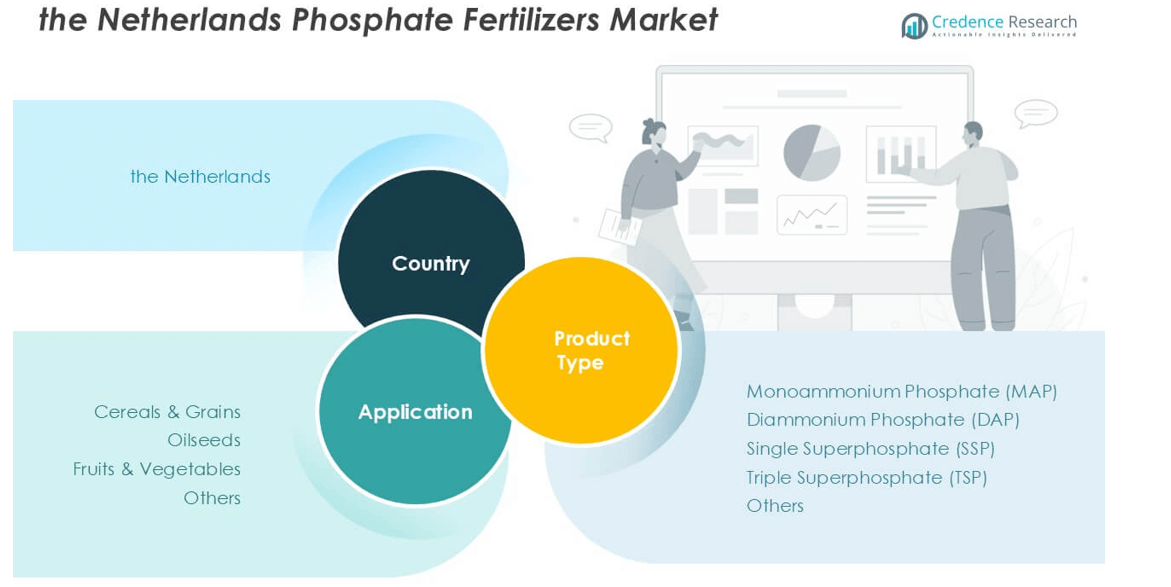
- Monoammonium Phosphate (MAP)
- Diammonium Phosphate (DAP)
- Single Superphosphate (SSP)
- Triple Superphosphate (TSP)
- Others
By Application:
- Cereals & Grains
- Oilseeds
- Fruits & Vegetables
- Others
By Geography:
- West Netherlands (Noord-Holland, Zuid-Holland, Utrecht, Flevoland)
- South Netherlands (Zeeland, Noord-Brabant, Limburg)
- East Netherlands (Gelderland, Overijssel)
- North Netherlands (Groningen, Friesland, Drenthe)
Competitive Landscape
The Netherlands phosphate fertilizers market features a mix of global producers and regional suppliers focusing on efficiency, innovation, and sustainability. Major players such as Yara International, EuroChem Group, ICL Group Ltd., BASF SE, OCI Nitrogen, Nutrien Ltd., CF Industries Holdings, K+S AG, Helm AG, and COMPO Expert GmbH dominate the market with strong distribution networks and advanced production facilities. Companies invest in water-soluble fertilizers and precision-application solutions to meet the country’s high standards for sustainable farming. Collaborations with agricultural cooperatives and technology providers enhance advisory services and farmer outreach. R&D efforts target improved nutrient efficiency, reduced runoff, and compliance with EU phosphorus directives. Competitive focus also includes digital platforms that offer real-time crop nutrition recommendations. Continuous capacity optimization, strategic imports through Dutch ports, and product innovation enable suppliers to strengthen market presence while addressing rising demand for greenhouse-grade and high-efficiency phosphate fertilizers.
Key Player Analysis
- Yara International
- EuroChem Group
- ICL Group Ltd
- BASF SE
- OCI Nitrogen (OCI NV)
- Nutrien Ltd.
- CF Industries Holdings
- K+S AG
- Helm AG
- COMPO Expert GmbH
Recent Developments
- In December 2023, Yara announced that it is acquiring the organic-based fertilizer business of Agribios, a company in Italy. The acquisition includes a production facility in Ronco all’Adige, focused on sustainable farming solutions through organic-based and organo-mineral fertilizers. This deal aligns with Yara’s strategy to expand its offerings in regenerative agriculture, complementing its current mineral fertilizer portfolio.
- In May 2022, Coromandel International, a fertilizer manufacturer, plans to buy a 45% stake in Baobab Mining and Chemicals Corporation (BMCC), a rock phosphate mining firm based in Senegal Africa, for $19.6 million (approximately $150 crore).
- In May 2022, Indian Potash Ltd signed a five-year agreement with Israel Chemical Ltd to import 0.6-0.65 million tonnes of potash muriate annually.
- In February 2022, EuroChem Group (hereafter referred to as "EuroChem" or "the Group"), a leading global producer of fertilizer, recently announced that it had completed the acquisition of the Serra do Salitre phosphate project in Brazil
Report Coverage
The research report offers an in-depth analysis based on Product Type, Application and Geography. It details leading market players, providing an overview of their business, product offerings, investments, revenue streams, and key applications. Additionally, the report includes insights into the competitive environment, SWOT analysis, current market trends, as well as the primary drivers and constraints. Furthermore, it discusses various factors that have driven market expansion in recent years. The report also explores market dynamics, regulatory scenarios, and technological advancements that are shaping the industry. It assesses the impact of external factors and global economic changes on market growth. Lastly, it provides strategic recommendations for new entrants and established companies to navigate the complexities of the market.
Future Outlook
- The market will grow steadily with rising adoption of precision farming techniques.
- Demand for MAP and DAP will increase due to greenhouse and horticulture expansion.
- Water-soluble fertilizers will gain more share with fertigation and drip irrigation adoption.
- Digital advisory platforms will help farmers optimize phosphorus application efficiency.
- Sustainability initiatives will push development of low-runoff and eco-friendly fertilizer formulations.
- Research collaborations will focus on improving nutrient-use efficiency and soil health.
- Government policies will continue supporting balanced fertilization and compliance with EU directives.
- Regional dominance of West Netherlands will persist with strong horticulture production.
- Cereals and grains will remain the leading application segment driving phosphate use.
- Companies will invest in innovation and distribution partnerships to strengthen market presence.
Request a Free Sample
Fill in your details and we'll send you a free sample report.
- Sample data tables & charts
- Research methodology
Need a Custom Version of This Report?
Tailor the scope, geography, or segments to your exact requirements.
- Custom geography or segment scope
- Direct access to our analyst team
Frequently Asked Questions
What is the current market size for The Netherlands Phosphate Fertilizers market, and what is its projected size in 2032?
At what Compound Annual Growth Rate is the The Netherlands Phosphate Fertilizers market projected to grow between 2025 and 2032?
Which The Netherlands Phosphate Fertilizers market segment held the largest share in 2024?
What are the primary factors fueling the growth of the The Netherlands Phosphate Fertilizers market?
Who are the leading companies in the The Netherlands Phosphate Fertilizers market?
Table of Content
Chapter 1. Report Introduction
- 1.1 Report Description & Purpose
- 1.1.1 Report Title & Market Definition
- 1.1.2 Unique Selling Propositions (USP) & Key Differentiators
- 1.1.3 Value Proposition for Stakeholders
- 1.2 Research Objectives
- 1.2.1 Market Sizing Objectives (Volume & Revenue)
- 1.2.2 Segmentation Objectives
- 1.2.3 Competitive Intelligence Objectives
- 1.2.4 Forecast & Scenario Objectives
- 1.3 Report Scope
- 1.3.1 Netherlands Phosphate Fertilizers Scope – Types & Subtypes Covered
- 1.3.2 Geographic Scope – Regions & Countries Covered
- 1.3.3 Historical Period, Base Year & Forecast Period (2024; forecast to 2032)
- 1.3.4 Inclusions & Exclusions
- 1.4 HS Code & Classification Framework
- 1.5 Currency, Units & Pricing Basis
- 1.6 Target Stakeholders
- 1.7 Limitations & Assumptions
Chapter 2. Executive Summary
- 2.1 Global Netherlands Phosphate Fertilizers Market Snapshot
- 2.1.1 Market Size – Historical (2024) & Forecast (2024-2032) (2024: USD 1,459.81 million → 2032: USD 2,158.54 million)
- 2.1.2 Volume & Revenue – Global Totals
- 2.1.3 Key Market Highlights – Top Five Facts
- 2.2 Netherlands Phosphate Fertilizers Market Segmentation Snapshot
- 2.2.1 Market Split by Region – 2024 vs. 2032
- 2.3 Competitive Snapshot
- 2.3.1 Top 10 Players by Revenue Share – 2024
- 2.3.2 Top 10 Players by Volume Share – 2024
- 2.3.3 Recent Strategic Developments (18-Month Summary)
- 2.4 Key Investment Highlights & Strategic Conclusions
Chapter 3. Netherlands Phosphate Fertilizers Market Dynamics & Industry Analysis
- 3.1 Market Overview & Context
- 3.1.1 Netherlands Phosphate Fertilizers Market Position in the Broader Automotive Value Chain
- 3.1.2 OEM vs. Replacement Market Dynamics
- 3.1.3 Market Maturity & Development Stage by Region
- 3.2 Netherlands Phosphate Fertilizers Market Drivers
- 3.3 Netherlands Phosphate Fertilizers Market Restraints & Challenges
- 3.4 Netherlands Phosphate Fertilizers Market Opportunities
- 3.5 Porter's Five Forces Analysis
- 3.5.1 Threat of New Entrants
- 3.5.2 Bargaining Power of Suppliers
- 3.5.3 Bargaining Power of Buyers
- 3.5.4 Threat of Substitutes
- 3.5.5 Competitive Rivalry – Intensity Assessment
- 3.6 Netherlands Phosphate Fertilizers Value Chain Analysis
- 3.6.1 Upstream – Raw Material/Input Suppliers
- 3.6.1.1 Raw Material/Input 1
- 3.6.1.2 Raw Material/Input 2
- 3.6.1.3 Raw Material/Input 3
- 3.6.2 Midstream – Production/Manufacturing/Service Delivery
- 3.6.2.1 Production/Process Overview
- 3.6.2.2 Key Facility Locations & Capacity by Manufacturer
- 3.6.3 Downstream – Distribution & End Consumer
- 3.6.3.1 Primary Channel – B2B/OEM
- 3.6.3.2 Secondary Channels – Dealer, Retail, Online, Direct
- 3.6.4 Value Chain Profitability Analysis
- 3.6.1 Upstream – Raw Material/Input Suppliers
- 3.7 PESTEL Analysis
- 3.7.1 Political Factors
- 3.7.2 Economic Factors
- 3.7.3 Social Factors
- 3.7.4 Technological Factors
- 3.7.5 Environmental Factors
- 3.7.6 Legal Factors
- 3.8 Netherlands Phosphate Fertilizers Supply Chain Analysis
- 3.8.1 Raw Material/Input Supply Risk Assessment
- 3.8.2 Manufacturing Concentration Risk (Geographic Exposure)
- 3.8.3 Trade Disruption Impact Analysis
- 3.9 Regulatory & Policy Landscape
Note: The regulatory and policy landscape section covers regulations based on their applicability to the market, Netherlands Phosphate Fertilizers category, geography, and scope of the study. Only regulatory frameworks with a material impact on operations, compliance, trade, sustainability, or market access are analyzed in detail.
Chapter 4. Key Investment Pockets & Opportunity Analysis
- 4.1 Netherlands Phosphate Fertilizers Market Attractiveness Analysis
- 4.1.1 By Region – Investment Attractiveness Matrix (Volume × CAGR)
- 4.2 Absolute Revenue Growth Opportunity
- 4.2.1 By Region – Absolute USD Growth Through 2032
- 4.3 Incremental Volume Opportunity
- 4.3.1 By Region – Incremental Volume Through 2032
- 4.3.2 Segment – Incremental Volume
- 4.4 Emerging Submarket Opportunity Deep Dive (Subject to Applicability)
- 4.5 Emerging Market Opportunity Scorecards
- 4.5.1 United States
- 4.5.2 Europe
- 4.5.3 Asia
- 4.5.4 Middle East & Africa
Note: Emerging Market Opportunity Scorecards will be included based on relevance and strategic importance. Regions listed are indicative and may vary depending on data availability and market dynamics.
Chapter 5. Netherlands Phosphate Fertilizers Import-Export Analysis & Trade Flows
- 5.1 Global Trade Overview
- 5.1.1 Global Export Value by Country (2024)
- 5.1.2 Global Export Volume by Country (2024)
- 5.1.3 Global Import Value by Country (2024)
- 5.1.4 Global Import Volume by Country (2024)
- 5.1.5 Net Trade Balance by Country (2024)
- 5.2 Export Analysis – Segment
- 5.2.1 Type 1 (HS Code)
- 5.2.2 Type 2 (HS Code)
- 5.2.3 Type 3 (HS Code)
- 5.2.4 Type 4 (HS Code)
- 5.2.5 Type 5 (HS Code)
- 5.3 Import Analysis – Segment
- 5.3.1 Type 1 (HS Code)
- 5.3.2 Type 2 (HS Code)
- 5.3.3 Type 3 (HS Code)
- 5.3.4 Type 4 (HS Code)
- 5.3.5 Type 5 (HS Code)
- 5.4 Average Unit Trade Prices
- 5.4.1 Average Export Price – Segment & Country
- 5.4.2 Average Import Price – Segment & Source Country
- 5.4.3 Price Trends (2024)
- 5.5 Key Trade Route Analysis
- 5.5.1 Trade Route 1
- 5.5.2 Trade Route 2
- 5.5.3 Trade Route 3
- 5.5.4 Trade Route 4
- 5.5.5 Trade Route 5
- 5.6 Trade Policy Impact Assessment
- 5.6.1 US Anti-Dumping & Section 301 Tariffs
- 5.6.2 EU Customs Union Impact
- 5.6.3 Major Free Trade Agreements
- 5.6.4 USMCA Rules of Origin
Note: Trade policy analysis will be included only where relevant to the Netherlands Phosphate Fertilizers market.
Chapter 6. Competitive Landscape & Company Benchmarking
- 6.1 Netherlands Phosphate Fertilizers Market Concentration & Structure
- 6.1.1 Herfindahl-Hirschman Index (HHI) – vs. 2024
- 6.1.2 Tier 1, Tier 2 & Tier 3 Market Structure
- 6.1.3 Global, Regional & Local Player Dynamics
- 6.2 Netherlands Phosphate Fertilizers Market Share Analysis – 2024
- 6.2.1 Global Revenue Share by Company
- 6.2.2 Global Volume Share by Company
- 6.2.3 Regional Revenue Share
- 6.2.4 Market Share Evolution ( vs. 2024)
- 6.2.5 OEM Segment Share by Company
- 6.2.6 Replacement Segment Share by Company
- 6.3 Production/Delivery Capacity & Facility Analysis
- 6.3.1 Global Installed Capacity
- 6.3.2 Capacity Utilization Rates
- 6.3.3 Production/Output Volume
- 6.3.4 Facility Locations & Capacity Map
- 6.3.5 Planned Capacity Additions
- 6.4 Netherlands Phosphate Fertilizers Competitive Benchmarking Matrix
- 6.4.1 Revenue, Volume, CAGR & Profitability Comparison
- 6.4.2 Channel Revenue Mix
- 6.4.3 Geographic Revenue Exposure
- 6.4.4 R&D Intensity
- 6.4.5 Sustainability Maturity
- 6.5 Strategic Developments in Netherlands Phosphate Fertilizers (Last 24 Months)
- 6.5.1 Mergers, Acquisitions & Divestments
- 6.5.2 New Netherlands Phosphate Fertilizers Launches
- 6.5.3 Facility Expansions
- 6.5.4 Strategic Alliances, Joint Ventures & Partnerships
- 6.5.5 Distribution Expansion & Market Entry
- 6.5.6 Sustainability & ESG Initiatives
- 6.6 Competitive Strategy Mapping
- 6.6.1 Leader, Challenger, Follower & Niche Classification
- 6.6.2 Pricing Strategy Comparison
- 6.6.3 Channel Strategy Matrix
Note: Strategic developments are included based on their materiality and the availability of reliable information.
Chapter 7. Global Netherlands Phosphate Fertilizers Market – By Distribution Channel
- 7.1 Segment Overview
- 7.1.1 Volume & Revenue Split by Channel (2024 & 2032)
- 7.1.2 Channel Mix Evolution (2024-2032)
Chapter 8. Regional Market Analysis – Global Overview
- 8.1 Global Regional Overview
- 8.1.1 Regional Volume Share
- 8.1.2 Regional Revenue Share
- 8.1.3 Regional Volume by Region
- 8.1.4 Regional Revenue by Region
- 8.1.5 Regional Forecast Through 2032
- 8.2 Cross-Regional Segment Analysis
- 8.2.1 By Distribution Channel
- 8.2.2 By Brand/Price Tier
Chapter 9. North America Netherlands Phosphate Fertilizers Market
- 9.1 United States
- 9.2 Canada
- 9.3 Mexico
Chapter 10. Europe Netherlands Phosphate Fertilizers Market
- 10.1 Germany
- 10.2 France
- 10.3 Italy
- 10.4 United Kingdom
- 10.5 Spain
- 10.6 Poland
- 10.7 Russia
- 10.8 Netherlands
- 10.9 Belgium
- 10.10 Sweden
- 10.11 Denmark
- 10.12 Norway
- 10.13 Rest of Europe
Chapter 11. Asia Pacific Netherlands Phosphate Fertilizers Market
- 11.1 China
- 11.2 India
- 11.3 Japan
- 11.4 South Korea
- 11.5 Thailand
- 11.6 Indonesia
- 11.7 Vietnam
- 11.8 Malaysia
- 11.9 Australia
- 11.10 Rest of Asia Pacific
Chapter 12. Latin America Netherlands Phosphate Fertilizers Market
- 12.1 Brazil
- 12.2 Argentina
- 12.3 Colombia
- 12.4 Chile
- 12.5 Rest of Latin America
Chapter 13. Middle East Netherlands Phosphate Fertilizers Market
- 13.1 Saudi Arabia
- 13.2 United Arab Emirates
- 13.3 Turkey
- 13.4 Israel
- 13.5 Iran
- 13.6 Rest of the Middle East
Chapter 14. Africa Netherlands Phosphate Fertilizers Market
- 14.1 South Africa
- 14.2 Egypt
- 14.3 Nigeria
- 14.4 Morocco
- 14.5 Rest of Africa
Chapter 15. Netherlands Phosphate Fertilizers Company Profiles
- 15.1 [Company 01]
- 15.1.1 Company Overview
- 15.1.2 Key Management Personnel
- 15.1.3 Products & Services Portfolio
- 15.1.4 Financial Performance
- 15.1.5 Key Market Focus & Geographic Presence
- 15.1.6 Recent Developments & Strategic Initiatives
Note: The company profile list is preliminary and may change based on research findings, market developments, data availability, and client requirements.
Chapter 16. Appendices
- Appendix A – List of Abbreviations & Acronyms
- Appendix B – Industry Classification Code Reference – Full Series
- Appendix C – Production & Capacity Data Tables
- Appendix D – End-Use & Demand Base Tables
- Appendix E – Consumption & Replacement Rate Assumptions
- Appendix F – ASP Reference Tables
- Appendix G – Manufacturing & Facility Database
- Appendix H – Import-Export Data Tables
- Appendix I – Regulatory Summary Tables
- Appendix J – Primary Research Participant List (Anonymized)
- Appendix K – Primary Research Questionnaire Framework
- Appendix L – Data Sources & Bibliography
- Appendix M – Market Size Divergence & Source Comparison
Chapter 17. Research Methodology
- 17.1 Research Framework & Philosophy
- 17.2 Secondary Research – Sources, Hierarchy & Data Extraction
- 17.3 Data Modeling – Bottom-Up & Top-Down Market Sizing
- 17.4 Primary Research – Stakeholder Framework, LOI & Sample Sizes
- 17.5 Forecast Methodology – Regression, Scenario & Sensitivity Analysis
- 17.6 Quality Control – Four-Layer Validation Framework
- 17.7 Limitations & Standard Assumptions
- 17.8 Disclaimer
