
Market Overview:
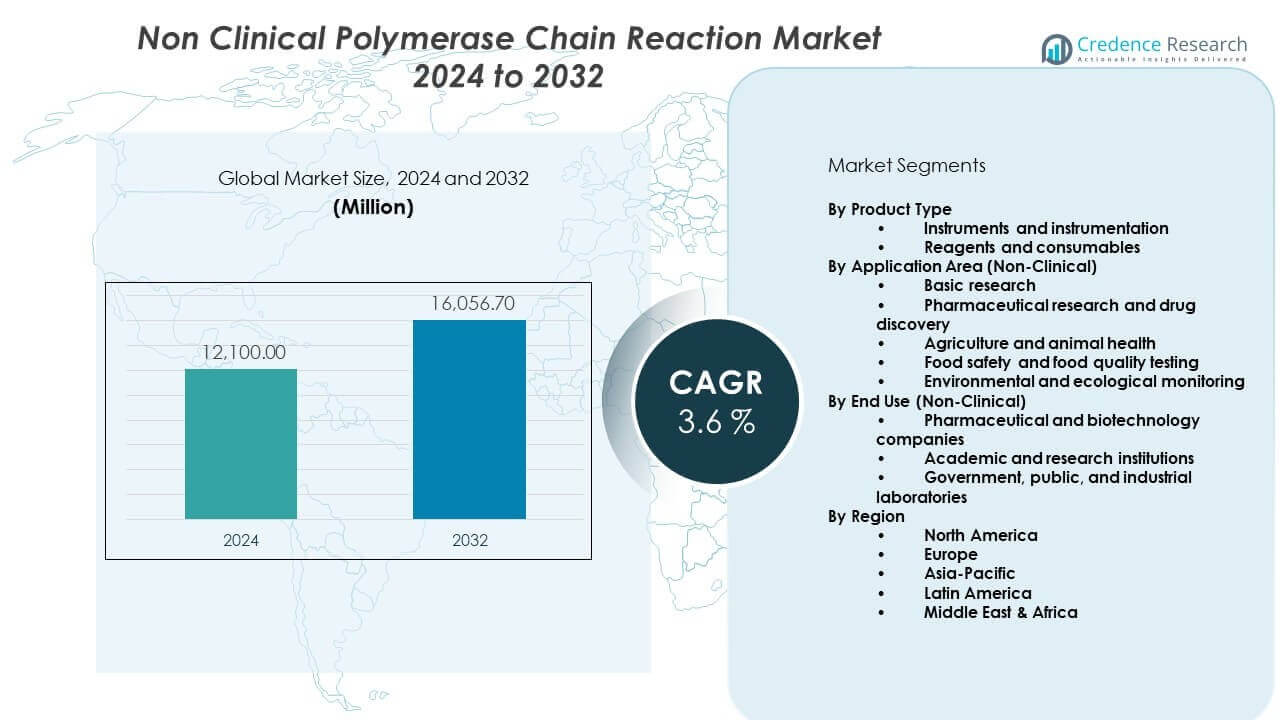
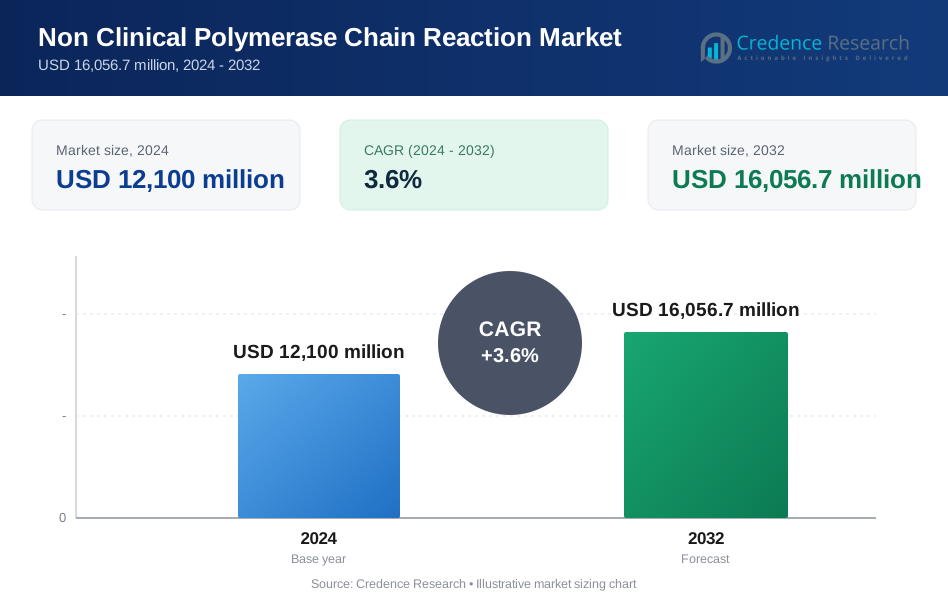
The Non clinical polymerase chain reaction market was valued at USD 12,100 million in 2024 and is projected to reach USD 16,056.7 million by 2032, registering a CAGR of 3.6% from 2024 to 2032.
| REPORT ATTRIBUTE | DETAILS |
|---|---|
| Historical Period | 2020-2023 |
| Base Year | 2024 |
| Forecast Period | 2025-2032 |
| Non Clinical Polymerase Chain Reaction Market Size 2024 | USD 12,100 million |
| Non Clinical Polymerase Chain Reaction Market, CAGR | 3.6% |
| Non Clinical Polymerase Chain Reaction Market Size 2032 | USD 16,056.7 million |
Market growth is driven by wide adoption of PCR across research and testing workflows. Pharmaceutical and biotechnology companies use non-clinical PCR for drug discovery and assay optimization. Academic institutions depend on PCR for gene analysis and molecular studies. Food safety testing supports demand through pathogen detection and quality checks. Environmental laboratories apply PCR in microbial and water analysis. Advances in automation improve throughput and reduce manual errors. Improved reagent stability supports repeat testing. Cost-effective kits increase adoption among smaller laboratories and research centers.
North America leads the market due to strong research infrastructure and high laboratory spending. The United States benefits from active biotechnology research and contract testing networks. Europe follows, supported by established academic institutions and regulated research practices. Germany and the United Kingdom remain major contributors. Asia Pacific is emerging rapidly with expanding research facilities. China and India gain momentum through government-backed research programs. Skilled talent availability strengthens regional growth. Latin America shows moderate expansion through public research efforts. The Middle East and Africa remain developing markets with long-term potential.
Market Insights:
- The Non-clinical polymerase chain reaction market stood at USD 12,100 million in 2024 and is projected to reach USD 16,056.7 million by 2032, expanding at a CAGR of 3.6% due to steady non-clinical research demand.
- North America leads with about 38% share, followed by Europe at 28% and Asia-Pacific at 24%, supported by strong research funding, mature lab infrastructure, and active pharmaceutical research ecosystems.
- Asia-Pacific is the fastest-growing region with nearly 24% share, driven by expanding research infrastructure, government funding, and rising biotechnology activity in China, India, Japan, and South Korea.
- By product type, reagents and consumables account for roughly 65% share due to repeat usage, while instruments and instrumentation hold about 35% driven by installed base expansion.
- By end use, pharmaceutical and biotechnology companies represent nearly 45% share, academic and research institutions around 35%, and government, public, and industrial laboratories close to 20%.
Market Drivers:
Expanding Use Of Molecular Testing In Research And Industrial Laboratories
The Non clinical polymerase chain reaction market gains strength from broad molecular testing use. Research laboratories rely on PCR for gene analysis and assay verification. Pharmaceutical companies apply PCR in early discovery workflows. Biotechnology firms use it for product development support. Food testing laboratories depend on PCR for pathogen screening. Environmental agencies apply PCR for microbial monitoring tasks. Contract research organizations expand PCR-based testing services. These applications ensure steady instrument and reagent demand.
- For instance, Thermo Fisher Scientific maintains a dominant market presence with an active global footprint of more than 75,000 Applied Biosystems PCR systems installed across research and industrial laboratories.
Rising Investment In Life Science Research And Development Programs
Public funding strengthens molecular research capabilities across institutions. Universities expand laboratory infrastructure for genetic studies. Government-backed programs support advanced biology research initiatives. Private firms invest in efficient research tools to shorten study timelines. PCR supports standardized and reproducible experimental outcomes. Research teams trust its accuracy across multiple studies. The Non clinical polymerase chain reaction market benefits from long-term funding stability. Continuous research activity sustains consistent system utilization.
- For instance, the U.S. National Institutes of Health allocated approximately $47.7 billion to biomedical research in 2023, with over 80% awarded as grants to external institutions.
Growing Demand For High Accuracy And Reproducibility In Testing Workflows
Laboratories require precise and repeatable molecular results. PCR delivers strong specificity for target detection. Quality assurance teams value dependable assay performance. Research credibility depends on consistent data output. Controlled amplification cycles support experimental accuracy. Validated protocols reduce variability across runs. Reliable workflows improve laboratory efficiency. This demand reinforces long-term PCR adoption.
Increasing Adoption Across Food Safety And Environmental Testing Segments
Food safety authorities rely on molecular tools for screening. PCR enables rapid detection of contaminants. Environmental laboratories monitor soil and water microbes using PCR. Regulatory oversight increases routine testing frequency. PCR supports standardized safety procedures. Rapid response capabilities improve contamination control. Broader application use expands market reach. Diverse testing needs sustain demand growth.
Market Trends:
Shift Toward Compact And Space-Efficient PCR Instrument Designs
Laboratories prefer compact PCR systems for space efficiency. Smaller instruments suit modern lab layouts. Manufacturers design bench-friendly PCR platforms. Portability supports shared and multi-site usage. Compact systems simplify installation processes. Energy-efficient designs lower operating strain. The Non clinical polymerase chain reaction market reflects this design evolution. Flexible placement supports changing laboratory needs.
- For instance, Bio-Rad states its CFX Opus 96 real-time PCR system occupies less than 0.2 square meters of bench space while supporting full 96-well throughput.
Growing Preference For Ready-To-Use And Pre-Mixed Reagent Kits
Laboratories favor simplified reagent preparation workflows. Pre-mixed kits reduce handling errors. Time savings improve daily testing throughput. Standardized formulations support repeat studies. Researchers value consistent reagent quality. Storage stability improves planning efficiency. Training requirements decline with simplified use. This trend supports smoother lab operations.
- For instance, QIAGEN reports that its QuantiFast PCR kits can reduce total PCR run times by up to 60% on standard cyclers.
Integration Of Digital Interfaces And Data Management Features
PCR platforms now include digital control systems. Touchscreen interfaces improve operator interaction. Data storage supports result traceability. Software tools assist experiment comparison. Digital logs help audit readiness. Automated data capture reduces manual entry. Laboratories prefer connected systems. Digital integration enhances workflow transparency.
Rising Demand For Multiplex And High-Throughput PCR Capabilities
Research projects require faster sample processing. Multiplex PCR detects multiple targets per run. High-throughput systems handle large sample volumes. Screening programs benefit from scale efficiency. Faster results improve research timelines. Productivity increases with parallel testing capacity. The Non clinical polymerase chain reaction market adapts to these needs. Efficiency-focused labs drive adoption.
Market Challenges Analysis:
High Equipment And Consumable Costs Affecting Budget-Constrained Laboratories
Advanced PCR systems require high capital investment. Smaller laboratories face funding constraints. Consumables add recurring operational expenses. Maintenance contracts raise ownership costs. Budget delays slow procurement decisions. Price sensitivity limits technology upgrades. The Non clinical polymerase chain reaction market faces adoption resistance here. Cost pressure remains a key challenge.
Need For Skilled Personnel And Strict Workflow Control Standards
PCR testing demands trained technical professionals. Skill gaps affect result reliability. Workflow deviations reduce data quality. Training programs require time and resources. Staff turnover disrupts lab consistency. Quality control needs strict oversight. Compliance requirements increase management effort. Operational complexity limits rapid scaling.
Market Opportunities:
Expansion Of Research Infrastructure In Emerging Economies
Emerging regions invest in scientific infrastructure growth. Governments support laboratory development programs. Universities expand molecular research departments. Local biotech firms increase research spending. PCR adoption improves research competitiveness. Workforce skill development strengthens lab output. The Non clinical polymerase chain reaction market gains new demand centers. Long-term potential remains strong.
Innovation In Cost-Efficient And Automated PCR Solutions
Manufacturers focus on affordable PCR technologies. Automation reduces dependence on skilled labor. Simplified workflows suit smaller laboratories. Cost-efficient reagents widen adoption scope. Scalable systems support gradual expansion. Innovation improves accessibility across regions. It supports broader application coverage. Technology progress opens new growth paths.
Market Segmentation Analysis:
By Product Type
Instruments and instrumentation form the technology backbone of PCR workflows. Thermal cyclers, real-time PCR, and digital PCR platforms support precise amplification and detection. Laboratories select systems based on throughput, sensitivity, and automation needs. Reagents and consumables represent the most recurrent demand area. Master mixes, enzymes, buffers, plastics, and assay kits support daily testing volumes. Frequent repeat purchases strengthen revenue stability. It benefits from protocol standardization across laboratories. Product differentiation focuses on accuracy and workflow reliability.
- For instance, Roche Diagnostics reports consumables form the majority of LightCycler system usage, with regular reagent reorders in high-throughput labs.
By Application Area (Non-Clinical)
Basic research uses PCR for gene expression, genotyping, and molecular studies. Pharmaceutical research and drug discovery apply PCR during target validation and preclinical screening. Agriculture and animal health rely on PCR for pathogen and GMO detection. Food safety and food quality testing use PCR to identify contamination and ensure traceability. Environmental and ecological monitoring applies PCR for water, soil, and biodiversity analysis. Each application values accuracy and repeatability. Workflow flexibility supports cross-sector adoption.
- For instance, Eurofins Scientific operates over 900 laboratories worldwide, conducting millions of non-clinical PCR tests annually across food, environmental, and research domains.
By End Use (Non-Clinical)
Pharmaceutical and biotechnology companies hold a leading share due to consistent research demand. These users integrate PCR across multiple development stages. Academic and research institutions rely on PCR for long-term experimental programs. Funding-backed projects support steady instrument utilization. Government, public, and industrial laboratories use PCR for regulatory and applied testing. These labs value standardized methods and compliance readiness. The Non clinical polymerase chain reaction market gains stability from this diversified end-use base.
Segmentation:
By Product Type
- Instruments and instrumentation
- Reagents and consumables
By Application Area (Non-Clinical)
- Basic research
- Pharmaceutical research and drug discovery
- Agriculture and animal health
- Food safety and food quality testing
- Environmental and ecological monitoring
By End Use (Non-Clinical)
- Pharmaceutical and biotechnology companies
- Academic and research institutions
- Government, public, and industrial laboratories
By Region
- North America
- U.S.
- Canada
- Mexico
- Europe
- Germany
- France
- U.K.
- Italy
- Spain
- Rest of Europe
- Asia Pacific
- China
- Japan
- India
- South Korea
- South-east Asia
- Rest of Asia Pacific
- Latin America
- Brazil
- Argentina
- Rest of Latin America
- Middle East & Africa
- GCC Countries
- South Africa
- Rest of the Middle East and Africa
Regional Analysis:
North America
North America holds the largest share of the Non clinical polymerase chain reaction market, accounting for about 38% of global demand. The United States drives regional dominance through strong pharmaceutical research and contract testing activity. Advanced laboratory infrastructure supports high PCR adoption across research fields. Academic institutions maintain steady instrument and reagent use. Food safety and environmental testing also support demand. Strong funding availability sustains long-term laboratory operations. It benefits from early technology adoption and standardized research practices.
Europe
Europe represents nearly 28% of the global market share. Countries such as Germany, the United Kingdom, and France lead regional demand. Well-established academic research networks support consistent PCR usage. Pharmaceutical research activity strengthens reagent and consumable demand. Regulatory emphasis on food safety and environmental monitoring supports routine testing. Government-funded research programs maintain stable laboratory workflows. It reflects mature adoption with steady replacement demand.
Asia-Pacific, Latin America, Middle East & Africa
Asia-Pacific accounts for around 24% of the market and shows the fastest growth pace. China, India, Japan, and South Korea expand molecular research capacity. Government investment in research infrastructure supports PCR adoption. Expanding biotech sectors strengthen demand across applications. Latin America holds about 6% share, supported by public research and food testing labs. The Middle East & Africa represent nearly 4% share, driven by gradual laboratory modernization. It shows long-term potential through expanding research and testing capacity.
Key Player Analysis:
- Thermo Fisher Scientific Inc.
- Hoffmann-La Roche Ltd
- Bio-Rad Laboratories, Inc.
- QIAGEN N.V.
- Abbott Laboratories
- Agilent Technologies, Inc.
- Danaher Corporation
- Becton, Dickinson and Company
- Merck KGaA
- bioMérieux SA
- Cytiva
- Takara Bio Inc.
- Standard BioTools
- Stilla Technologies
- JN Medsys
Competitive Analysis:
The Non clinical polymerase chain reaction market shows moderate consolidation, with a small group of global suppliers controlling core technologies. Leading players compete through instrument performance, reagent reliability, and workflow efficiency. Companies focus on broad portfolios that cover instruments, consumables, and software. Product quality and data accuracy drive buyer preference across research and industrial labs. Strong distribution networks support global reach. Strategic collaborations strengthen application-specific offerings. It reflects steady competition rather than aggressive price rivalry. Innovation pace remains consistent across major vendors.
Recent Developments:
- In November 2025, Danaher subsidiaries Integrated DNA Technologies (IDT) and Beckman Coulter Life Sciences formed a strategic partnership to automate IDT’s next-generation sequencing (NGS) and molecular assay solutions on the newly launched Biomek i3 Benchtop Liquid Handler. This collaboration is designed to provide research laboratories with scalable, automated workflows for oncology and genomic research, reducing manual processing time and improving data reproducibility.
- In October 2025, Thermo Fisher Scientific announced a strategic research and development (R&D) partnership with the AstraZeneca BioVentureHub in Sweden to drive innovation in the life science ecosystem. Under this collaboration, Thermo Fisher scientists will co-locate with AstraZeneca to work on joint projects focusing on molecular genomics, proteomics, and chromatography. Additionally, in July 2025, the company expanded its capabilities by acquiring Sanofi’s steriles manufacturing site in Ridgefield, New Jersey, to enhance its biopharma services and support customer demand for critical medicines.
- In October 2025, Agilent Technologies announced a partnership with SPT Labtech to automate target enrichment protocols for its SureSelect Max DNA Library Prep Kits on SPT’s firefly+ liquid handling platform. This collaboration aims to streamline genomic workflows for researchers by combining Agilent’s chemistry with automated solutions to address bottlenecks in sequencing and molecular analysis.
Report Coverage:
The research report offers an in-depth analysis based on By Product Type, By Application Area (Non-Clinical), and By End Use (Non-Clinical). It details leading market players, providing an overview of their business, product offerings, investments, revenue streams, and key applications. Additionally, the report includes insights into the competitive environment, SWOT analysis, current market trends, as well as the primary drivers and constraints. Furthermore, it discusses various factors that have driven market expansion in recent years. The report also explores market dynamics, regulatory scenarios, and technological advancements that are shaping the industry. It assesses the impact of external factors and global economic changes on market growth. Lastly, it provides strategic recommendations for new entrants and established companies to navigate the complexities of the market.
Future Outlook:
- Research laboratories will continue to rely on PCR for routine molecular analysis.
- Reagents and consumables will remain the primary revenue contributor due to repeat use.
- Automation adoption will increase to support higher sample throughput.
- Digital PCR platforms will gain wider use in non-clinical research settings.
- Food safety testing will sustain steady demand across public and private labs.
- Environmental monitoring will expand with stricter testing requirements.
- Emerging economies will invest further in molecular research infrastructure.
- Compact and modular PCR systems will gain preference in space-limited labs.
- Standardized workflows will influence long-term purchasing decisions.
- Vendor partnerships with research institutes will strengthen product adoption.
Request a Free Sample
Fill in your details and we'll send you a free sample report.
- Sample data tables & charts
- Research methodology
Need a Custom Version of This Report?
Tailor the scope, geography, or segments to your exact requirements.
- Custom geography or segment scope
- Direct access to our analyst team
Frequently Asked Questions
What is the current market size for Non-clinical polymerase chain reaction market, and what is its projected size in 2032?
At what Compound Annual Growth Rate is the Non-clinical polymerase chain reaction market projected to grow between 2025 and 2032?
Which Non clinical polymerase chain reaction market segment held the largest share in 2024?
What are the primary factors fueling the growth of the Non-clinical polymerase chain reaction market?
Table of Content
Chapter 1. Report Introduction
- 1.1 Report Description & Purpose
- 1.1.1 Report Title & Market Definition
- 1.1.2 Unique Selling Propositions (USP) & Key Differentiators
- 1.1.3 Value Proposition for Stakeholders
- 1.2 Research Objectives
- 1.2.1 Market Sizing Objectives (Volume & Revenue)
- 1.2.2 Segmentation Objectives
- 1.2.3 Competitive Intelligence Objectives
- 1.2.4 Forecast & Scenario Objectives
- 1.3 Report Scope
- 1.3.1 Non Clinical Polymerase Chain Reaction Scope – Types & Subtypes Covered
- 1.3.2 Geographic Scope – Regions & Countries Covered
- 1.3.3 Historical Period, Base Year & Forecast Period (2024; forecast to 2032)
- 1.3.4 Inclusions & Exclusions
- 1.4 HS Code & Classification Framework
- 1.5 Currency, Units & Pricing Basis
- 1.6 Target Stakeholders
- 1.7 Limitations & Assumptions
Chapter 2. Executive Summary
- 2.1 Global Non Clinical Polymerase Chain Reaction Market Snapshot
- 2.1.1 Market Size – Historical (2024) & Forecast (2024-2032) (2024: USD 12,100 million → 2032: USD 16,056.7 million)
- 2.1.2 Volume & Revenue – Global Totals
- 2.1.3 Key Market Highlights – Top Five Facts
- 2.2 Non Clinical Polymerase Chain Reaction Market Segmentation Snapshot
- 2.2.1 Market Split by Region – 2024 vs. 2032
- 2.3 Competitive Snapshot
- 2.3.1 Top 10 Players by Revenue Share – 2024
- 2.3.2 Top 10 Players by Volume Share – 2024
- 2.3.3 Recent Strategic Developments (18-Month Summary)
- 2.4 Key Investment Highlights & Strategic Conclusions
Chapter 3. Non Clinical Polymerase Chain Reaction Market Dynamics & Industry Analysis
- 3.1 Market Overview & Context
- 3.1.1 Non Clinical Polymerase Chain Reaction Market Position in the Broader Automotive Value Chain
- 3.1.2 OEM vs. Replacement Market Dynamics
- 3.1.3 Market Maturity & Development Stage by Region
- 3.2 Non Clinical Polymerase Chain Reaction Market Drivers
- 3.3 Non Clinical Polymerase Chain Reaction Market Restraints & Challenges
- 3.4 Non Clinical Polymerase Chain Reaction Market Opportunities
- 3.5 Porter's Five Forces Analysis
- 3.5.1 Threat of New Entrants
- 3.5.2 Bargaining Power of Suppliers
- 3.5.3 Bargaining Power of Buyers
- 3.5.4 Threat of Substitutes
- 3.5.5 Competitive Rivalry – Intensity Assessment
- 3.6 Non Clinical Polymerase Chain Reaction Value Chain Analysis
- 3.6.1 Upstream – Raw Material/Input Suppliers
- 3.6.1.1 Raw Material/Input 1
- 3.6.1.2 Raw Material/Input 2
- 3.6.1.3 Raw Material/Input 3
- 3.6.2 Midstream – Production/Manufacturing/Service Delivery
- 3.6.2.1 Production/Process Overview
- 3.6.2.2 Key Facility Locations & Capacity by Manufacturer
- 3.6.3 Downstream – Distribution & End Consumer
- 3.6.3.1 Primary Channel – B2B/OEM
- 3.6.3.2 Secondary Channels – Dealer, Retail, Online, Direct
- 3.6.4 Value Chain Profitability Analysis
- 3.6.1 Upstream – Raw Material/Input Suppliers
- 3.7 PESTEL Analysis
- 3.7.1 Political Factors
- 3.7.2 Economic Factors
- 3.7.3 Social Factors
- 3.7.4 Technological Factors
- 3.7.5 Environmental Factors
- 3.7.6 Legal Factors
- 3.8 Non Clinical Polymerase Chain Reaction Supply Chain Analysis
- 3.8.1 Raw Material/Input Supply Risk Assessment
- 3.8.2 Manufacturing Concentration Risk (Geographic Exposure)
- 3.8.3 Trade Disruption Impact Analysis
- 3.9 Regulatory & Policy Landscape
Note: The regulatory and policy landscape section covers regulations based on their applicability to the market, Non Clinical Polymerase Chain Reaction category, geography, and scope of the study. Only regulatory frameworks with a material impact on operations, compliance, trade, sustainability, or market access are analyzed in detail.
Chapter 4. Key Investment Pockets & Opportunity Analysis
- 4.1 Non Clinical Polymerase Chain Reaction Market Attractiveness Analysis
- 4.1.1 By Region – Investment Attractiveness Matrix (Volume × CAGR)
- 4.2 Absolute Revenue Growth Opportunity
- 4.2.1 By Region – Absolute USD Growth Through 2032
- 4.3 Incremental Volume Opportunity
- 4.3.1 By Region – Incremental Volume Through 2032
- 4.3.2 Segment – Incremental Volume
- 4.4 Emerging Submarket Opportunity Deep Dive (Subject to Applicability)
- 4.5 Emerging Market Opportunity Scorecards
- 4.5.1 United States
- 4.5.2 Europe
- 4.5.3 Asia
- 4.5.4 Middle East & Africa
Note: Emerging Market Opportunity Scorecards will be included based on relevance and strategic importance. Regions listed are indicative and may vary depending on data availability and market dynamics.
Chapter 5. Non Clinical Polymerase Chain Reaction Import-Export Analysis & Trade Flows
- 5.1 Global Trade Overview
- 5.1.1 Global Export Value by Country (2024)
- 5.1.2 Global Export Volume by Country (2024)
- 5.1.3 Global Import Value by Country (2024)
- 5.1.4 Global Import Volume by Country (2024)
- 5.1.5 Net Trade Balance by Country (2024)
- 5.2 Export Analysis – Segment
- 5.2.1 Type 1 (HS Code)
- 5.2.2 Type 2 (HS Code)
- 5.2.3 Type 3 (HS Code)
- 5.2.4 Type 4 (HS Code)
- 5.2.5 Type 5 (HS Code)
- 5.3 Import Analysis – Segment
- 5.3.1 Type 1 (HS Code)
- 5.3.2 Type 2 (HS Code)
- 5.3.3 Type 3 (HS Code)
- 5.3.4 Type 4 (HS Code)
- 5.3.5 Type 5 (HS Code)
- 5.4 Average Unit Trade Prices
- 5.4.1 Average Export Price – Segment & Country
- 5.4.2 Average Import Price – Segment & Source Country
- 5.4.3 Price Trends (2024)
- 5.5 Key Trade Route Analysis
- 5.5.1 Trade Route 1
- 5.5.2 Trade Route 2
- 5.5.3 Trade Route 3
- 5.5.4 Trade Route 4
- 5.5.5 Trade Route 5
- 5.6 Trade Policy Impact Assessment
- 5.6.1 US Anti-Dumping & Section 301 Tariffs
- 5.6.2 EU Customs Union Impact
- 5.6.3 Major Free Trade Agreements
- 5.6.4 USMCA Rules of Origin
Note: Trade policy analysis will be included only where relevant to the Non Clinical Polymerase Chain Reaction market.
Chapter 6. Competitive Landscape & Company Benchmarking
- 6.1 Non Clinical Polymerase Chain Reaction Market Concentration & Structure
- 6.1.1 Herfindahl-Hirschman Index (HHI) – vs. 2024
- 6.1.2 Tier 1, Tier 2 & Tier 3 Market Structure
- 6.1.3 Global, Regional & Local Player Dynamics
- 6.2 Non Clinical Polymerase Chain Reaction Market Share Analysis – 2024
- 6.2.1 Global Revenue Share by Company
- 6.2.2 Global Volume Share by Company
- 6.2.3 Regional Revenue Share
- 6.2.4 Market Share Evolution ( vs. 2024)
- 6.2.5 OEM Segment Share by Company
- 6.2.6 Replacement Segment Share by Company
- 6.3 Production/Delivery Capacity & Facility Analysis
- 6.3.1 Global Installed Capacity
- 6.3.2 Capacity Utilization Rates
- 6.3.3 Production/Output Volume
- 6.3.4 Facility Locations & Capacity Map
- 6.3.5 Planned Capacity Additions
- 6.4 Non Clinical Polymerase Chain Reaction Competitive Benchmarking Matrix
- 6.4.1 Revenue, Volume, CAGR & Profitability Comparison
- 6.4.2 Channel Revenue Mix
- 6.4.3 Geographic Revenue Exposure
- 6.4.4 R&D Intensity
- 6.4.5 Sustainability Maturity
- 6.5 Strategic Developments in Non Clinical Polymerase Chain Reaction (Last 24 Months)
- 6.5.1 Mergers, Acquisitions & Divestments
- 6.5.2 New Non Clinical Polymerase Chain Reaction Launches
- 6.5.3 Facility Expansions
- 6.5.4 Strategic Alliances, Joint Ventures & Partnerships
- 6.5.5 Distribution Expansion & Market Entry
- 6.5.6 Sustainability & ESG Initiatives
- 6.6 Competitive Strategy Mapping
- 6.6.1 Leader, Challenger, Follower & Niche Classification
- 6.6.2 Pricing Strategy Comparison
- 6.6.3 Channel Strategy Matrix
Note: Strategic developments are included based on their materiality and the availability of reliable information.
Chapter 7. Global Non Clinical Polymerase Chain Reaction Market – By Distribution Channel
- 7.1 Segment Overview
- 7.1.1 Volume & Revenue Split by Channel (2024 & 2032)
- 7.1.2 Channel Mix Evolution (2024-2032)
Chapter 8. Regional Market Analysis – Global Overview
- 8.1 Global Regional Overview
- 8.1.1 Regional Volume Share
- 8.1.2 Regional Revenue Share
- 8.1.3 Regional Volume by Region
- 8.1.4 Regional Revenue by Region
- 8.1.5 Regional Forecast Through 2032
- 8.2 Cross-Regional Segment Analysis
- 8.2.1 By Distribution Channel
- 8.2.2 By Brand/Price Tier
Chapter 9. North America Non Clinical Polymerase Chain Reaction Market
- 9.1 United States
- 9.2 Canada
- 9.3 Mexico
Chapter 10. Europe Non Clinical Polymerase Chain Reaction Market
- 10.1 Germany
- 10.2 France
- 10.3 Italy
- 10.4 United Kingdom
- 10.5 Spain
- 10.6 Poland
- 10.7 Russia
- 10.8 Netherlands
- 10.9 Belgium
- 10.10 Sweden
- 10.11 Denmark
- 10.12 Norway
- 10.13 Rest of Europe
Chapter 11. Asia Pacific Non Clinical Polymerase Chain Reaction Market
- 11.1 China
- 11.2 India
- 11.3 Japan
- 11.4 South Korea
- 11.5 Thailand
- 11.6 Indonesia
- 11.7 Vietnam
- 11.8 Malaysia
- 11.9 Australia
- 11.10 Rest of Asia Pacific
Chapter 12. Latin America Non Clinical Polymerase Chain Reaction Market
- 12.1 Brazil
- 12.2 Argentina
- 12.3 Colombia
- 12.4 Chile
- 12.5 Rest of Latin America
Chapter 13. Middle East Non Clinical Polymerase Chain Reaction Market
- 13.1 Saudi Arabia
- 13.2 United Arab Emirates
- 13.3 Turkey
- 13.4 Israel
- 13.5 Iran
- 13.6 Rest of the Middle East
Chapter 14. Africa Non Clinical Polymerase Chain Reaction Market
- 14.1 South Africa
- 14.2 Egypt
- 14.3 Nigeria
- 14.4 Morocco
- 14.5 Rest of Africa
Chapter 15. Non Clinical Polymerase Chain Reaction Company Profiles
- 15.1 [Company 01]
- 15.1.1 Company Overview
- 15.1.2 Key Management Personnel
- 15.1.3 Products & Services Portfolio
- 15.1.4 Financial Performance
- 15.1.5 Key Market Focus & Geographic Presence
- 15.1.6 Recent Developments & Strategic Initiatives
Note: The company profile list is preliminary and may change based on research findings, market developments, data availability, and client requirements.
Chapter 16. Appendices
- Appendix A – List of Abbreviations & Acronyms
- Appendix B – Industry Classification Code Reference – Full Series
- Appendix C – Production & Capacity Data Tables
- Appendix D – End-Use & Demand Base Tables
- Appendix E – Consumption & Replacement Rate Assumptions
- Appendix F – ASP Reference Tables
- Appendix G – Manufacturing & Facility Database
- Appendix H – Import-Export Data Tables
- Appendix I – Regulatory Summary Tables
- Appendix J – Primary Research Participant List (Anonymized)
- Appendix K – Primary Research Questionnaire Framework
- Appendix L – Data Sources & Bibliography
- Appendix M – Market Size Divergence & Source Comparison
Chapter 17. Research Methodology
- 17.1 Research Framework & Philosophy
- 17.2 Secondary Research – Sources, Hierarchy & Data Extraction
- 17.3 Data Modeling – Bottom-Up & Top-Down Market Sizing
- 17.4 Primary Research – Stakeholder Framework, LOI & Sample Sizes
- 17.5 Forecast Methodology – Regression, Scenario & Sensitivity Analysis
- 17.6 Quality Control – Four-Layer Validation Framework
- 17.7 Limitations & Standard Assumptions
- 17.8 Disclaimer
