
North America Bioprocess Technology Market Overview:
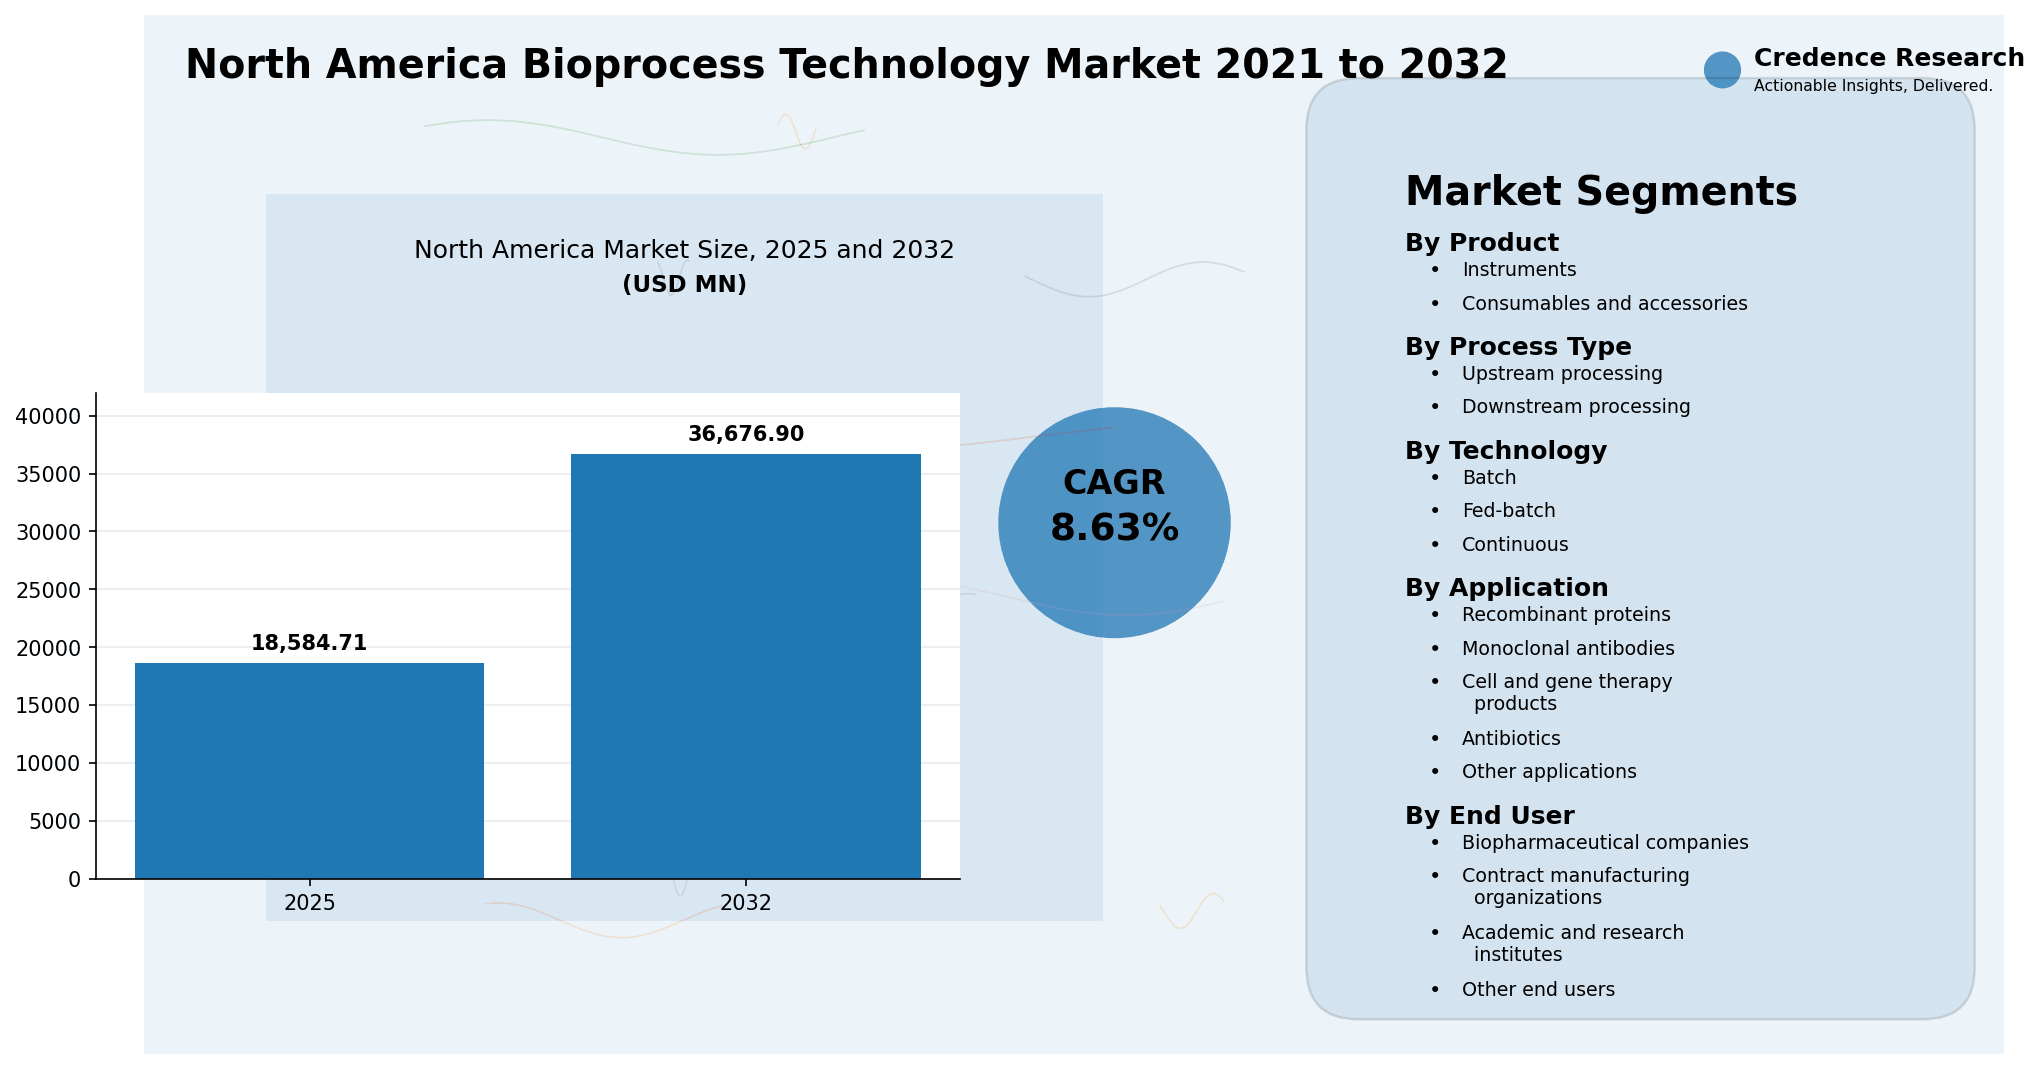
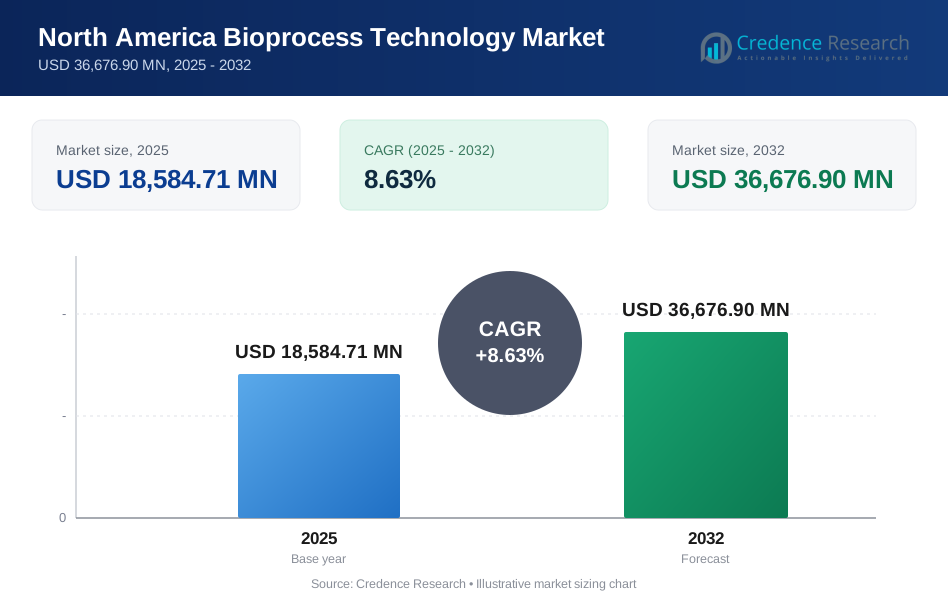
The North America Bioprocess Technology Market size was valued at USD 13,243.48 MN in 2021 and reached USD 18,584.71 MN in 2025. It is anticipated to reach USD 36,676.90 MN by 2032, growing at a CAGR of 8.63% during the forecast period.
| REPORT ATTRIBUTE | DETAILS |
|---|---|
| Historical Period | 2021-2024 |
| Base Year | 2025 |
| Forecast Period | 2025-2032 |
| North America Bioprocess Technology Market Size 2025 | USD 18,584.71 million |
| North America Bioprocess Technology Market, CAGR | 8.63% |
| North America Bioprocess Technology Market Size 2032 | USD 36,676.90 million |
North America Bioprocess Technology Market Insights
- Market growth is supported by biologics manufacturing expansion, monoclonal antibody demand, cell and gene therapy scale-up, single-use bioprocessing adoption and rising contract manufacturing activity.
- Consumables & Accessories hold a strong position because upstream and downstream workflows require recurring use of filters, tubing, bags, media, buffers, chromatography resins and single-use assemblies.
- Upstream Processing remains a major process area due to expanding cell culture, fermentation, media preparation and bioreactor operations for biologics and advanced therapies.
- Biopharmaceutical Companies remain the leading end users because they invest heavily in biomanufacturing capacity, process intensification, quality systems and commercial-scale production.
North America Bioprocess Technology Market Segment Insights
By product
By product, Consumables & Accessories held a strong position in 2025 because bioprocess workflows depend on recurring purchases across upstream and downstream operations. Biopharmaceutical Companies and Contract Manufacturing Organizations use filters, single-use bags, tubing, connectors, chromatography consumables, culture media, reagents and sampling components across development and commercial manufacturing. Instruments remain critical for bioreactors, fermenters, centrifuges, chromatography systems, filtration systems, analyzers and automated handling platforms. Demand for instruments is shaped by capacity expansion, process automation and adoption of continuous and intensified workflows. The market will favor suppliers that combine reliable consumables, validated instruments, service support and scalable platform technologies.
By process type
By process type, Upstream Processing held a strong position in 2025 because biologics manufacturing depends on cell culture, fermentation, seed train development, media preparation and bioreactor performance. Upstream systems directly affect yield, productivity and batch consistency, making them critical for recombinant proteins, monoclonal antibodies and cell and gene therapy products. Downstream Processing remains equally strategic because purification, filtration, chromatography, concentration and formulation determine product quality and process economics. Growth in monoclonal antibodies and complex biologics increases demand for high-capacity downstream platforms. The market will benefit from technologies that improve yield, reduce processing time and support regulatory-grade manufacturing.
By technology
By technology, Fed-Batch held a strong position in 2025 because it remains widely used in commercial biologics manufacturing and offers a balance between productivity, process control and operational familiarity. Batch processing remains relevant in development, legacy manufacturing, antibiotics and selected biologics workflows where process simplicity and regulatory history support continued use. Continuous bioprocessing is gaining momentum as manufacturers seek higher productivity, smaller facility footprints and better process consistency. Continuous approaches are especially relevant for intensified upstream production, perfusion culture and integrated downstream processing. Adoption will depend on validation requirements, process control, workforce readiness and regulatory confidence.
By application
By application, Monoclonal Antibodies held the strongest position in 2025 because they represent one of the largest biologics manufacturing categories and require extensive upstream and downstream processing capacity. Recombinant Proteins continue to support demand across therapeutic proteins, enzymes, vaccines and specialty biologics. Cell & Gene Therapy Products are expected to grow quickly because manufacturers need specialized media, viral vector production tools, closed systems, cell expansion platforms and quality-control workflows. Antibiotics remain relevant in selected fermentation and downstream applications. Other Applications include vaccines, biosimilars, antibody-drug conjugate inputs and emerging biologic formats that require flexible bioprocess platforms.
By end user
By end user, Biopharmaceutical Companies held the leading position in 2025 because they control large biologics pipelines, commercial manufacturing networks and quality systems. These companies invest in instruments, consumables, single-use technologies and automation to improve productivity and compliance. Contract Manufacturing Organizations are gaining share as drug developers outsource process development, clinical manufacturing and commercial production. Academic & Research Institutes support early-stage demand for smaller-scale bioreactors, analytical systems, media and research consumables. Other End Users include government laboratories, diagnostic manufacturers and specialty biotechnology companies. Growth across end users will favor flexible platforms that can scale from research to commercial manufacturing.
Key market drivers
Biologics manufacturing capacity expansion
Biologics manufacturing capacity expansion represents a major growth driver for the North America Bioprocess Technology Market. Biopharmaceutical Companies and Contract Manufacturing Organizations are expanding production networks to support monoclonal antibodies, recombinant proteins, biosimilars and complex biologics. This expansion increases demand for upstream instruments, downstream systems, single-use consumables, automation platforms and quality-control tools. Localized production strategies also support investment in U.S. manufacturing sites and bioprocess-ready facilities.
FDA maintains a monthly Complete List of Licensed Products and Establishments, with information current as of June 30, 2026, reflecting the active regulatory base for licensed biologics and establishments in the U.S.; Thermo Fisher Scientific and Sanofi also expanded their strategic partnership in July 2025 to add U.S. drug product manufacturing capacity at Sanofi’s Ridgefield site.
Cell and gene therapy scale-up
Cell and gene therapy scale-up is strengthening demand for specialized bioprocess technologies across North America. These therapies require closed processing, viral vector production, cell expansion, sterile handling, cryopreservation, advanced analytics and validated manufacturing workflows. Bioprocess suppliers benefit as therapy developers move from clinical programs to commercial readiness and need scalable systems that improve robustness and reduce cost of goods. Contract Manufacturing Organizations also gain opportunities because many cell and gene therapy developers lack full in-house manufacturing capacity.
FDA maintains an approved cellular and gene therapy products list and issued May 2026 CMC flexibility guidance to help expedite development, review and patient access for safe and effective cell and gene therapy products; Lonza renewed commercial manufacturing for Genetix at its Houston cell and gene therapy site and launched Xcite AAV stable producer cell line technology to address gene therapy scalability, cost and process robustness.
Single-use bioprocessing adoption
Single-use bioprocessing adoption supports market growth as manufacturers seek faster facility setup, lower cleaning validation burden and greater operational flexibility. Single-use bags, tubing, connectors, filters, bioreactors and assemblies help reduce changeover time and support multi-product facilities. These systems are valuable for clinical manufacturing, biologics development and contract manufacturing because they improve flexibility across product types and batch sizes. Demand is also supported by smaller-volume, high-value therapies where disposable systems reduce cross-contamination risk. However, users must manage supply assurance, extractables and leachables testing and waste-handling requirements. Suppliers with validated single-use portfolios and strong quality documentation will gain a competitive advantage.
Process intensification and continuous manufacturing
Process intensification and continuous manufacturing are driving investment in advanced bioprocess platforms. Manufacturers seek higher productivity, smaller facility footprints and improved consistency across upstream and downstream workflows. Fed-Batch remains widely used, but continuous processing is gaining attention in perfusion culture, integrated chromatography and real-time process control. These approaches can improve asset utilization and reduce cost per gram for selected biologics. Adoption depends on process understanding, regulatory strategy, automation maturity and workforce training. The trend will support demand for advanced instruments, sensors, analytics, control systems and scalable consumables through 2032.
Key Trends and Opportunities
Integrated upstream and downstream platforms gain traction
Integrated upstream and downstream platforms are becoming a major opportunity as manufacturers seek smoother technology transfer and faster process development. Bioprocess customers increasingly prefer connected platforms that reduce manual intervention and improve reproducibility from development to commercial scale. Integrated systems support better data capture, process monitoring and manufacturing efficiency. Suppliers that provide bioreactors, filtration, chromatography, analytics and consumables as linked workflow solutions can strengthen customer retention. These platforms are especially important for Contract Manufacturing Organizations that serve multiple clients and product types. The opportunity will remain strong as biologics pipelines become more diverse and operational timelines shorten.
Continuous bioprocessing adoption increases
Continuous bioprocessing adoption is increasing as manufacturers look for higher productivity, better process control and reduced facility footprint. Continuous technology can support higher cell densities, steady-state production and integrated purification for selected biologics. The approach is gaining attention in monoclonal antibodies, recombinant proteins and next-generation biologics. However, it requires advanced control systems, robust analytics and regulatory confidence. Suppliers that offer scalable, validated and automation-ready continuous processing tools will capture demand from advanced biomanufacturers. Growth will be strongest among companies seeking long-term cost reduction and higher manufacturing flexibility.
CMO and CDMO biomanufacturing demand expands
CMO and CDMO biomanufacturing demand is expanding as biotechnology companies outsource process development, clinical supply and commercial production. Outsourcing helps smaller drug developers reduce capital expenditure and access specialized expertise. CDMOs also support large biopharma companies by offering flexible capacity, specialized modalities and risk diversification. This creates demand for bioprocess instruments, consumables, automation, analytics and single-use systems across outsourced manufacturing sites. CDMOs are likely to remain major buyers because they must maintain flexible platforms across multiple customers and molecule types. Suppliers with service support and global quality documentation will benefit from this trend.
Key Market Challenges
High capital cost and validation burden
High capital cost and validation burden remain key challenges for the North America Bioprocess Technology Market. Commercial-scale bioprocess systems require major investment in instruments, automation, quality systems, facility design and operator training. Validation requirements can slow technology adoption, especially when manufacturers shift from established batch or fed-batch processes to intensified or continuous workflows. Customers must prove product quality, process consistency and regulatory compliance before implementing new systems at scale. These requirements can delay adoption of newer platforms. Suppliers that provide validation support, documentation and application expertise can reduce customer risk.
Supply chain dependence for critical consumables
Supply chain dependence for critical consumables can create operational risk. Bioprocess manufacturing relies on single-use assemblies, filters, media, resins, sensors, tubing and other components that must meet strict quality standards. Shortages or delays can disrupt clinical and commercial manufacturing schedules. Customers increasingly seek dual sourcing, stronger supplier qualification and better inventory planning. Suppliers must maintain robust production capacity and transparent quality systems to support high-value biologics manufacturing. This challenge will remain important as single-use adoption increases and production networks become more complex.
Workforce skill gaps and process complexity
Workforce skill gaps and process complexity can limit the speed of adoption for advanced bioprocess technologies. Continuous manufacturing, cell and gene therapy production, automation and process analytics require specialized technical skills. Facilities need trained teams who understand aseptic processing, quality systems, data integrity and regulatory expectations. Rapid modality growth can outpace availability of experienced operators, engineers and process scientists. Academic & Research Institutes and industry training programs will play a key role in workforce development. Companies that simplify workflows and provide strong training will be better positioned.
Regional Analysis
United States
The United States leads the North America Bioprocess Technology Market due to its large biopharmaceutical manufacturing base, strong biotech financing ecosystem, advanced research institutions and concentration of biologics and cell therapy developers. Demand is strong across Instruments, Consumables & Accessories, Upstream Processing and Downstream Processing because companies continue to build capacity for monoclonal antibodies, recombinant proteins and advanced therapies. The U.S. also has a deep CDMO base that supports process development, clinical manufacturing and commercial supply. Cell & Gene Therapy Products create high-value demand for closed systems, viral vector tools, analytics and specialized consumables. The United States is expected to remain the primary revenue contributor through 2032.
Canada
Canada represents a steady growth market supported by biotechnology research, public-private life science investment, vaccine and biologics manufacturing initiatives and academic research networks. Demand is concentrated in Biopharmaceutical Companies, Academic & Research Institutes and Contract Manufacturing Organizations. Upstream Processing and downstream purification tools are used across biologics development, recombinant protein work and advanced therapy research. Canada’s market benefits from skilled research talent and increasing interest in domestic biomanufacturing resilience. Growth will depend on commercial manufacturing scale-up, funding availability and partnerships with global life science suppliers.
Mexico
Mexico offers a smaller but emerging opportunity within North America. Demand is supported by pharmaceutical manufacturing, biosimilar interest, contract manufacturing potential and gradual modernization of laboratory and production infrastructure. Bioprocess technology adoption is strongest among larger pharmaceutical manufacturers, research institutions and selected service providers. Consumables & Accessories are likely to see steady demand because they support routine process development, analytical work and production workflows. Mexico’s growth will depend on investment in biologics capacity, regulatory modernization and workforce development. It is expected to remain a developing but relevant market through 2032.
Report Attribute Details
| Report Attribute | Details |
| Historical Period | 2021–2024 |
| Base Year | 2025 |
| Forecast Period | 2025–2032 |
| Market Size in 2021 | USD 13,243.48 MN |
| Market Size in 2025 | USD 18,584.71 MN |
| Market Size in 2032 | USD 36,676.90 MN |
| CAGR | 8.63% |
| Segments Covered | Product, Process Type, Technology, Application, End User and Geography |
| Key Companies Covered | Sartorius AG, Thermo Fisher Scientific Inc., Danaher Corporation, Merck KGaA, F. Hoffmann-La Roche Ltd, Cytiva (GE Healthcare Life Sciences), Eppendorf SE, Lonza Group AG, Bio-Rad Laboratories Inc., Getinge AB, Advanced Instruments LLC and Agilent Technologies Inc. |
North America Bioprocess Technology Market Segmentations
By Product- Instruments
- Consumables & Accessories
- Upstream Processing
- Downstream Processing
- Batch
- Fed-Batch
- Continuous
- Recombinant Proteins
- Monoclonal Antibodies
- Cell & Gene Therapy Products
- Antibiotics
- Other Applications
- Biopharmaceutical Companies
- Contract Manufacturing Organizations
- Academic & Research Institutes
- Other End Users
Key Players
- Sartorius AG
- Thermo Fisher Scientific Inc.
- Danaher Corporation
- Merck KGaA
- Hoffmann-La Roche Ltd
- Cytiva (GE Healthcare Life Sciences)
- Eppendorf SE
- Lonza Group AG
- Bio-Rad Laboratories Inc.
- Getinge AB
- Advanced Instruments LLC
- Agilent Technologies Inc.
Recent Developments
- In July 2025, Thermo Fisher Scientific and Sanofi expanded their strategic partnership to enable additional U.S. drug product manufacturing at Sanofi’s Ridgefield site, strengthening U.S. manufacturing capacity for pharmaceutical and biotech customers.
- In March 2026, Lonza and Genetix Biotherapeutics renewed a commercial manufacturing agreement for a gene therapy product at Lonza’s Houston, U.S., cell and gene therapy facility.
- In May 2026, Lonza launched Xcite AAV stable producer cell line technology to help gene therapy developers address scalability, cost of goods and process robustness.
- In 2025, Sartorius continued its long-term investment program and expanded global research and production infrastructure, including bioprocess technology capacity expansion activity.
Report Coverage
The research report offers an in-depth analysis based on product, process type, technology, application, end user and geography. It details leading market players, providing an overview of their business positioning, bioprocess portfolios, platform technologies, manufacturing capabilities and strategic relevance in the North America Bioprocess Technology Market. The report includes insights into the competitive environment, market trends, growth drivers, restraints and opportunities. It also examines biologics manufacturing capacity, cell and gene therapy scale-up, single-use adoption, process intensification, CDMO demand and continuous manufacturing as major factors shaping market development. The report assesses the impact of validation burden, supply chain dependence, workforce gaps and process complexity on market growth. It provides strategic recommendations for bioprocess suppliers, biopharmaceutical manufacturers, CDMOs, academic research institutes, investors and new entrants seeking to navigate North America’s biomanufacturing ecosystem.
Future Outlook
- Demand for bioprocess technologies will continue to rise as biologics, biosimilars, monoclonal antibodies and advanced therapies expand across North America.
- Consumables & Accessories will remain a major product category because recurring use supports upstream and downstream manufacturing workflows.
- Instruments will grow as facilities invest in advanced bioreactors, filtration systems, chromatography platforms, analyzers and automated processing tools.
- Upstream Processing will remain critical because cell culture productivity and process control directly influence biologics manufacturing economics.
- Downstream Processing will gain investment as complex biologics require efficient purification, filtration, concentration and formulation workflows.
- Fed-Batch will remain widely used in commercial biologics manufacturing, while Continuous technology will gain adoption in intensified and automated processes.
- Monoclonal Antibodies will remain a leading application due to large commercial pipelines and extensive manufacturing capacity needs.
- Cell & Gene Therapy Products will create high-value demand for closed systems, viral vector tools, cell expansion platforms and specialized consumables.
- Biopharmaceutical Companies will remain the leading end users, while Contract Manufacturing Organizations will gain share as outsourcing expands.
- Competition will increase as leading suppliers compete on single-use portfolios, process automation, continuous processing tools, quality documentation and service support.
Request a Free Sample
Fill in your details and we'll send you a free sample report.
- Sample data tables & charts
- Research methodology
Need a Custom Version of This Report?
Tailor the scope, geography, or segments to your exact requirements.
- Custom geography or segment scope
- Direct access to our analyst team
Frequently Asked Questions
What is the current market size for the North America Bioprocess Technology Market and what is its projected size in 2032?
At what CAGR is the North America Bioprocess Technology Market projected to grow?
Which product segment is expected to lead the market?
Which process type holds the strongest position?
Which application segment supports strong market demand?
Who are the leading companies in the market?
Which geography leads the North America market?
Table of Content
Chapter 1. Report Introduction
- 1.1 Report Description & Purpose
- 1.1.1 Report Title & Market Definition
- 1.1.2 Unique Selling Propositions (USP) & Key Differentiators
- 1.1.3 Value Proposition for Stakeholders
- 1.2 Research Objectives
- 1.2.1 Market Sizing Objectives (Volume & Revenue)
- 1.2.2 Segmentation Objectives
- 1.2.3 Competitive Intelligence Objectives
- 1.2.4 Forecast & Scenario Objectives
- 1.3 Report Scope
- 1.3.1 North America Bioprocess Technology Scope – Types & Subtypes Covered
- 1.3.2 Geographic Scope – Regions & Countries Covered
- 1.3.3 Historical Period, Base Year & Forecast Period (2025; forecast to 2032)
- 1.3.4 Inclusions & Exclusions
- 1.4 HS Code & Classification Framework
- 1.5 Currency, Units & Pricing Basis
- 1.6 Target Stakeholders
- 1.7 Limitations & Assumptions
Chapter 2. Executive Summary
- 2.1 Global North America Bioprocess Technology Market Snapshot
- 2.1.1 Market Size – Historical (2025) & Forecast (2025-2032) (2025: USD 18,584.71 MN → 2032: USD 36,676.90 MN)
- 2.1.2 Volume & Revenue – Global Totals
- 2.1.3 Key Market Highlights – Top Five Facts
- 2.2 North America Bioprocess Technology Market Segmentation Snapshot
- 2.2.1 Market Split by Region – 2025 vs. 2032
- 2.3 Competitive Snapshot
- 2.3.1 Top 10 Players by Revenue Share – 2025
- 2.3.2 Top 10 Players by Volume Share – 2025
- 2.3.3 Recent Strategic Developments (18-Month Summary)
- 2.4 Key Investment Highlights & Strategic Conclusions
Chapter 3. North America Bioprocess Technology Market Dynamics & Industry Analysis
- 3.1 Market Overview & Context
- 3.1.1 North America Bioprocess Technology Market Position in the Broader Automotive Value Chain
- 3.1.2 OEM vs. Replacement Market Dynamics
- 3.1.3 Market Maturity & Development Stage by Region
- 3.2 North America Bioprocess Technology Market Drivers
- 3.3 North America Bioprocess Technology Market Restraints & Challenges
- 3.4 North America Bioprocess Technology Market Opportunities
- 3.5 Porter's Five Forces Analysis
- 3.5.1 Threat of New Entrants
- 3.5.2 Bargaining Power of Suppliers
- 3.5.3 Bargaining Power of Buyers
- 3.5.4 Threat of Substitutes
- 3.5.5 Competitive Rivalry – Intensity Assessment
- 3.6 North America Bioprocess Technology Value Chain Analysis
- 3.6.1 Upstream – Raw Material/Input Suppliers
- 3.6.1.1 Raw Material/Input 1
- 3.6.1.2 Raw Material/Input 2
- 3.6.1.3 Raw Material/Input 3
- 3.6.2 Midstream – Production/Manufacturing/Service Delivery
- 3.6.2.1 Production/Process Overview
- 3.6.2.2 Key Facility Locations & Capacity by Manufacturer
- 3.6.3 Downstream – Distribution & End Consumer
- 3.6.3.1 Primary Channel – B2B/OEM
- 3.6.3.2 Secondary Channels – Dealer, Retail, Online, Direct
- 3.6.4 Value Chain Profitability Analysis
- 3.6.1 Upstream – Raw Material/Input Suppliers
- 3.7 PESTEL Analysis
- 3.7.1 Political Factors
- 3.7.2 Economic Factors
- 3.7.3 Social Factors
- 3.7.4 Technological Factors
- 3.7.5 Environmental Factors
- 3.7.6 Legal Factors
- 3.8 North America Bioprocess Technology Supply Chain Analysis
- 3.8.1 Raw Material/Input Supply Risk Assessment
- 3.8.2 Manufacturing Concentration Risk (Geographic Exposure)
- 3.8.3 Trade Disruption Impact Analysis
- 3.9 Regulatory & Policy Landscape
Note: The regulatory and policy landscape section covers regulations based on their applicability to the market, North America Bioprocess Technology category, geography, and scope of the study. Only regulatory frameworks with a material impact on operations, compliance, trade, sustainability, or market access are analyzed in detail.
Chapter 4. Key Investment Pockets & Opportunity Analysis
- 4.1 North America Bioprocess Technology Market Attractiveness Analysis
- 4.1.1 By Region – Investment Attractiveness Matrix (Volume × CAGR)
- 4.2 Absolute Revenue Growth Opportunity
- 4.2.1 By Region – Absolute USD Growth Through 2032
- 4.3 Incremental Volume Opportunity
- 4.3.1 By Region – Incremental Volume Through 2032
- 4.3.2 Segment – Incremental Volume
- 4.4 Emerging Submarket Opportunity Deep Dive (Subject to Applicability)
- 4.5 Emerging Market Opportunity Scorecards
- 4.5.1 United States
- 4.5.2 Europe
- 4.5.3 Asia
- 4.5.4 Middle East & Africa
Note: Emerging Market Opportunity Scorecards will be included based on relevance and strategic importance. Regions listed are indicative and may vary depending on data availability and market dynamics.
Chapter 5. North America Bioprocess Technology Import-Export Analysis & Trade Flows
- 5.1 Global Trade Overview
- 5.1.1 Global Export Value by Country (2025)
- 5.1.2 Global Export Volume by Country (2025)
- 5.1.3 Global Import Value by Country (2025)
- 5.1.4 Global Import Volume by Country (2025)
- 5.1.5 Net Trade Balance by Country (2025)
- 5.2 Export Analysis – Segment
- 5.2.1 Type 1 (HS Code)
- 5.2.2 Type 2 (HS Code)
- 5.2.3 Type 3 (HS Code)
- 5.2.4 Type 4 (HS Code)
- 5.2.5 Type 5 (HS Code)
- 5.3 Import Analysis – Segment
- 5.3.1 Type 1 (HS Code)
- 5.3.2 Type 2 (HS Code)
- 5.3.3 Type 3 (HS Code)
- 5.3.4 Type 4 (HS Code)
- 5.3.5 Type 5 (HS Code)
- 5.4 Average Unit Trade Prices
- 5.4.1 Average Export Price – Segment & Country
- 5.4.2 Average Import Price – Segment & Source Country
- 5.4.3 Price Trends (2025)
- 5.5 Key Trade Route Analysis
- 5.5.1 Trade Route 1
- 5.5.2 Trade Route 2
- 5.5.3 Trade Route 3
- 5.5.4 Trade Route 4
- 5.5.5 Trade Route 5
- 5.6 Trade Policy Impact Assessment
- 5.6.1 US Anti-Dumping & Section 301 Tariffs
- 5.6.2 EU Customs Union Impact
- 5.6.3 Major Free Trade Agreements
- 5.6.4 USMCA Rules of Origin
Note: Trade policy analysis will be included only where relevant to the North America Bioprocess Technology market.
Chapter 6. Competitive Landscape & Company Benchmarking
- 6.1 North America Bioprocess Technology Market Concentration & Structure
- 6.1.1 Herfindahl-Hirschman Index (HHI) – vs. 2025
- 6.1.2 Tier 1, Tier 2 & Tier 3 Market Structure
- 6.1.3 Global, Regional & Local Player Dynamics
- 6.2 North America Bioprocess Technology Market Share Analysis – 2025
- 6.2.1 Global Revenue Share by Company
- 6.2.2 Global Volume Share by Company
- 6.2.3 Regional Revenue Share
- 6.2.4 Market Share Evolution ( vs. 2025)
- 6.2.5 OEM Segment Share by Company
- 6.2.6 Replacement Segment Share by Company
- 6.3 Production/Delivery Capacity & Facility Analysis
- 6.3.1 Global Installed Capacity
- 6.3.2 Capacity Utilization Rates
- 6.3.3 Production/Output Volume
- 6.3.4 Facility Locations & Capacity Map
- 6.3.5 Planned Capacity Additions
- 6.4 North America Bioprocess Technology Competitive Benchmarking Matrix
- 6.4.1 Revenue, Volume, CAGR & Profitability Comparison
- 6.4.2 Channel Revenue Mix
- 6.4.3 Geographic Revenue Exposure
- 6.4.4 R&D Intensity
- 6.4.5 Sustainability Maturity
- 6.5 Strategic Developments in North America Bioprocess Technology (Last 24 Months)
- 6.5.1 Mergers, Acquisitions & Divestments
- 6.5.2 New North America Bioprocess Technology Launches
- 6.5.3 Facility Expansions
- 6.5.4 Strategic Alliances, Joint Ventures & Partnerships
- 6.5.5 Distribution Expansion & Market Entry
- 6.5.6 Sustainability & ESG Initiatives
- 6.6 Competitive Strategy Mapping
- 6.6.1 Leader, Challenger, Follower & Niche Classification
- 6.6.2 Pricing Strategy Comparison
- 6.6.3 Channel Strategy Matrix
Note: Strategic developments are included based on their materiality and the availability of reliable information.
Chapter 7. Global North America Bioprocess Technology Market – By Distribution Channel
- 7.1 Segment Overview
- 7.1.1 Volume & Revenue Split by Channel (2025 & 2032)
- 7.1.2 Channel Mix Evolution (2025-2032)
Chapter 8. Regional Market Analysis – Global Overview
- 8.1 Global Regional Overview
- 8.1.1 Regional Volume Share
- 8.1.2 Regional Revenue Share
- 8.1.3 Regional Volume by Region
- 8.1.4 Regional Revenue by Region
- 8.1.5 Regional Forecast Through 2032
- 8.2 Cross-Regional Segment Analysis
- 8.2.1 By Distribution Channel
- 8.2.2 By Brand/Price Tier
Chapter 9. North America North America Bioprocess Technology Market
- 9.1 United States
- 9.2 Canada
- 9.3 Mexico
Chapter 10. Europe North America Bioprocess Technology Market
- 10.1 Germany
- 10.2 France
- 10.3 Italy
- 10.4 United Kingdom
- 10.5 Spain
- 10.6 Poland
- 10.7 Russia
- 10.8 Netherlands
- 10.9 Belgium
- 10.10 Sweden
- 10.11 Denmark
- 10.12 Norway
- 10.13 Rest of Europe
Chapter 11. Asia Pacific North America Bioprocess Technology Market
- 11.1 China
- 11.2 India
- 11.3 Japan
- 11.4 South Korea
- 11.5 Thailand
- 11.6 Indonesia
- 11.7 Vietnam
- 11.8 Malaysia
- 11.9 Australia
- 11.10 Rest of Asia Pacific
Chapter 12. Latin America North America Bioprocess Technology Market
- 12.1 Brazil
- 12.2 Argentina
- 12.3 Colombia
- 12.4 Chile
- 12.5 Rest of Latin America
Chapter 13. Middle East North America Bioprocess Technology Market
- 13.1 Saudi Arabia
- 13.2 United Arab Emirates
- 13.3 Turkey
- 13.4 Israel
- 13.5 Iran
- 13.6 Rest of the Middle East
Chapter 14. Africa North America Bioprocess Technology Market
- 14.1 South Africa
- 14.2 Egypt
- 14.3 Nigeria
- 14.4 Morocco
- 14.5 Rest of Africa
Chapter 15. North America Bioprocess Technology Company Profiles
- 15.1 [Company 01]
- 15.1.1 Company Overview
- 15.1.2 Key Management Personnel
- 15.1.3 Products & Services Portfolio
- 15.1.4 Financial Performance
- 15.1.5 Key Market Focus & Geographic Presence
- 15.1.6 Recent Developments & Strategic Initiatives
Note: The company profile list is preliminary and may change based on research findings, market developments, data availability, and client requirements.
Chapter 16. Appendices
- Appendix A – List of Abbreviations & Acronyms
- Appendix B – Industry Classification Code Reference – Full Series
- Appendix C – Production & Capacity Data Tables
- Appendix D – End-Use & Demand Base Tables
- Appendix E – Consumption & Replacement Rate Assumptions
- Appendix F – ASP Reference Tables
- Appendix G – Manufacturing & Facility Database
- Appendix H – Import-Export Data Tables
- Appendix I – Regulatory Summary Tables
- Appendix J – Primary Research Participant List (Anonymized)
- Appendix K – Primary Research Questionnaire Framework
- Appendix L – Data Sources & Bibliography
- Appendix M – Market Size Divergence & Source Comparison
Chapter 17. Research Methodology
- 17.1 Research Framework & Philosophy
- 17.2 Secondary Research – Sources, Hierarchy & Data Extraction
- 17.3 Data Modeling – Bottom-Up & Top-Down Market Sizing
- 17.4 Primary Research – Stakeholder Framework, LOI & Sample Sizes
- 17.5 Forecast Methodology – Regression, Scenario & Sensitivity Analysis
- 17.6 Quality Control – Four-Layer Validation Framework
- 17.7 Limitations & Standard Assumptions
- 17.8 Disclaimer
