
Market Overview:
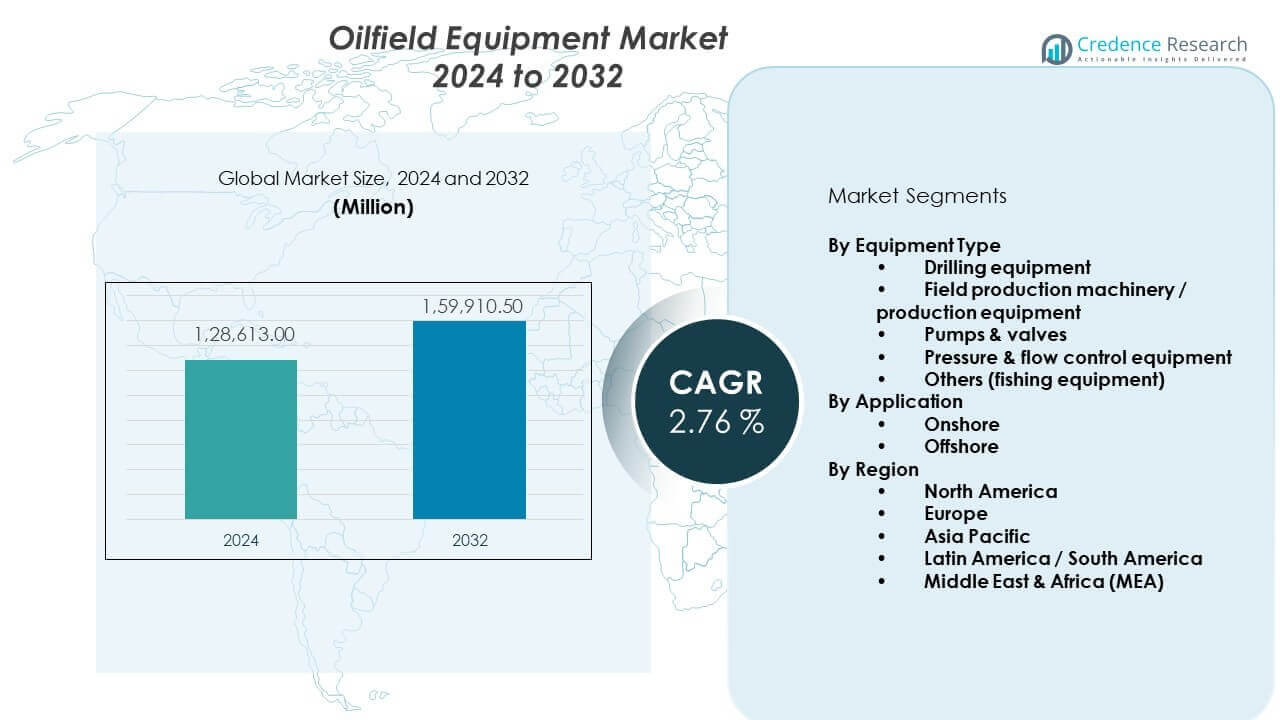
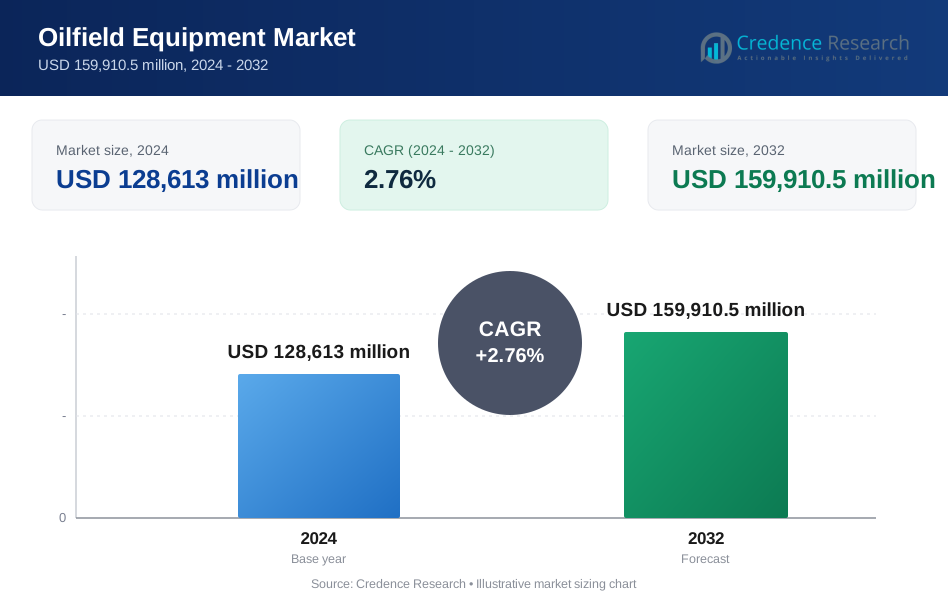
The Oilfield equipment market is projected to grow from USD 128,613 million in 2024 to an estimated USD 159,910.5 million by 2032, with a compound annual growth rate (CAGR) of 2.76% from 2024 to 2032.
| REPORT ATTRIBUTE | DETAILS |
|---|---|
| Historical Period | 2020-2023 |
| Base Year | 2024 |
| Forecast Period | 2025-2032 |
| Oilfield Equipment Market Size 2024 | USD 128,613 million |
| Oilfield Equipment Market, CAGR | 2.76% |
| Oilfield Equipment Market Size 2032 | USD 159,910.5 million |
Market growth is driven by rising drilling and production activity across onshore and offshore fields. Operators invest in advanced equipment to improve recovery rates and cut downtime. Aging oilfields increase demand for replacement tools and well servicing systems. Higher focus on operational safety supports adoption of reliable and automated equipment. Digital monitoring improves asset performance and reduces failures. National oil companies continue capacity expansion plans. Long-term supply contracts provide demand stability. Equipment standardization improves project execution speed.
North America leads the market due to strong shale production and active drilling programs. The United States drives demand through continuous rig activity and technology use. The Middle East remains a major contributor due to large-scale field development projects. Asia Pacific is emerging with new investments in China and India. Offshore growth supports equipment demand in Southeast Asia. Latin America shows steady progress, led by Brazil. Africa gains traction through upstream development in selected regions.
Market Insights:
- The Oilfield equipment market was valued at USD 128,613 million in 2024 and is projected to reach USD 159,910.5 million by 2032, growing at a CAGR of 2.76%.
- North America leads with about 35% share due to shale activity, followed by Asia Pacific at 22% from upstream expansion, and the Middle East & Africa at 20% supported by large field developments.
- Asia Pacific is the fastest-growing region with nearly 22% share, driven by investments in China, India, and offshore Southeast Asia.
- By equipment type, drilling equipment holds the largest share at around 40%, supported by continuous well development and replacement demand.
- By application, onshore operations dominate with nearly 65% share due to lower costs, faster project cycles, and wide field presence.
Market Drivers:
Rising Global Upstream Exploration And Production Investments
Oil and gas operators continue to expand upstream exploration programs across mature and frontier basins. The Oilfield equipment market benefits from higher rig counts and field development activity. National oil companies support long-term capacity expansion projects. Private operators focus on improving well productivity and output stability. Equipment demand rises across drilling, completion, and production stages. Offshore developments require specialized and high-specification systems. Long project cycles ensure recurring equipment procurement. Energy security goals sustain upstream capital allocation.
- For instance, SLB reported deployment of its PowerDrive Orbit RSS technology across more than 5,000 wells globally, helping operators achieve measurable drilling performance gains.
Growing Focus On Improving Operational Efficiency And Recovery Rates
Operators seek higher recovery from existing reservoirs through advanced equipment adoption. Enhanced oil recovery projects support demand for pumping and surface equipment. Automation helps reduce manual intervention and operational risk. Equipment upgrades improve well uptime and asset utilization. Data-driven tools support predictive maintenance strategies. Cost control initiatives push demand for durable and reliable systems. Equipment standardization supports faster deployment. These factors support steady replacement demand.
- For instance, Halliburton stated its SmartFleet fracturing systems have executed thousands of stages (or runs) across multiple basins, delivering consistent pressure control and operational efficiency improvements.
Expansion Of Offshore And Deepwater Field Development Projects
Deepwater investments continue across key offshore regions worldwide. Complex reservoirs require advanced subsea and pressure-control equipment. Offshore projects demand high-capacity drilling and completion tools. Safety regulations drive adoption of certified and robust systems. Project scale supports bulk equipment orders. Long field life ensures stable aftermarket demand. Service intensity remains high throughout production phases. Offshore growth sustains premium equipment demand.
Aging Oilfield Infrastructure Requiring Modernization And Replacement
Many producing fields operate with aging equipment and systems. Asset integrity concerns push replacement of critical components. Regulatory compliance requires updated safety and control equipment. Maintenance cycles shorten due to harsh operating conditions. Equipment failures increase production risks and losses. Operators prioritize reliability-focused procurement decisions. Modern equipment supports improved environmental performance. Infrastructure renewal sustains long-term market demand.
Market Trends:
Rising Adoption Of Digitalized And Smart Oilfield Equipment Systems
Digital integration gains momentum across oilfield operations. Sensors and control units enable real-time performance tracking. Smart equipment improves fault detection accuracy. Data analytics supports faster operational decisions. Remote monitoring reduces site visits and manpower needs. Digital tools support asset lifecycle optimization. Cyber-secure systems gain procurement priority. Technology adoption reshapes equipment design strategies.
- For instance, Baker Hughes confirmed its digital condition monitoring systems oversee more than 100,000 rotating assets globally, improving predictive maintenance outcomes.
Growing Preference For Modular And Portable Equipment Configurations
Operators favor modular equipment for flexible deployment. Portable systems support rapid field mobilization. Modular design reduces installation time and site disruption. Equipment reuse across projects improves capital efficiency. Compact layouts suit remote and constrained locations. Standard modules simplify maintenance procedures. Logistics efficiency improves through reduced transport complexity. This trend influences equipment manufacturing approaches.
- For instance, NOV Inc. supplies modular rig packages that support fast rig-up cycles and standardized maintenance across global onshore projects.
Shift Toward High-Specification Equipment For Harsh Operating Environments
Operations move into deeper, hotter, and high-pressure reservoirs. Equipment must withstand extreme mechanical stress. High-grade materials gain higher adoption rates. Certification standards shape procurement decisions. Equipment testing requirements grow stricter. Reliability becomes a key purchase criterion. Specialized equipment supports complex well designs. Harsh environment capability drives product differentiation.
Increasing Emphasis On Lifecycle Cost And Aftermarket Service Support
Buyers evaluate equipment based on total ownership cost. Long-term service contracts gain preference. Spare parts availability influences vendor selection. Predictive maintenance lowers unplanned downtime. Service response speed affects operational continuity. Equipment vendors expand aftermarket capabilities. Training services add customer value. Lifecycle focus reshapes supplier competition.
Market Challenges Analysis:
High Capital Cost Pressure And Volatile Investment Cycles
Oil and gas investments face cyclical budget constraints. Capital-intensive equipment limits smaller operator participation. Price volatility impacts project sanction timelines. Procurement delays affect equipment suppliers. Long payback periods increase financial risk. Cost sensitivity influences equipment specifications. Leasing options gain interest but limit margins. The Oilfield equipment market faces uneven demand cycles.
Complex Regulatory Compliance And Supply Chain Constraints
Regulatory standards differ across regions and projects. Certification processes extend equipment delivery timelines. Compliance costs raise manufacturing expenses. Supply chain disruptions affect raw material availability. Logistics delays impact offshore project schedules. Skilled labor shortages challenge installation timelines. Local content rules complicate sourcing strategies. These issues affect market execution efficiency.
Market Opportunities:
Expansion Of Emerging Oil-Producing Regions And New Basin Discoveries
Emerging regions invest in upstream development programs. New basin discoveries create fresh equipment demand. Governments support domestic production growth. Infrastructure build-out drives initial equipment procurement. Early-stage projects require full equipment suites. International partnerships bring technology transfer opportunities. Equipment suppliers gain first-mover advantages. Regional diversification reduces revenue concentration risks.
Rising Demand For Equipment Supporting Low-Emission And Efficient Operations
Operators focus on reducing emissions across oilfield operations. Energy-efficient equipment gains stronger adoption. Electrified systems reduce fuel consumption. Emission monitoring tools support compliance goals. Cleaner operations improve project approvals. Equipment innovation aligns with sustainability targets. Vendors invest in low-impact designs. This shift opens premium product opportunities.
Market Segmentation Analysis:
By Equipment Type
Drilling equipment forms a core segment due to sustained well development activity. Operators rely on advanced rigs and tools to improve drilling accuracy. Field production machinery supports stable output across mature and new fields. This equipment ensures efficient separation, lifting, and surface processing. Pumps and valves play a critical role in fluid movement and pressure regulation. These components support safety and flow reliability across operations. Pressure and flow control equipment gains demand from high-pressure reservoirs. Fishing equipment supports well intervention and recovery tasks. The Oilfield equipment market depends on balanced demand across these equipment categories.
- For instance, Weatherford reported deployment of thousands of pressure control and artificial lift systems across global fields.
By Application
Onshore applications dominate due to wide shale and conventional field presence. Operators favor onshore projects for lower cost and faster execution. Equipment demand remains steady across drilling and production stages. Maintenance cycles create repeat procurement needs. Offshore applications focus on deepwater and ultra-deepwater projects. These projects require high-specification and certified equipment. Offshore operations prioritize reliability and safety performance. Long project life supports strong aftermarket demand. Both applications drive equipment innovation and supplier competition.
- For instance, SLB has supplied subsea and offshore drilling systems across major deepwater developments in the Gulf of Mexico and Brazil, supporting long-term production operations.
Segmentation:
By Equipment Type
- Drilling equipment
- Field production machinery / production equipment
- Pumps & valves
- Pressure & flow control equipment
- Others (fishing equipment)
By Application
- Onshore
- Offshore
By Region
- North America
- U.S.
- Canada
- Mexico
- Europe
- Germany
- France
- U.K.
- Italy
- Spain
- Rest of Europe
- Asia Pacific
- China
- Japan
- India
- South Korea
- South-east Asia
- Rest of Asia Pacific
- Latin America
- Brazil
- Argentina
- Rest of Latin America
- Middle East & Africa
- GCC Countries
- South Africa
- Rest of the Middle East and Africa
Regional Analysis:
North America
North America holds the largest share of the Oilfield equipment market at around 35%. The United States drives demand through active shale drilling and field redevelopment. Operators invest in high-performance drilling and production equipment. Strong service infrastructure supports rapid equipment deployment. Canada contributes through oil sands and conventional projects. Technology adoption remains high across onshore operations. Stable capital spending supports consistent equipment replacement cycles.
Europe
Europe accounts for nearly 18% of the Oilfield equipment market share. Offshore activity in the North Sea sustains equipment demand. Mature fields require frequent upgrades and intervention tools. Strict safety and environmental standards influence procurement decisions. Norway and the United Kingdom lead regional spending. Equipment reliability remains a key purchase factor. Decommissioning activity also supports specialized equipment demand.
Asia Pacific, Latin America, And Middle East & Africa
Asia Pacific represents about 22% of the Oilfield equipment market share, led by China and India. National oil companies invest in upstream capacity expansion. Offshore projects in Southeast Asia support advanced equipment demand. The Middle East & Africa holds close to 20% share due to large-scale field developments. Gulf countries focus on long-term production stability. Latin America accounts for nearly 5%, driven by offshore Brazil and selective onshore projects. Emerging regions strengthen future demand outlook.
Key Player Analysis:
- SLB
- Baker Hughes
- Halliburton
- Weatherford
- NOV Inc.
Competitive Analysis:
The Oilfield equipment market features strong competition among global service and equipment providers. Large players focus on integrated portfolios across drilling, production, and flow control. Scale supports long-term contracts with national and international operators. Technology strength remains a key competitive factor. Digital tools improve equipment reliability and field efficiency. Global service networks support faster response times. Mid-sized players compete through niche specialization and regional focus. Pricing pressure influences procurement decisions across projects. Partnerships help expand geographic reach. The market favors suppliers with proven field performance. Capital strength supports sustained research investment. Customer retention depends on aftermarket service quality.
Recent Developments:
- On November 21, 2025, Sterling Specialty Chemicals announced a definitive agreement to acquire a portion of Halliburton's Multi-Chem business, further reshaping Halliburton's service portfolio and allowing the company to focus on core energy transition and upstream opportunities.
- Robust Q3 2025 Performance – October 27, 2025: In Q3 2025, NOV achieved revenues of $2.18 billion (down 1% year-over-year) with net income of $42 million ($0.11 per share) and adjusted EBITDA of $258 million (11.9% of sales). The Energy Equipment segment demonstrated strong performance with revenues rising to $1.25 billion (up 2% year-over-year), achieving record EBITDA of $180 million with margins improving to 14.4% of sales. This marked the thirteenth consecutive quarter of year-over-year adjusted EBITDA growth for the segment, driven by strong execution on offshore production and LNG-related projects. The Energy Products and Services segment reported revenues of $971 million (down 3% year-over-year) with operating profit of $38 million and adjusted EBITDA of $135 million (13.9% of sales), impacted by lower global drilling activity and delays in capital equipment order timing.
- NOV Inc. (National Oilwell Varco): Q2 2025 Financial Results – July 29, 2025: NOV Inc. reported Q2 2025 revenues of $2.19 billion, representing a 4% sequential increase but a 1% decline year-over-year. The company achieved net income of $108 million ($0.29 per share) with adjusted EBITDA of $252 million (11.5% of sales). The Energy Equipment segment reported flat revenues of $1.21 billion, while the Energy Products and Services segment saw a 2% decline to $1.03 billion. The revenue decline was primarily attributed to comparison with Q2 2024's $130 million gain from a business sale. NOV returned $176 million to shareholders through share repurchases and dividends, reflecting strong capital allocation discipline. The company provided guidance for Q3 2025 revenues to decline 1-3% year-over-year with adjusted EBITDA between $230-250 million.
Report Coverage:
The research report offers an in-depth analysis based on equipment type and application segments. It details leading market players, providing an overview of their business, product offerings, investments, revenue streams, and key applications. Additionally, the report includes insights into the competitive environment, SWOT analysis, current market trends, as well as the primary drivers and constraints. Furthermore, it discusses various factors that have driven market expansion in recent years. The report also explores market dynamics, regulatory scenarios, and technological advancements that are shaping the industry. It assesses the impact of external factors and global economic changes on market growth. Lastly, it provides strategic recommendations for new entrants and established companies to navigate the complexities of the market.
Future Outlook:
- Upstream investment recovery will continue to support steady equipment demand across key producing regions.
- Digital and automated equipment adoption will expand to improve reliability and field-level decision speed.
- Offshore and deepwater projects will drive demand for high-specification and certified equipment.
- Onshore shale activity will sustain baseline demand for drilling and production systems.
- Aftermarket services will gain importance as operators focus on lifecycle cost control.
- Modular and portable equipment designs will see wider acceptance across new projects.
- Emerging oil-producing regions will attract greater supplier attention and partnerships.
- Safety-focused equipment procurement will remain a priority for operators.
- Equipment suppliers will invest more in technology upgrades and service capabilities.
- Strategic alliances will shape competitive positioning over the forecast period.
Request a Free Sample
Fill in your details and we'll send you a free sample report.
- Sample data tables & charts
- Research methodology
Need a Custom Version of This Report?
Tailor the scope, geography, or segments to your exact requirements.
- Custom geography or segment scope
- Direct access to our analyst team
Frequently Asked Questions
What is the current market size for Oilfield equipment market, and what is its projected size in 2032?
At what Compound Annual Growth Rate is the Oilfield equipment market projected to grow between 2025 and 2032?
Which Oilfield equipment market segment held the largest share in 2024?
What are the primary factors fueling the growth of the Oilfield equipment market?
Who are the leading companies in the Oilfield equipment market?
Which region commanded the largest share of the Oilfield equipment market in 2024?
Table of Content
Chapter 1. Report Introduction
- 1.1 Report Description & Purpose
- 1.1.1 Report Title & Market Definition
- 1.1.2 Unique Selling Propositions (USP) & Key Differentiators
- 1.1.3 Value Proposition for Stakeholders
- 1.2 Research Objectives
- 1.2.1 Market Sizing Objectives (Volume & Revenue) (Volume Where Applicable)
- 1.2.2 Segmentation Objectives
- 1.2.3 Competitive Intelligence Objectives
- 1.2.4 Forecast & Scenario Objectives
- 1.3 Report Scope
- 1.3.1 Oilfield Equipment Scope – Segments & Subsegments Covered
- 1.3.2 Geographic Scope – Regions & Countries Covered
- 1.3.3 Historical Period, Base Year & Forecast Period (2024; forecast to 2032)
- 1.3.4 Inclusions & Exclusions
- 1.4 Industry Classification & Applicable Codes
- 1.5 Currency, Measurement Units & Valuation Basis
- 1.6 Target Stakeholders
- 1.7 Limitations & Assumptions
Chapter 2. Executive Summary
- 2.1 Global Oilfield Equipment Market Snapshot
- 2.1.1 Market Size – Historical (2024) & Forecast (2024-2032) (2024: USD 128,613 million → 2032: USD 159,910.5 million)
- 2.1.2 Volume & Revenue – Global Totals (Volume Where Applicable)
- 2.1.3 Key Market Highlights – Top Five Facts
- 2.2 Oilfield Equipment Market Segmentation Snapshot
- 2.2.1 Market Split by Region – 2024 vs. 2032
- 2.3 Competitive Snapshot
- 2.3.1 Top 10 Players by Revenue Share – 2024
- 2.3.2 Top 10 Players by Volume Share – 2024 (Volume Where Applicable)
- 2.3.3 Recent Strategic Developments (18-Month Summary)
- 2.4 Key Investment Highlights & Strategic Conclusions
Chapter 3. Oilfield Equipment Market Dynamics & Industry Analysis
- 3.1 Market Overview & Context
- 3.1.1 Oilfield Equipment Market Position in the Broader Industry Value Chain
- 3.1.2 Demand Structure & Purchasing Dynamics
- 3.1.3 Market Maturity & Development Stage by Region
- 3.2 Oilfield Equipment Market Drivers
- 3.3 Oilfield Equipment Market Restraints & Challenges
- 3.4 Oilfield Equipment Market Opportunities
- 3.5 Porter's Five Forces Analysis
- 3.5.1 Threat of New Entrants
- 3.5.2 Bargaining Power of Suppliers
- 3.5.3 Bargaining Power of Buyers
- 3.5.4 Threat of Substitutes
- 3.5.5 Competitive Rivalry – Intensity Assessment
- 3.6 Oilfield Equipment Value Chain Analysis
- 3.6.1 Upstream – Key Inputs, Resources & Suppliers
- 3.6.1.1 Key Input/Resource 1
- 3.6.1.2 Key Input/Resource 2
- 3.6.1.3 Key Input/Resource 3
- 3.6.2 Midstream – Core Operations & Value Creation
- 3.6.2.1 Operating Model & Process Overview
- 3.6.2.2 Key Operating Locations & Capabilities by Company
- 3.6.3 Downstream – Market Channels & End Users
- 3.6.3.1 Direct Sales & Customer Engagement Channels
- 3.6.3.2 Indirect Sales, Intermediaries & Partner Channels
- 3.6.4 Value Chain Profitability Analysis
- 3.6.1 Upstream – Key Inputs, Resources & Suppliers
- 3.7 PESTEL Analysis
- 3.7.1 Political Factors
- 3.7.2 Economic Factors
- 3.7.3 Social Factors
- 3.7.4 Technological Factors
- 3.7.5 Environmental Factors
- 3.7.6 Legal Factors
- 3.8 Oilfield Equipment Supply Chain Analysis
- 3.8.1 Critical Input & Resource Availability Risk Assessment
- 3.8.2 Supplier & Operational Concentration Risk (Geographic Exposure)
- 3.8.3 Supply & Service Disruption Impact Analysis
- 3.9 Regulatory & Policy Landscape
Note: The regulatory and policy landscape section covers regulations based on their applicability to the market, Oilfield Equipment category, geography, and scope of the study. Only regulatory frameworks with a material impact on operations, compliance, trade, sustainability, or market access are analyzed in detail.
Chapter 4. Key Investment Pockets & Opportunity Analysis
- 4.1 Oilfield Equipment Market Attractiveness Analysis
- 4.1.1 By Region – Investment Attractiveness Matrix (Market Size × CAGR)
- 4.2 Absolute Revenue Growth Opportunity
- 4.2.1 By Region – Absolute Revenue Growth Through 2032
- 4.3 Incremental Demand Opportunity
- 4.3.1 By Region – Incremental Demand Through 2032
- 4.3.2 Segment – Incremental Demand
- 4.4 Emerging Submarket Opportunity Deep Dive (Subject to Applicability)
- 4.5 Priority Market Opportunity Scorecards
- 4.5.1 United States
- 4.5.2 Europe
- 4.5.3 Asia
- 4.5.4 Middle East & Africa
Note: Priority market opportunity scorecards reflect the geographic scope and strategic relevance of the study. Listed markets are indicative and may be adapted to the industry.
Chapter 5. Oilfield Equipment Cross-Border Trade & Market Access Analysis
- 5.1 International Trade & Cross-Border Activity Overview
- 5.1.1 Global Export Value by Country (2024)
- 5.1.2 Global Export Volume by Country (2024) (Volume Where Applicable)
- 5.1.3 Global Import Value by Country (2024)
- 5.1.4 Global Import Volume by Country (2024) (Volume Where Applicable)
- 5.1.5 Net Trade Balance by Country (2024)
- 5.2 Export Analysis – Segment
- 5.2.1 Category 1 (Applicable Classification Code)
- 5.2.2 Category 2 (Applicable Classification Code)
- 5.2.3 Category 3 (Applicable Classification Code)
- 5.2.4 Category 4 (Applicable Classification Code)
- 5.2.5 Category 5 (Applicable Classification Code)
- 5.3 Import Analysis – Segment
- 5.3.1 Category 1 (Applicable Classification Code)
- 5.3.2 Category 2 (Applicable Classification Code)
- 5.3.3 Category 3 (Applicable Classification Code)
- 5.3.4 Category 4 (Applicable Classification Code)
- 5.3.5 Category 5 (Applicable Classification Code)
- 5.4 Cross-Border Pricing & Transaction Benchmarks
- 5.4.1 Export Pricing – Segment & Country
- 5.4.2 Import Pricing – Segment & Source Country
- 5.4.3 Price Trends (2024)
- 5.5 Key Cross-Border Trade & Delivery Routes
- 5.5.1 Cross-Border Trade/Delivery Route 1
- 5.5.2 Cross-Border Trade/Delivery Route 2
- 5.5.3 Cross-Border Trade/Delivery Route 3
- 5.5.4 Cross-Border Trade/Delivery Route 4
- 5.5.5 Cross-Border Trade/Delivery Route 5
- 5.6 Trade Policy & Market Access Impact Assessment
- 5.6.1 Tariff & Non-Tariff Barriers
- 5.6.2 Regional Trade & Economic Integration Frameworks
- 5.6.3 Bilateral & Multilateral Trade Agreements
- 5.6.4 Cross-Border Operating, Licensing & Localization Requirements
Note: This chapter applies where cross-border trade or delivery is relevant to Oilfield Equipment. Goods, services, and digital offerings are assessed using applicable classifications and transaction measures. Import-export volumes, trade balances, and route analyses are included only where meaningful to the market.
Chapter 6. Competitive Landscape & Company Benchmarking
- 6.1 Oilfield Equipment Market Concentration & Structure
- 6.1.1 Herfindahl-Hirschman Index (HHI) – vs. 2024
- 6.1.2 Leading, Mid-Sized & Emerging Player Structure
- 6.1.3 Global, Regional & Local Player Dynamics
- 6.2 Oilfield Equipment Market Share Analysis – 2024
- 6.2.1 Global Revenue Share by Company
- 6.2.2 Global Volume Share by Company (Volume Where Applicable)
- 6.2.3 Regional Revenue Share
- 6.2.4 Market Share Evolution ( vs. 2024)
- 6.2.5 Company Market Share by Key Segment
- 6.2.6 Company Market Share by Customer Group
- 6.3 Operating Scale, Capacity & Infrastructure Analysis
- 6.3.1 Global Operating Scale & Supply Capacity
- 6.3.2 Resource Utilization & Operating Efficiency
- 6.3.3 Output, Service Delivery & Activity Metrics
- 6.3.4 Operating Footprint & Infrastructure Map
- 6.3.5 Planned Operational & Capacity Expansion
- 6.4 Oilfield Equipment Competitive Benchmarking Matrix
- 6.4.1 Revenue, Growth, Profitability & Operating Metric Comparison
- 6.4.2 Channel Revenue Mix
- 6.4.3 Geographic Revenue Exposure
- 6.4.4 R&D Intensity
- 6.4.5 Sustainability Maturity
- 6.5 Strategic Developments in Oilfield Equipment (Last 24 Months)
- 6.5.1 Mergers, Acquisitions & Divestments
- 6.5.2 New Products, Services & Solutions in Oilfield Equipment
- 6.5.3 Operational & Infrastructure Expansions
- 6.5.4 Strategic Alliances, Joint Ventures & Partnerships
- 6.5.5 Distribution Expansion & Market Entry
- 6.5.6 Sustainability & ESG Initiatives
- 6.6 Competitive Strategy Mapping
- 6.6.1 Leader, Challenger, Follower & Niche Classification
- 6.6.2 Pricing Strategy Comparison
- 6.6.3 Channel Strategy Matrix
Note: Strategic developments are included based on their materiality and the availability of reliable information.
Chapter 7. Global Oilfield Equipment Market – By Sales & Delivery Channel
- 7.1 Segment Overview
- 7.1.1 Volume & Revenue Split by Channel (2024 & 2032) (Volume Where Applicable)
- 7.1.2 Channel Mix Evolution (2024-2032)
Chapter 8. Regional Market Analysis – Global Overview
- 8.1 Global Regional Overview
- 8.1.1 Regional Volume Share (Volume Where Applicable)
- 8.1.2 Regional Revenue Share
- 8.1.3 Regional Volume by Region (Volume Where Applicable)
- 8.1.4 Regional Revenue by Region
- 8.1.5 Regional Forecast Through 2032
- 8.2 Cross-Regional Segment Analysis
- 8.2.1 By Sales & Delivery Channel
- 8.2.2 By Competitive Positioning & Price Tier
Chapter 9. North America Oilfield Equipment Market
- 9.1 United States
- 9.2 Canada
- 9.3 Mexico
Chapter 10. Europe Oilfield Equipment Market
- 10.1 Germany
- 10.2 France
- 10.3 Italy
- 10.4 United Kingdom
- 10.5 Spain
- 10.6 Poland
- 10.7 Russia
- 10.8 Netherlands
- 10.9 Belgium
- 10.10 Sweden
- 10.11 Denmark
- 10.12 Norway
- 10.13 Rest of Europe
Chapter 11. Asia Pacific Oilfield Equipment Market
- 11.1 China
- 11.2 India
- 11.3 Japan
- 11.4 South Korea
- 11.5 Thailand
- 11.6 Indonesia
- 11.7 Vietnam
- 11.8 Malaysia
- 11.9 Australia
- 11.10 Rest of Asia Pacific
Chapter 12. Latin America Oilfield Equipment Market
- 12.1 Brazil
- 12.2 Argentina
- 12.3 Colombia
- 12.4 Chile
- 12.5 Rest of Latin America
Chapter 13. Middle East Oilfield Equipment Market
- 13.1 Saudi Arabia
- 13.2 United Arab Emirates
- 13.3 Turkey
- 13.4 Israel
- 13.5 Iran
- 13.6 Rest of the Middle East
Chapter 14. Africa Oilfield Equipment Market
- 14.1 South Africa
- 14.2 Egypt
- 14.3 Nigeria
- 14.4 Morocco
- 14.5 Rest of Africa
Chapter 15. Oilfield Equipment Company Profiles
- 15.1 [Company 01]
- 15.1.1 Company Overview
- 15.1.2 Key Management Personnel
- 15.1.3 Products & Services Portfolio
- 15.1.4 Financial Performance
- 15.1.5 Key Market Focus & Geographic Presence
- 15.1.6 Recent Developments & Strategic Initiatives
Note: The company profile list is preliminary and may change based on research findings, market developments, data availability, and client requirements.
Chapter 16. Appendices
- Appendix A – List of Abbreviations & Acronyms
- Appendix B – Industry Classification Code Reference – Full Series
- Appendix C – Supply, Output & Operating Capacity Data Tables
- Appendix D – End-Use & Demand Base Tables
- Appendix E – Demand, Adoption & Usage Assumptions
- Appendix F – Pricing & Revenue Metric Reference Tables
- Appendix G – Company Operations & Infrastructure Database
- Appendix H – Cross-Border Trade & Activity Data Tables (Where Applicable)
- Appendix I – Regulatory Summary Tables
- Appendix J – Primary Research Participant List (Anonymized)
- Appendix K – Primary Research Questionnaire Framework
- Appendix L – Data Sources & Bibliography
- Appendix M – Market Size Divergence & Source Comparison
Chapter 17. Research Methodology
- 17.1 Research Framework & Philosophy
- 17.2 Secondary Research – Sources, Hierarchy & Data Extraction
- 17.3 Data Modeling – Bottom-Up & Top-Down Market Sizing
- 17.4 Primary Research – Stakeholder Framework, LOI & Sample Sizes
- 17.5 Forecast Methodology – Regression, Scenario & Sensitivity Analysis
- 17.6 Quality Control – Four-Layer Validation Framework
- 17.7 Limitations & Standard Assumptions
- 17.8 Disclaimer
