
Market Overview:
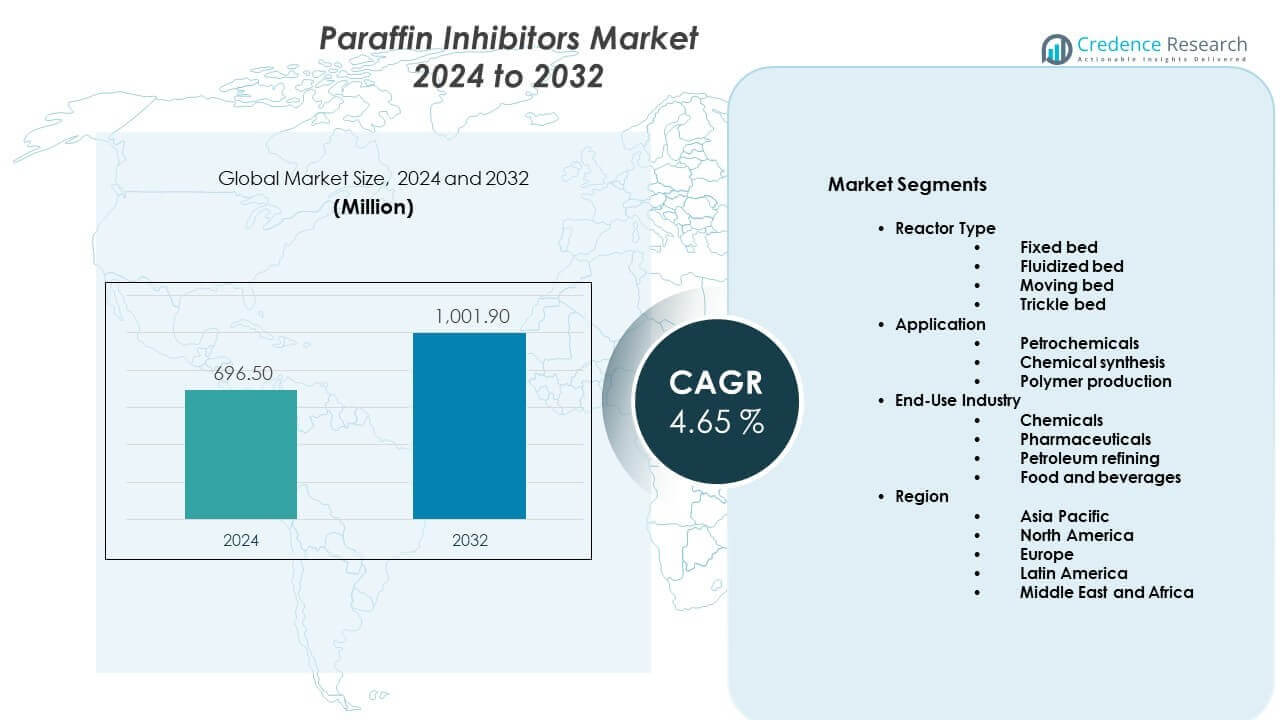
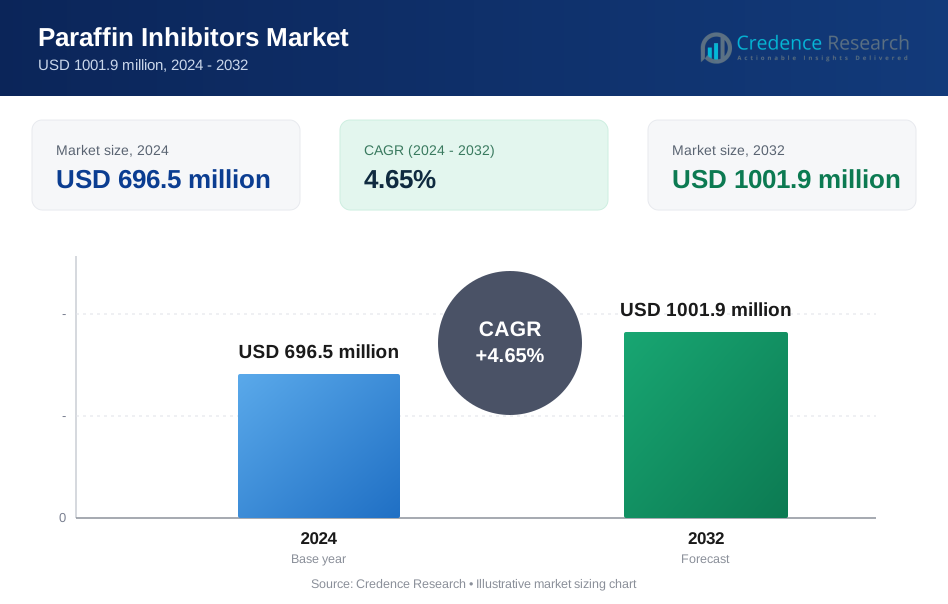
The Paraffin inhibitors market is projected to grow from USD 696.5 million in 2024 to USD 1001.9 million by 2032. The market is expected to expand at a CAGR of 4.65% during the forecast period. Growth reflects rising demand for flow assurance solutions across upstream oil and gas operations.
| REPORT ATTRIBUTE | DETAILS |
|---|---|
| Historical Period | 2020-2023 |
| Base Year | 2024 |
| Forecast Period | 2025-2032 |
| Paraffin Inhibitors Market Size 2024 | USD 696.5 million |
| Paraffin Inhibitors Market, CAGR | 4.65% |
| Paraffin Inhibitors Market Size 2032 | USD 1001.9 million |
Paraffin deposition remains a major challenge in crude oil production systems. Operators seek chemical solutions to prevent pipeline blockages and flow loss. Paraffin inhibitors support steady production in cold and deep reservoirs. Increasing offshore drilling raises wax control needs. Mature oilfields also drive demand for enhanced flow assurance chemicals. Producers focus on reducing downtime and maintenance costs. Chemical injection offers a cost-effective prevention method. Continuous production targets strengthen adoption across onshore and offshore assets.
North America leads due to extensive shale production and mature pipeline networks. The United States shows strong usage across unconventional oilfields. The Middle East remains a key market due to high crude output. Gulf countries rely on inhibitors to maintain export stability. Europe shows steady demand from offshore fields in the North Sea. Asia-Pacific emerges as a growth region with rising exploration activity. China and India expand production to meet energy needs. Latin America gains traction through offshore developments.
Market Insights:
- The Paraffin inhibitors market was valued at USD 696.5 million in 2024 and is projected to reach USD 1001.9 million by 2032, growing at a CAGR of 4.65% due to steady flow assurance demand.
- North America leads with around 35% share due to shale output, followed by Middle East & Africa at nearly 25% from high crude production, and Europe at about 22% driven by offshore activity.
- Asia Pacific is the fastest-growing region with nearly 12% share, supported by rising exploration activity, expanding onshore fields, and increasing domestic energy demand.
- By operation, upstream activities dominate with over 55% share, reflecting direct exposure to paraffin deposition in production wells and gathering systems.
- By application, onshore fields account for nearly 60% share due to extensive pipeline networks and frequent wax-related flow challenges.
Market Drivers:
Persistent Paraffin Deposition Issues Across Oil Production Systems
Paraffin buildup continues to disrupt crude oil flow in production systems. Wax crystals restrict pipelines and reduce output efficiency. Operators deploy chemical solutions to manage this risk. The Paraffin inhibitors market benefits from this constant operational need. It supports stable flow in low-temperature reservoirs. Onshore fields show regular wax-related maintenance issues. Offshore assets face higher risks due to cold environments. Producers prioritize prevention to protect asset performance. These factors sustain steady chemical demand.
- For instance, Shell reports that wax deposition can cut flow rates by over 20% in cold onshore lines, driving routine inhibitor injection programs.
Expansion Of Offshore And Deepwater Exploration Activities
Offshore exploration increases exposure to wax formation challenges. Deepwater reservoirs operate under low seabed temperatures. Flow assurance becomes critical in long subsea tiebacks. The Paraffin inhibitors market supports uninterrupted offshore production. It helps maintain viscosity control during transport. Operators focus on chemical reliability under pressure. Offshore project investments reinforce preventive treatment usage. Field operators favor consistent injection programs. This driver remains structurally strong.
- For instance, BP has disclosed that long subsea tiebacks exceeding 40 kilometers require continuous flow assurance chemicals to avoid wax-related shutdowns.
Rising Focus On Production Efficiency And Asset Uptime
Oil producers aim to reduce unplanned shutdown events. Wax deposition leads to costly cleaning operations. Chemical inhibitors help maintain continuous flow. The Paraffin inhibitors market aligns with uptime goals. It lowers frequency of mechanical interventions. Operators seek predictable treatment performance. Stable production supports revenue continuity. Maintenance planning improves with preventive chemistry. Efficiency targets strengthen adoption.
Growth In Mature Oilfields Requiring Flow Assurance Support
Mature fields face declining pressure and higher wax risks. Aging infrastructure increases flow sensitivity. Paraffin control becomes essential for extended field life. The Paraffin inhibitors market supports recovery strategies. It enables sustained output from late-life assets. Operators invest in cost-effective chemical programs. Enhanced oil recovery methods raise compatibility needs. Treatment customization gains importance. This driver supports long-term demand.
Market Trends:
Shift Toward Tailored Chemical Formulations For Specific Crude Profiles
Crude compositions vary across regions and reservoirs. Operators demand inhibitors matched to wax content. Customized formulations gain preference over generic products. The Paraffin inhibitors market reflects this technical shift. Suppliers invest in lab-based crude analysis. Field-specific performance validation becomes common. Treatment precision improves operational confidence. Customized chemistry reduces overdosing risks. This trend enhances supplier differentiation.
- For instance, Baker Hughes has published field data showing customized paraffin inhibitors reduced wax deposition thickness by over 30% after crude-specific lab analysis.
Integration Of Digital Monitoring With Chemical Injection Programs
Digital tools support better chemical management strategies. Sensors track temperature and flow behavior in pipelines. Operators link data with inhibitor dosing systems. The Paraffin inhibitors market adapts to digital workflows. It improves treatment timing accuracy. Automated injection reduces manual intervention. Data-driven decisions enhance efficiency. Digital adoption reshapes service delivery models. This trend gains traction steadily.
- For instance, SLB reports that integrating real-time pipeline data with automated chemical injection reduced inhibitor overuse by nearly 25% in monitored assets.
Increasing Preference For Multi-Functional Flow Assurance Chemicals
Operators seek solutions addressing multiple flow risks. Combined wax and scale control products gain attention. Multi-functional chemistry reduces treatment complexity. The Paraffin inhibitors market evolves toward broader performance scope. It simplifies chemical logistics on-site. Operators value reduced storage requirements. Treatment programs become more streamlined. Product portfolios expand in response. This trend influences product development.
Growing Use Of Contract-Based Chemical Management Services
Oil producers outsource chemical management functions. Long-term service contracts replace spot chemical purchases. Suppliers offer bundled monitoring and optimization services. The Paraffin inhibitors market sees stronger service integration. It enhances supplier-client collaboration. Performance-based contracts gain popularity. Service reliability becomes a differentiator. This trend reshapes competitive dynamics.
Market Challenges Analysis:
Performance Variability Across Diverse Reservoir And Pipeline Conditions
Paraffin control performance varies by crude properties. Temperature and flow rates affect inhibitor efficiency. Operators face uncertainty during field deployment. The Paraffin inhibitors market manages this technical challenge. It requires extensive field testing efforts. Inconsistent results increase operational caution. Treatment optimization demands skilled expertise. Performance assurance remains complex. This challenge impacts adoption confidence.
Cost Sensitivity And Budget Constraints In Volatile Oil Markets
Oil price volatility influences chemical spending decisions. Operators reduce discretionary operational expenses. Paraffin treatment programs face budget scrutiny. The Paraffin inhibitors market experiences pricing pressure. It must justify cost through performance gains. Procurement teams seek lower-cost alternatives. Suppliers balance margins with competitiveness. This challenge affects market stability.
Market Opportunities:
Rising Exploration And Production Activity In Emerging Energy Regions
Emerging regions expand oil production capacity steadily. New fields face early-stage flow assurance needs. Paraffin control becomes part of initial design planning. The Paraffin inhibitors market benefits from early adoption. It supports smoother production ramp-up phases. National oil companies invest in prevention strategies. Local infrastructure growth creates new demand. This opportunity supports geographic expansion.
Technological Advancements In Environmentally Compatible Chemical Solutions
Environmental standards influence chemical selection criteria. Operators prefer formulations with lower environmental impact. Green chemistry development gains strategic importance. The Paraffin inhibitors market adapts through innovation. It supports compliance with stricter regulations. Biodegradable components gain attention. Sustainable solutions enhance supplier positioning. This opportunity aligns with long-term industry shifts.
Market Segmentation Analysis:
By Chemistry
Modified polycarboxylate inhibitors hold strong adoption due to stable wax control performance. These products suit a wide range of crude profiles. Poly acrylate formulations support viscosity control under moderate temperature conditions. Operators select these chemicals for cost efficiency and predictable behavior. Hyperbranched polyester types address complex wax structures in heavy crude systems. These products offer improved dispersion performance. EVA acrylate copolymers serve cold flow environments with higher wax content. The Paraffin inhibitors market reflects rising demand for chemistry tailored to reservoir conditions.
By Operation
Upstream operations dominate consumption due to direct exposure to wax formation. Production wells require continuous paraffin control to maintain flow. It supports stable crude extraction across mature and new fields. Midstream segments use inhibitors to protect pipelines and storage assets. Long-distance transport systems rely on chemical treatment for flow continuity. Downstream facilities apply inhibitors in crude handling and processing units. Treatment supports smoother feedstock transfer across refinery systems.
- For instance, Saudi Aramco has indicated that its preventive maintenance and advanced monitoring programs have reduced well intervention costs and production deferrals by utilizing alternate deployment methods and real-time data analytics.
By Application
Onshore applications account for steady demand due to widespread field deployment. Operators face frequent wax deposition in surface pipelines. Chemical injection remains a preferred control method. Offshore applications show strong technical requirements due to low seabed temperatures. It supports uninterrupted flow in subsea and deepwater systems. Offshore fields prioritize reliable formulations for extended tiebacks. This segmentation highlights operational diversity across production environments.
Segmentation:
By Chemistry- Modified polycarboxylate
- Poly acrylate
- Hyperbranched polyester
- EVA acrylate copolymer
- Upstream
- Midstream
- Downstream
- Onshore
- Offshore
- North America
- U.S.
- Canada
- Mexico
- Europe
- Germany
- France
- U.K.
- Italy
- Spain
- Rest of Europe
- Asia Pacific
- China
- Japan
- India
- South Korea
- South-east Asia
- Rest of Asia Pacific
- Latin America
- Brazil
- Argentina
- Rest of Latin America
- Middle East & Africa
- GCC Countries
- South Africa
- Rest of the Middle East and Africa
Regional Analysis:
North America And Europe
North America holds the largest share of the global market at nearly 35%. The United States drives demand through shale and mature oilfield operations. Wax deposition remains common in long onshore pipeline networks. The Paraffin inhibitors market benefits from strong chemical usage across upstream and midstream assets. It supports flow assurance in cold-weather production zones. Europe accounts for around 22% market share. North Sea offshore fields sustain steady demand due to low-temperature operating conditions.
Middle East & Africa
The Middle East & Africa region represents close to 25% of global market share. High crude oil output supports consistent inhibitor usage. Gulf countries rely on chemical treatment to protect export pipelines. The Paraffin inhibitors market aligns with production stability goals in this region. It supports both onshore and offshore fields. Mature reservoirs require ongoing wax control programs. National oil companies maintain long-term chemical supply contracts.
Asia Pacific And Latin America
Asia Pacific holds approximately 12% market share and shows gradual expansion. China and India increase chemical usage to support domestic production growth. Onshore fields dominate regional demand patterns. The Paraffin inhibitors market gains traction through rising exploration activity. It supports new field development phases. Latin America accounts for nearly 6% market share. Offshore projects in Brazil and Mexico strengthen regional demand trends.
Key Player Analysis:
- BASF SE
- Baker Hughes Company
- Clariant
- Evonik Industries
- Halliburton
- Schlumberger
- Dow Chemical Company
- NALCO
- Dorf Ketal Chemicals
- ChampionX
Competitive Analysis:
The Paraffin inhibitors market shows moderate concentration with global chemical and oilfield service firms. Leading players compete through formulation expertise and field performance reliability. Companies focus on tailored chemistry for diverse crude profiles. It rewards suppliers with strong technical support capabilities. Product differentiation relies on temperature tolerance and dosage efficiency. Strategic contracts with oil producers strengthen long-term positioning. Regional presence and supply reliability influence buyer selection. Competitive intensity remains steady across upstream-focused portfolios.
Recent Developments:
- In 2025, Nalco Water (an Ecolab company) focused its recent advancements on downstream and water-related flow assurance, launching the Ecolab Watermark™ Study to highlight the intersection of water stewardship and industrial operations. Following the spinoff of its upstream champion business (now ChampionX), Nalco’s recent updates have centered on refinery and petrochemical processing aids, including inhibitors that prevent fouling and wax deposition in downstream infrastructure, leveraging digital automation to minimize chemical waste and improve plant reliability.
- In May 2024, Dorf Ketal Chemicals India announced the acquisition of Impact Fluid Solutions, a Texas-based provider of specialty downhole fluid additives. This acquisition was a strategic move to broaden Dorf Ketal’s portfolio beyond its traditional refining and petrochemical strengths into the upstream oil and gas sector. The deal allows Dorf Ketal to leverage Impact’s wellbore shielding and flow assurance technologies, enhancing its ability to offer comprehensive chemical solutions, including those for paraffin control, to a global client base.
- In 2024, BASF SE, Baker Hughes, and Clariant advanced their flow assurance and paraffin control portfolios through strategic investments and digital integration. In May 2024, BASF announced a major investment to expand the global production of its Basoflux® paraffin inhibitors at its site in Tarragona, Spain, specifically targeting "challenging oil" and paraffinic crude fields. This expansion focuses on more sustainable aqueous-based dispersions that reduce solvent usage, with first customer deliveries scheduled for early 2025.
- Baker Hughes continued to promote its established flow assurance technologies, including the ParaSorb™ solid paraffin inhibitor for long-term downhole mitigation and the FORSA™ series for preventing wax deposition and reducing pour points.
- Meanwhile, Clariant integrated its paraffin control solutions into its digital ecosystem, notably the CHEMVISION™ intelligent chemical management system, which uses real-time data analytics to optimize chemical dosage and predict flow failures. This digitalization effort aligns with the "resilience and agility" strategy highlighted in Clariant’s 2024 Integrated Report, which emphasizes innovation and operational excellence in a challenging market environment.
Report Coverage:
The research report offers an in-depth analysis based on chemistry type, operation, and application segments. It details leading market players, providing an overview of their business, product offerings, investments, revenue streams, and key applications. Additionally, the report includes insights into the competitive environment, SWOT analysis, current market trends, as well as the primary drivers and constraints. Furthermore, it discusses various factors that have driven market expansion in recent years. The report also explores market dynamics, regulatory scenarios, and technological advancements that are shaping the industry. It assesses the impact of external factors and global economic changes on market growth. Lastly, it provides strategic recommendations for new entrants and established companies to navigate the complexities of the market.
Future Outlook:
- Flow assurance remains a critical priority for crude oil producers across mature and new fields.
- Demand for paraffin inhibitors continues to rise in aging oilfields with higher wax deposition risks.
- Offshore developments sustain long-term need for reliable chemical flow control solutions.
- Customized inhibitor formulations gain wider adoption to match specific crude properties.
- Digital monitoring tools improve accuracy of chemical injection programs.
- Service-based chemical management models expand among large oil operators.
- Emerging production regions create new demand opportunities for flow assurance chemicals.
- Environmental regulations influence the development of safer inhibitor formulations.
- Technical support capability becomes a key factor in supplier selection.
- Long-term production stability goals support consistent paraffin inhibitor usage.
Request a Free Sample
Fill in your details and we'll send you a free sample report.
- Sample data tables & charts
- Research methodology
Need a Custom Version of This Report?
Tailor the scope, geography, or segments to your exact requirements.
- Custom geography or segment scope
- Direct access to our analyst team
Frequently Asked Questions
What is the current market size for Paraffin inhibitors market, and what is its projected size in 2032?
At what Compound Annual Growth Rate is the Paraffin inhibitors market projected to grow between 2025 and 2032?
Which Paraffin inhibitors market segment held the largest share in 2024?
What are the primary factors fueling the growth of the Paraffin inhibitors market?
Who are the leading companies in the Paraffin inhibitors market?
Which region commanded the largest share of the Paraffin inhibitors market in 2024?
Table of Content
Chapter 1. Report Introduction
- 1.1 Report Description & Purpose
- 1.1.1 Report Title & Market Definition
- 1.1.2 Unique Selling Propositions (USP) & Key Differentiators
- 1.1.3 Value Proposition for Stakeholders
- 1.2 Research Objectives
- 1.2.1 Market Sizing Objectives (Volume & Revenue)
- 1.2.2 Segmentation Objectives
- 1.2.3 Competitive Intelligence Objectives
- 1.2.4 Forecast & Scenario Objectives
- 1.3 Report Scope
- 1.3.1 Paraffin Inhibitors Scope – Types & Subtypes Covered
- 1.3.2 Geographic Scope – Regions & Countries Covered
- 1.3.3 Historical Period, Base Year & Forecast Period (2024; forecast to 2032)
- 1.3.4 Inclusions & Exclusions
- 1.4 HS Code & Classification Framework
- 1.5 Currency, Units & Pricing Basis
- 1.6 Target Stakeholders
- 1.7 Limitations & Assumptions
Chapter 2. Executive Summary
- 2.1 Global Paraffin Inhibitors Market Snapshot
- 2.1.1 Market Size – Historical (2024) & Forecast (2024-2032) (2024: USD 696.5 million → 2032: USD 1001.9 million)
- 2.1.2 Volume & Revenue – Global Totals
- 2.1.3 Key Market Highlights – Top Five Facts
- 2.2 Paraffin Inhibitors Market Segmentation Snapshot
- 2.2.1 Market Split by Region – 2024 vs. 2032
- 2.3 Competitive Snapshot
- 2.3.1 Top 10 Players by Revenue Share – 2024
- 2.3.2 Top 10 Players by Volume Share – 2024
- 2.3.3 Recent Strategic Developments (18-Month Summary)
- 2.4 Key Investment Highlights & Strategic Conclusions
Chapter 3. Paraffin Inhibitors Market Dynamics & Industry Analysis
- 3.1 Market Overview & Context
- 3.1.1 Paraffin Inhibitors Market Position in the Broader Automotive Value Chain
- 3.1.2 OEM vs. Replacement Market Dynamics
- 3.1.3 Market Maturity & Development Stage by Region
- 3.2 Paraffin Inhibitors Market Drivers
- 3.3 Paraffin Inhibitors Market Restraints & Challenges
- 3.4 Paraffin Inhibitors Market Opportunities
- 3.5 Porter's Five Forces Analysis
- 3.5.1 Threat of New Entrants
- 3.5.2 Bargaining Power of Suppliers
- 3.5.3 Bargaining Power of Buyers
- 3.5.4 Threat of Substitutes
- 3.5.5 Competitive Rivalry – Intensity Assessment
- 3.6 Paraffin Inhibitors Value Chain Analysis
- 3.6.1 Upstream – Raw Material/Input Suppliers
- 3.6.1.1 Raw Material/Input 1
- 3.6.1.2 Raw Material/Input 2
- 3.6.1.3 Raw Material/Input 3
- 3.6.2 Midstream – Production/Manufacturing/Service Delivery
- 3.6.2.1 Production/Process Overview
- 3.6.2.2 Key Facility Locations & Capacity by Manufacturer
- 3.6.3 Downstream – Distribution & End Consumer
- 3.6.3.1 Primary Channel – B2B/OEM
- 3.6.3.2 Secondary Channels – Dealer, Retail, Online, Direct
- 3.6.4 Value Chain Profitability Analysis
- 3.6.1 Upstream – Raw Material/Input Suppliers
- 3.7 PESTEL Analysis
- 3.7.1 Political Factors
- 3.7.2 Economic Factors
- 3.7.3 Social Factors
- 3.7.4 Technological Factors
- 3.7.5 Environmental Factors
- 3.7.6 Legal Factors
- 3.8 Paraffin Inhibitors Supply Chain Analysis
- 3.8.1 Raw Material/Input Supply Risk Assessment
- 3.8.2 Manufacturing Concentration Risk (Geographic Exposure)
- 3.8.3 Trade Disruption Impact Analysis
- 3.9 Regulatory & Policy Landscape
Note: The regulatory and policy landscape section covers regulations based on their applicability to the market, Paraffin Inhibitors category, geography, and scope of the study. Only regulatory frameworks with a material impact on operations, compliance, trade, sustainability, or market access are analyzed in detail.
Chapter 4. Key Investment Pockets & Opportunity Analysis
- 4.1 Paraffin Inhibitors Market Attractiveness Analysis
- 4.1.1 By Region – Investment Attractiveness Matrix (Volume × CAGR)
- 4.2 Absolute Revenue Growth Opportunity
- 4.2.1 By Region – Absolute USD Growth Through 2032
- 4.3 Incremental Volume Opportunity
- 4.3.1 By Region – Incremental Volume Through 2032
- 4.3.2 Segment – Incremental Volume
- 4.4 Emerging Submarket Opportunity Deep Dive (Subject to Applicability)
- 4.5 Emerging Market Opportunity Scorecards
- 4.5.1 United States
- 4.5.2 Europe
- 4.5.3 Asia
- 4.5.4 Middle East & Africa
Note: Emerging Market Opportunity Scorecards will be included based on relevance and strategic importance. Regions listed are indicative and may vary depending on data availability and market dynamics.
Chapter 5. Paraffin Inhibitors Import-Export Analysis & Trade Flows
- 5.1 Global Trade Overview
- 5.1.1 Global Export Value by Country (2024)
- 5.1.2 Global Export Volume by Country (2024)
- 5.1.3 Global Import Value by Country (2024)
- 5.1.4 Global Import Volume by Country (2024)
- 5.1.5 Net Trade Balance by Country (2024)
- 5.2 Export Analysis – Segment
- 5.2.1 Type 1 (HS Code)
- 5.2.2 Type 2 (HS Code)
- 5.2.3 Type 3 (HS Code)
- 5.2.4 Type 4 (HS Code)
- 5.2.5 Type 5 (HS Code)
- 5.3 Import Analysis – Segment
- 5.3.1 Type 1 (HS Code)
- 5.3.2 Type 2 (HS Code)
- 5.3.3 Type 3 (HS Code)
- 5.3.4 Type 4 (HS Code)
- 5.3.5 Type 5 (HS Code)
- 5.4 Average Unit Trade Prices
- 5.4.1 Average Export Price – Segment & Country
- 5.4.2 Average Import Price – Segment & Source Country
- 5.4.3 Price Trends (2024)
- 5.5 Key Trade Route Analysis
- 5.5.1 Trade Route 1
- 5.5.2 Trade Route 2
- 5.5.3 Trade Route 3
- 5.5.4 Trade Route 4
- 5.5.5 Trade Route 5
- 5.6 Trade Policy Impact Assessment
- 5.6.1 US Anti-Dumping & Section 301 Tariffs
- 5.6.2 EU Customs Union Impact
- 5.6.3 Major Free Trade Agreements
- 5.6.4 USMCA Rules of Origin
Note: Trade policy analysis will be included only where relevant to the Paraffin Inhibitors market.
Chapter 6. Competitive Landscape & Company Benchmarking
- 6.1 Paraffin Inhibitors Market Concentration & Structure
- 6.1.1 Herfindahl-Hirschman Index (HHI) – vs. 2024
- 6.1.2 Tier 1, Tier 2 & Tier 3 Market Structure
- 6.1.3 Global, Regional & Local Player Dynamics
- 6.2 Paraffin Inhibitors Market Share Analysis – 2024
- 6.2.1 Global Revenue Share by Company
- 6.2.2 Global Volume Share by Company
- 6.2.3 Regional Revenue Share
- 6.2.4 Market Share Evolution ( vs. 2024)
- 6.2.5 OEM Segment Share by Company
- 6.2.6 Replacement Segment Share by Company
- 6.3 Production/Delivery Capacity & Facility Analysis
- 6.3.1 Global Installed Capacity
- 6.3.2 Capacity Utilization Rates
- 6.3.3 Production/Output Volume
- 6.3.4 Facility Locations & Capacity Map
- 6.3.5 Planned Capacity Additions
- 6.4 Paraffin Inhibitors Competitive Benchmarking Matrix
- 6.4.1 Revenue, Volume, CAGR & Profitability Comparison
- 6.4.2 Channel Revenue Mix
- 6.4.3 Geographic Revenue Exposure
- 6.4.4 R&D Intensity
- 6.4.5 Sustainability Maturity
- 6.5 Strategic Developments in Paraffin Inhibitors (Last 24 Months)
- 6.5.1 Mergers, Acquisitions & Divestments
- 6.5.2 New Paraffin Inhibitors Launches
- 6.5.3 Facility Expansions
- 6.5.4 Strategic Alliances, Joint Ventures & Partnerships
- 6.5.5 Distribution Expansion & Market Entry
- 6.5.6 Sustainability & ESG Initiatives
- 6.6 Competitive Strategy Mapping
- 6.6.1 Leader, Challenger, Follower & Niche Classification
- 6.6.2 Pricing Strategy Comparison
- 6.6.3 Channel Strategy Matrix
Note: Strategic developments are included based on their materiality and the availability of reliable information.
Chapter 7. Global Paraffin Inhibitors Market – By Distribution Channel
- 7.1 Segment Overview
- 7.1.1 Volume & Revenue Split by Channel (2024 & 2032)
- 7.1.2 Channel Mix Evolution (2024-2032)
Chapter 8. Regional Market Analysis – Global Overview
- 8.1 Global Regional Overview
- 8.1.1 Regional Volume Share
- 8.1.2 Regional Revenue Share
- 8.1.3 Regional Volume by Region
- 8.1.4 Regional Revenue by Region
- 8.1.5 Regional Forecast Through 2032
- 8.2 Cross-Regional Segment Analysis
- 8.2.1 By Distribution Channel
- 8.2.2 By Brand/Price Tier
Chapter 9. North America Paraffin Inhibitors Market
- 9.1 United States
- 9.2 Canada
- 9.3 Mexico
Chapter 10. Europe Paraffin Inhibitors Market
- 10.1 Germany
- 10.2 France
- 10.3 Italy
- 10.4 United Kingdom
- 10.5 Spain
- 10.6 Poland
- 10.7 Russia
- 10.8 Netherlands
- 10.9 Belgium
- 10.10 Sweden
- 10.11 Denmark
- 10.12 Norway
- 10.13 Rest of Europe
Chapter 11. Asia Pacific Paraffin Inhibitors Market
- 11.1 China
- 11.2 India
- 11.3 Japan
- 11.4 South Korea
- 11.5 Thailand
- 11.6 Indonesia
- 11.7 Vietnam
- 11.8 Malaysia
- 11.9 Australia
- 11.10 Rest of Asia Pacific
Chapter 12. Latin America Paraffin Inhibitors Market
- 12.1 Brazil
- 12.2 Argentina
- 12.3 Colombia
- 12.4 Chile
- 12.5 Rest of Latin America
Chapter 13. Middle East Paraffin Inhibitors Market
- 13.1 Saudi Arabia
- 13.2 United Arab Emirates
- 13.3 Turkey
- 13.4 Israel
- 13.5 Iran
- 13.6 Rest of the Middle East
Chapter 14. Africa Paraffin Inhibitors Market
- 14.1 South Africa
- 14.2 Egypt
- 14.3 Nigeria
- 14.4 Morocco
- 14.5 Rest of Africa
Chapter 15. Paraffin Inhibitors Company Profiles
- 15.1 [Company 01]
- 15.1.1 Company Overview
- 15.1.2 Key Management Personnel
- 15.1.3 Products & Services Portfolio
- 15.1.4 Financial Performance
- 15.1.5 Key Market Focus & Geographic Presence
- 15.1.6 Recent Developments & Strategic Initiatives
Note: The company profile list is preliminary and may change based on research findings, market developments, data availability, and client requirements.
Chapter 16. Appendices
- Appendix A – List of Abbreviations & Acronyms
- Appendix B – Industry Classification Code Reference – Full Series
- Appendix C – Production & Capacity Data Tables
- Appendix D – End-Use & Demand Base Tables
- Appendix E – Consumption & Replacement Rate Assumptions
- Appendix F – ASP Reference Tables
- Appendix G – Manufacturing & Facility Database
- Appendix H – Import-Export Data Tables
- Appendix I – Regulatory Summary Tables
- Appendix J – Primary Research Participant List (Anonymized)
- Appendix K – Primary Research Questionnaire Framework
- Appendix L – Data Sources & Bibliography
- Appendix M – Market Size Divergence & Source Comparison
Chapter 17. Research Methodology
- 17.1 Research Framework & Philosophy
- 17.2 Secondary Research – Sources, Hierarchy & Data Extraction
- 17.3 Data Modeling – Bottom-Up & Top-Down Market Sizing
- 17.4 Primary Research – Stakeholder Framework, LOI & Sample Sizes
- 17.5 Forecast Methodology – Regression, Scenario & Sensitivity Analysis
- 17.6 Quality Control – Four-Layer Validation Framework
- 17.7 Limitations & Standard Assumptions
- 17.8 Disclaimer
