
Pet Biotics Market Overview:
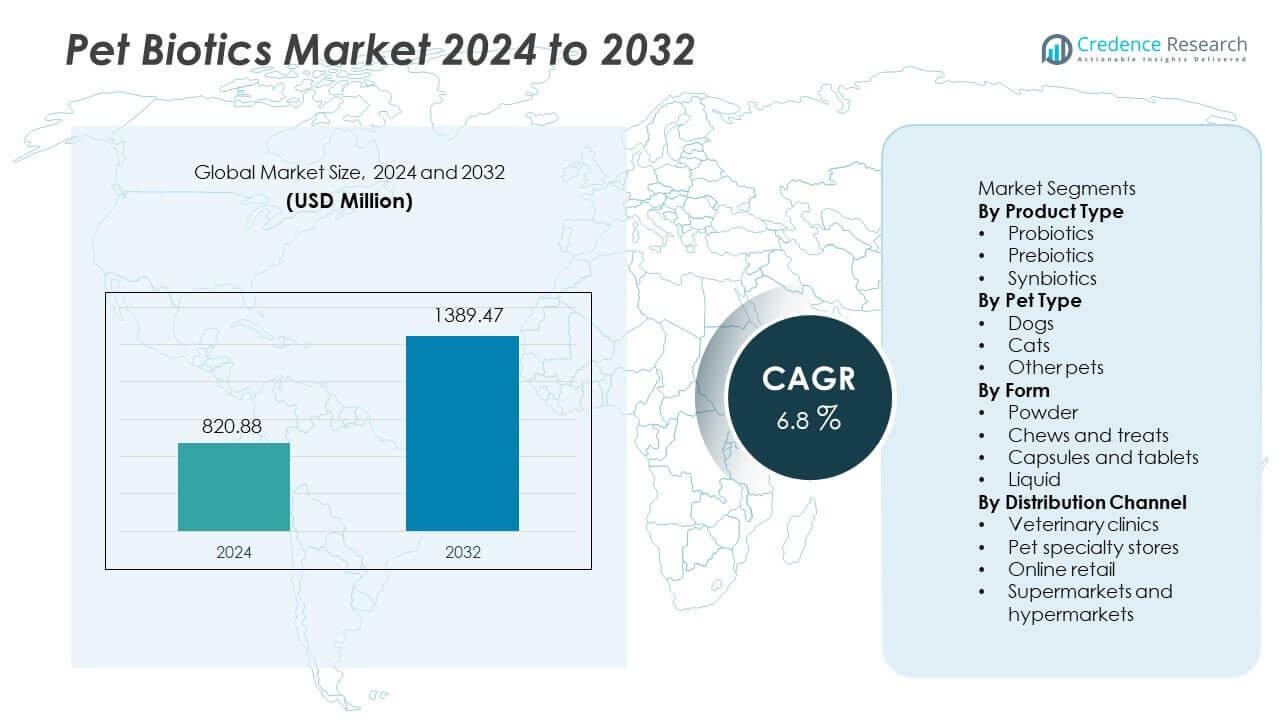
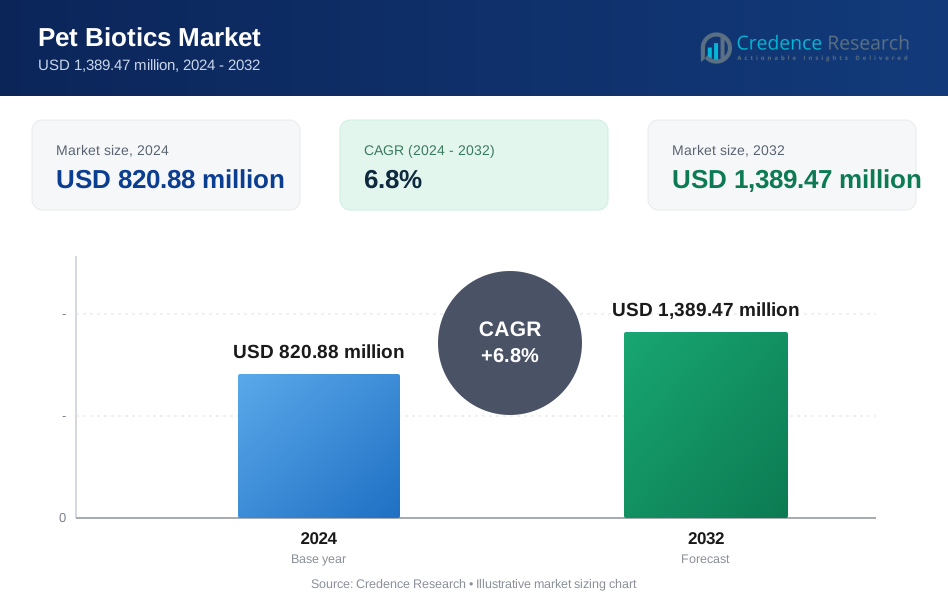
The Pet Biotics market size was valued at USD 820.88 million in 2024 and is projected to reach USD 1,389.47 million by 2032, growing at a CAGR of 6.8% during the forecast period.
| REPORT ATTRIBUTE | DETAILS |
|---|---|
| Historical Period | 2020-2023 |
| Base Year | 2024 |
| Forecast Period | 2025-2032 |
| Pet Biotics Market Size 2024 | USD 820.88 million |
| Pet Biotics Market, CAGR | 6.8% |
| Pet Biotics Market Size 2032 | USD 1,389.47 million |
Pet Biotics Market Insights
- Preventive pet healthcare and increasing veterinary recommendations drive demand, with probiotics leading the product segment with a share of 46.2% due to digestive and immunity benefits.
- Clean label formulations, synbiotics, and palatable formats such as powders and chews shape market trends, while powders dominate the form segment with a 41.7% share.
- Competitive intensity and price sensitivity act as key restraints, as premium positioning, regulatory compliance, and brand differentiation increase cost pressure for manufacturers.
- North America leads regional demand with a 38.2% share, followed by Europe at 26.4% and Asia Pacific at 21.3%, driven by pet humanization, veterinary access, and rising urban pet ownership.
Pet Biotics Market Segmentation Analysis:
By Product Type
By product type, probiotics dominate the Pet Biotics market with a market share of 46.2%. Strong demand comes from their proven benefits in digestive health, immunity support, and gut balance. Veterinarians widely recommend probiotic formulations for routine pet care and recovery support. Probiotics show faster results compared to prebiotics and synbiotics, supporting higher adoption. Growing awareness of microbiome health among pet owners further drives demand. Prebiotics follow due to their role in supporting beneficial bacteria growth, while synbiotics gain gradual traction through combined benefits. Continuous product innovation and clinical backing strengthen probiotic leadership across global markets.
- For instance, Nestlé Purina PetCare validated its canine probiotic strains through controlled feeding trials, tracking stool consistency scores and gastrointestinal health markers in dogs over several weeks.
By Pet Type
By pet type, dogs represent the dominant sub-segment with a market share of 58.4%. Higher dog ownership rates drive consistent product consumption. Dogs face frequent digestive and immune-related issues, increasing probiotic usage. Premium pet care spending remains higher among dog owners. Veterinary recommendations further support adoption in this segment. Cats follow due to rising indoor pet ownership and digestive sensitivity concerns. Other pets, including small mammals, show limited but growing demand. Increased focus on preventive healthcare and functional nutrition sustains strong growth in dog-focused pet biotics products worldwide.
- For instance, Mars Petcare research has demonstrated that supplementing canine diets with specific probiotic strains can be beneficial.
By Form
By form, powders hold the largest market share at 41.7%. Powdered pet biotics offer easy mixing with regular food, improving compliance. Pet owners prefer powders for flexible dosing and cost efficiency. Longer shelf life supports wider retail adoption. Chews and treats follow due to palatability and convenience. Capsules and tablets serve precise dosing needs but face lower acceptance. Liquid formats support targeted use cases but remain niche. Growing preference for easy-to-administer formats and daily-use products continues to reinforce powder dominance in both developed and emerging pet care markets.
Key Growth Drivers
Rising Focus on Preventive Pet Healthcare
Pet owners increasingly prioritize preventive healthcare for companion animals. Awareness of gut health and immunity grows steadily. Veterinarians recommend biotics for daily digestive balance. Preventive care reduces long-term treatment costs. Pet humanization trends influence nutrition choices. Owners seek solutions that support overall wellness. Regular supplementation gains acceptance in routine diets. Education through clinics and digital platforms improves adoption. This driver supports recurring consumption. Preventive healthcare focus sustains long-term demand growth.
- For instance, Hill’s Pet Nutrition conducted clinical research on dogs with various digestive sensitivities, recording significant improvements in fecal quality and stool consistency after they were fed a proprietary blend of prebiotic fibers.
Increasing Pet Ownership and Premium Spending
Global pet ownership continues to rise across urban households. Nuclear families adopt pets for companionship. Spending on premium pet nutrition increases steadily. Owners invest in specialized health supplements. Biotics benefit digestion, immunity, and nutrient absorption. Disposable income growth supports higher-value products. Urban lifestyles increase demand for convenient health solutions. Brand positioning influences purchasing decisions. This driver strengthens demand across developed and emerging markets.
- For instance, ADM Animal Nutrition expanded its probiotic production capacity following a significant increase in its customer base of pet food brands focused on functional health and microbiome solutions.
Growing Veterinary Endorsement and Clinical Validation
Veterinary endorsement plays a key role in product adoption. Clinics recommend biotics for digestive disorders. Clinical studies improve product credibility. Evidence-based formulations gain owner trust. Post-treatment recovery protocols include biotics. Prescription and OTC products expand availability. Veterinary partnerships support brand visibility. Education programs improve understanding of microbiome health. This driver supports sustained market confidence and growth.
Key Trends and Opportunities
Expansion of Synbiotics and Multi-Strain Formulations
Synbiotics gain interest due to combined benefits. Multi-strain products improve gut balance outcomes. Brands invest in advanced formulations. Scientific innovation supports differentiation. Owners prefer comprehensive health solutions. Premium positioning supports higher margins. Innovation attracts informed pet owners. This trend creates strong product development opportunities.
- For instance, Chr. Hansen Holding A/S developed a pet synbiotic blend containing 7 documented bacterial strains, validated through in-vitro survival testing across simulated gastric conditions lasting 120 minutes.
Rising Demand for Palatable and Easy-to-Administer Formats
Ease of administration influences purchase decisions. Chews and treats gain popularity among owners. Palatability improves compliance rates. Daily-use formats support routine supplementation. Convenience appeals to busy households. Product design focuses on taste and texture. This trend expands adoption across pet types.
- For instance, Kemin Industries optimized its palatability system for pet probiotic chews, achieving stable flavor retention after 180 days of shelf-life testing under controlled storage conditions.
Key Challenges
Regulatory Variations and Product Approval Complexity
Regulatory standards differ across regions. Ingredient approvals vary by country. Compliance increases development costs. Labeling rules require frequent updates. Smaller brands face higher entry barriers. Regulatory delays slow product launches. This challenge limits rapid geographic expansion.
Price Sensitivity and Limited Awareness in Emerging Markets
Price sensitivity affects adoption in cost-conscious regions. Premium products face resistance. Awareness of biotics remains limited. Education gaps slow demand growth. Veterinary access varies widely. Distribution reach remains uneven. This challenge restricts faster penetration in emerging markets.
Regional Analysis
North America
North America leads the Pet Biotics market with a market share of 38.2%. High pet ownership and premium spending support strong demand. Preventive pet healthcare remains a priority among owners. Veterinary recommendations drive routine biotics use. Dogs dominate consumption due to digestive sensitivity awareness. Strong retail and online distribution improve access. Product innovation focuses on multi-strain and clean label formulations. The United States drives most regional sales. Education campaigns increase microbiome awareness. Stable purchasing power sustains regional leadership.
Europe
Europe holds a market share of 26.4% in the Pet Biotics market. Pet humanization trends support functional nutrition demand. Veterinary clinics play a key advisory role. Regulatory standards strengthen product quality perception. Dogs and cats show balanced consumption patterns. Western Europe leads due to higher pet care spending. Organic and natural formulations gain traction. Specialty pet stores expand distribution. Online channels grow steadily. Awareness of digestive health supports consistent regional growth.
Asia Pacific
Asia Pacific accounts for a market share of 21.3%. Rising urban pet ownership drives demand. Middle-class income growth supports premium pet nutrition. Dogs dominate usage due to growing adoption rates. Awareness of preventive care improves gradually. Veterinary infrastructure expands in major cities. E-commerce platforms accelerate market penetration. China, Japan, and India remain key markets. Educational marketing influences first-time buyers. Long-term growth remains supported by lifestyle shifts.
Latin America
Latin America represents a market share of 8.7% in the Pet Biotics market. Pet ownership rises across urban households. Price sensitivity shapes product selection. Dogs remain the primary consumers. Veterinary recommendations influence adoption. Brazil and Mexico lead regional demand. Retail availability improves in metropolitan areas. Online sales gain traction. Awareness of gut health increases gradually. Economic stability supports steady consumption growth across the region.
Middle East and Africa
The Middle East and Africa hold a market share of 5.4%. Growing pet adoption supports emerging demand. Premium pet care spending rises in Gulf countries. Veterinary services expand in urban centers. Dogs dominate product usage. Retail infrastructure improves steadily. Online platforms increase product access. Awareness remains limited in parts of Africa. Education initiatives support gradual adoption. Long-term growth potential remains favorable.
Pet Biotics Market Segmentations:
By Product Type
- Probiotics
- Prebiotics
- Synbiotics
By Pet Type
- Dogs
- Cats
- Other pets
By Form
- Powder
- Chews and treats
- Capsules and tablets
- Liquid
By Distribution Channel
- Veterinary clinics
- Pet specialty stores
- Online retail
- Supermarkets and hypermarkets
By Geography
- North America
- U.S.
- Canada
- Mexico
- Europe
- Germany
- France
- U.K.
- Italy
- Spain
- Rest of Europe
- Asia Pacific
- China
- Japan
- India
- South Korea
- South-east Asia
- Rest of Asia Pacific
- Latin America
- Brazil
- Argentina
- Rest of Latin America
- Middle East & Africa
- GCC Countries
- South Africa
- Rest of the Middle East and Africa
Competitive Landscape
Competitive landscape analysis highlights strong competition among Nestlé Purina PetCare, Mars Petcare, Hill’s Pet Nutrition, Lallemand Animal Nutrition, and Chr. Hansen Holding A/S. These players compete through strong veterinary partnerships and science-backed formulations. Companies focus on probiotics, synbiotics, and multi-strain blends to improve digestive and immune health. Product credibility remains critical for brand trust. Premium positioning supports higher margins in developed markets. Firms expand portfolios through clean label and natural ingredient offerings. Strategic collaborations strengthen research and distribution capabilities. Online and specialty pet retail channels gain priority. Regional players compete on pricing and localized formulations. Regulatory compliance and quality assurance shape competitive positioning. Continuous innovation and education-based marketing drive differentiation across the Pet Biotics market.
Key Player Analysis
- Nestlé Purina PetCare
- Mars Petcare
- Hill’s Pet Nutrition
- ADM Animal Nutrition
- Cargill Incorporated
- Lallemand Animal Nutrition
- Hansen Holding A/S
- Kemin Industries
- Alltech
- Protexin Veterinary
Recent Developments
- In January 2025, Hill’s Pet Nutrition unveiled 2025 diet updates using ActivBiome+ microbiome technology.
- In November 2024, Cargill Incorporated was indeed honored at the Food ingredients (Fi) Europe Innovation Awards for its postbiotic technology.
- In January 2024, Chr. Hansen Holding A/S completed its merger with Novozymes to form Novonesis.
Report Coverage
The research report offers an in-depth analysis based on Product Type, Pet Type, Form, Distribution Channel and Geography. It details leading market players, providing an overview of their business, product offerings, investments, revenue streams, and key applications. Additionally, the report includes insights into the competitive environment, SWOT analysis, current market trends, as well as the primary drivers and constraints. Furthermore, it discusses various factors that have driven market expansion in recent years. The report also explores market dynamics, regulatory scenarios, and technological advancements that are shaping the industry. It assesses the impact of external factors and global economic changes on market growth. Lastly, it provides strategic recommendations for new entrants and established companies to navigate the complexities of the market.
Request a Free Sample
Fill in your details and we'll send you a free sample report.
- Sample data tables & charts
- Research methodology
Need a Custom Version of This Report?
Tailor the scope, geography, or segments to your exact requirements.
- Custom geography or segment scope
- Direct access to our analyst team
Frequently Asked Questions
What is the current market size for Pet Biotics market, and what is its projected size in 2032?
At what Compound Annual Growth Rate is the Pet Biotics market projected to grow between 2024 and 2032?
Which Pet Biotics market segment held the largest share in 2024?
What are the primary factors fueling the growth of the Pet Biotics market?
Who are the leading companies in the Pet Biotics market?
Which region commanded the largest share of the Pet Biotics market in 2024?
Table of Content
Chapter 1. Report Introduction
- 1.1 Report Description & Purpose
- 1.1.1 Report Title & Market Definition
- 1.1.2 Unique Selling Propositions (USP) & Key Differentiators
- 1.1.3 Value Proposition for Stakeholders
- 1.2 Research Objectives
- 1.2.1 Market Sizing Objectives (Volume & Revenue)
- 1.2.2 Segmentation Objectives
- 1.2.3 Competitive Intelligence Objectives
- 1.2.4 Forecast & Scenario Objectives
- 1.3 Report Scope
- 1.3.1 Pet Biotics Scope – Types & Subtypes Covered
- 1.3.2 Geographic Scope – Regions & Countries Covered
- 1.3.3 Historical Period, Base Year & Forecast Period (2024; forecast to 2032)
- 1.3.4 Inclusions & Exclusions
- 1.4 HS Code & Classification Framework
- 1.5 Currency, Units & Pricing Basis
- 1.6 Target Stakeholders
- 1.7 Limitations & Assumptions
Chapter 2. Executive Summary
- 2.1 Global Pet Biotics Market Snapshot
- 2.1.1 Market Size – Historical (2024) & Forecast (2024-2032) (2024: USD 820.88 million → 2032: USD 1,389.47 million)
- 2.1.2 Volume & Revenue – Global Totals
- 2.1.3 Key Market Highlights – Top Five Facts
- 2.2 Pet Biotics Market Segmentation Snapshot
- 2.2.1 Market Split by Region – 2024 vs. 2032
- 2.3 Competitive Snapshot
- 2.3.1 Top 10 Players by Revenue Share – 2024
- 2.3.2 Top 10 Players by Volume Share – 2024
- 2.3.3 Recent Strategic Developments (18-Month Summary)
- 2.4 Key Investment Highlights & Strategic Conclusions
Chapter 3. Pet Biotics Market Dynamics & Industry Analysis
- 3.1 Market Overview & Context
- 3.1.1 Pet Biotics Market Position in the Broader Automotive Value Chain
- 3.1.2 OEM vs. Replacement Market Dynamics
- 3.1.3 Market Maturity & Development Stage by Region
- 3.2 Pet Biotics Market Drivers
- 3.3 Pet Biotics Market Restraints & Challenges
- 3.4 Pet Biotics Market Opportunities
- 3.5 Porter's Five Forces Analysis
- 3.5.1 Threat of New Entrants
- 3.5.2 Bargaining Power of Suppliers
- 3.5.3 Bargaining Power of Buyers
- 3.5.4 Threat of Substitutes
- 3.5.5 Competitive Rivalry – Intensity Assessment
- 3.6 Pet Biotics Value Chain Analysis
- 3.6.1 Upstream – Raw Material/Input Suppliers
- 3.6.1.1 Raw Material/Input 1
- 3.6.1.2 Raw Material/Input 2
- 3.6.1.3 Raw Material/Input 3
- 3.6.2 Midstream – Production/Manufacturing/Service Delivery
- 3.6.2.1 Production/Process Overview
- 3.6.2.2 Key Facility Locations & Capacity by Manufacturer
- 3.6.3 Downstream – Distribution & End Consumer
- 3.6.3.1 Primary Channel – B2B/OEM
- 3.6.3.2 Secondary Channels – Dealer, Retail, Online, Direct
- 3.6.4 Value Chain Profitability Analysis
- 3.6.1 Upstream – Raw Material/Input Suppliers
- 3.7 PESTEL Analysis
- 3.7.1 Political Factors
- 3.7.2 Economic Factors
- 3.7.3 Social Factors
- 3.7.4 Technological Factors
- 3.7.5 Environmental Factors
- 3.7.6 Legal Factors
- 3.8 Pet Biotics Supply Chain Analysis
- 3.8.1 Raw Material/Input Supply Risk Assessment
- 3.8.2 Manufacturing Concentration Risk (Geographic Exposure)
- 3.8.3 Trade Disruption Impact Analysis
- 3.9 Regulatory & Policy Landscape
Note: The regulatory and policy landscape section covers regulations based on their applicability to the market, Pet Biotics category, geography, and scope of the study. Only regulatory frameworks with a material impact on operations, compliance, trade, sustainability, or market access are analyzed in detail.
Chapter 4. Key Investment Pockets & Opportunity Analysis
- 4.1 Pet Biotics Market Attractiveness Analysis
- 4.1.1 By Region – Investment Attractiveness Matrix (Volume × CAGR)
- 4.2 Absolute Revenue Growth Opportunity
- 4.2.1 By Region – Absolute USD Growth Through 2032
- 4.3 Incremental Volume Opportunity
- 4.3.1 By Region – Incremental Volume Through 2032
- 4.3.2 Segment – Incremental Volume
- 4.4 Emerging Submarket Opportunity Deep Dive (Subject to Applicability)
- 4.5 Emerging Market Opportunity Scorecards
- 4.5.1 United States
- 4.5.2 Europe
- 4.5.3 Asia
- 4.5.4 Middle East & Africa
Note: Emerging Market Opportunity Scorecards will be included based on relevance and strategic importance. Regions listed are indicative and may vary depending on data availability and market dynamics.
Chapter 5. Pet Biotics Import-Export Analysis & Trade Flows
- 5.1 Global Trade Overview
- 5.1.1 Global Export Value by Country (2024)
- 5.1.2 Global Export Volume by Country (2024)
- 5.1.3 Global Import Value by Country (2024)
- 5.1.4 Global Import Volume by Country (2024)
- 5.1.5 Net Trade Balance by Country (2024)
- 5.2 Export Analysis – Segment
- 5.2.1 Type 1 (HS Code)
- 5.2.2 Type 2 (HS Code)
- 5.2.3 Type 3 (HS Code)
- 5.2.4 Type 4 (HS Code)
- 5.2.5 Type 5 (HS Code)
- 5.3 Import Analysis – Segment
- 5.3.1 Type 1 (HS Code)
- 5.3.2 Type 2 (HS Code)
- 5.3.3 Type 3 (HS Code)
- 5.3.4 Type 4 (HS Code)
- 5.3.5 Type 5 (HS Code)
- 5.4 Average Unit Trade Prices
- 5.4.1 Average Export Price – Segment & Country
- 5.4.2 Average Import Price – Segment & Source Country
- 5.4.3 Price Trends (2024)
- 5.5 Key Trade Route Analysis
- 5.5.1 Trade Route 1
- 5.5.2 Trade Route 2
- 5.5.3 Trade Route 3
- 5.5.4 Trade Route 4
- 5.5.5 Trade Route 5
- 5.6 Trade Policy Impact Assessment
- 5.6.1 US Anti-Dumping & Section 301 Tariffs
- 5.6.2 EU Customs Union Impact
- 5.6.3 Major Free Trade Agreements
- 5.6.4 USMCA Rules of Origin
Note: Trade policy analysis will be included only where relevant to the Pet Biotics market.
Chapter 6. Competitive Landscape & Company Benchmarking
- 6.1 Pet Biotics Market Concentration & Structure
- 6.1.1 Herfindahl-Hirschman Index (HHI) – vs. 2024
- 6.1.2 Tier 1, Tier 2 & Tier 3 Market Structure
- 6.1.3 Global, Regional & Local Player Dynamics
- 6.2 Pet Biotics Market Share Analysis – 2024
- 6.2.1 Global Revenue Share by Company
- 6.2.2 Global Volume Share by Company
- 6.2.3 Regional Revenue Share
- 6.2.4 Market Share Evolution ( vs. 2024)
- 6.2.5 OEM Segment Share by Company
- 6.2.6 Replacement Segment Share by Company
- 6.3 Production/Delivery Capacity & Facility Analysis
- 6.3.1 Global Installed Capacity
- 6.3.2 Capacity Utilization Rates
- 6.3.3 Production/Output Volume
- 6.3.4 Facility Locations & Capacity Map
- 6.3.5 Planned Capacity Additions
- 6.4 Pet Biotics Competitive Benchmarking Matrix
- 6.4.1 Revenue, Volume, CAGR & Profitability Comparison
- 6.4.2 Channel Revenue Mix
- 6.4.3 Geographic Revenue Exposure
- 6.4.4 R&D Intensity
- 6.4.5 Sustainability Maturity
- 6.5 Strategic Developments in Pet Biotics (Last 24 Months)
- 6.5.1 Mergers, Acquisitions & Divestments
- 6.5.2 New Pet Biotics Launches
- 6.5.3 Facility Expansions
- 6.5.4 Strategic Alliances, Joint Ventures & Partnerships
- 6.5.5 Distribution Expansion & Market Entry
- 6.5.6 Sustainability & ESG Initiatives
- 6.6 Competitive Strategy Mapping
- 6.6.1 Leader, Challenger, Follower & Niche Classification
- 6.6.2 Pricing Strategy Comparison
- 6.6.3 Channel Strategy Matrix
Note: Strategic developments are included based on their materiality and the availability of reliable information.
Chapter 7. Global Pet Biotics Market – By Distribution Channel
- 7.1 Segment Overview
- 7.1.1 Volume & Revenue Split by Channel (2024 & 2032)
- 7.1.2 Channel Mix Evolution (2024-2032)
Chapter 8. Regional Market Analysis – Global Overview
- 8.1 Global Regional Overview
- 8.1.1 Regional Volume Share
- 8.1.2 Regional Revenue Share
- 8.1.3 Regional Volume by Region
- 8.1.4 Regional Revenue by Region
- 8.1.5 Regional Forecast Through 2032
- 8.2 Cross-Regional Segment Analysis
- 8.2.1 By Distribution Channel
- 8.2.2 By Brand/Price Tier
Chapter 9. North America Pet Biotics Market
- 9.1 United States
- 9.2 Canada
- 9.3 Mexico
Chapter 10. Europe Pet Biotics Market
- 10.1 Germany
- 10.2 France
- 10.3 Italy
- 10.4 United Kingdom
- 10.5 Spain
- 10.6 Poland
- 10.7 Russia
- 10.8 Netherlands
- 10.9 Belgium
- 10.10 Sweden
- 10.11 Denmark
- 10.12 Norway
- 10.13 Rest of Europe
Chapter 11. Asia Pacific Pet Biotics Market
- 11.1 China
- 11.2 India
- 11.3 Japan
- 11.4 South Korea
- 11.5 Thailand
- 11.6 Indonesia
- 11.7 Vietnam
- 11.8 Malaysia
- 11.9 Australia
- 11.10 Rest of Asia Pacific
Chapter 12. Latin America Pet Biotics Market
- 12.1 Brazil
- 12.2 Argentina
- 12.3 Colombia
- 12.4 Chile
- 12.5 Rest of Latin America
Chapter 13. Middle East Pet Biotics Market
- 13.1 Saudi Arabia
- 13.2 United Arab Emirates
- 13.3 Turkey
- 13.4 Israel
- 13.5 Iran
- 13.6 Rest of the Middle East
Chapter 14. Africa Pet Biotics Market
- 14.1 South Africa
- 14.2 Egypt
- 14.3 Nigeria
- 14.4 Morocco
- 14.5 Rest of Africa
Chapter 15. Pet Biotics Company Profiles
- 15.1 [Company 01]
- 15.1.1 Company Overview
- 15.1.2 Key Management Personnel
- 15.1.3 Products & Services Portfolio
- 15.1.4 Financial Performance
- 15.1.5 Key Market Focus & Geographic Presence
- 15.1.6 Recent Developments & Strategic Initiatives
Note: The company profile list is preliminary and may change based on research findings, market developments, data availability, and client requirements.
Chapter 16. Appendices
- Appendix A – List of Abbreviations & Acronyms
- Appendix B – Industry Classification Code Reference – Full Series
- Appendix C – Production & Capacity Data Tables
- Appendix D – End-Use & Demand Base Tables
- Appendix E – Consumption & Replacement Rate Assumptions
- Appendix F – ASP Reference Tables
- Appendix G – Manufacturing & Facility Database
- Appendix H – Import-Export Data Tables
- Appendix I – Regulatory Summary Tables
- Appendix J – Primary Research Participant List (Anonymized)
- Appendix K – Primary Research Questionnaire Framework
- Appendix L – Data Sources & Bibliography
- Appendix M – Market Size Divergence & Source Comparison
Chapter 17. Research Methodology
- 17.1 Research Framework & Philosophy
- 17.2 Secondary Research – Sources, Hierarchy & Data Extraction
- 17.3 Data Modeling – Bottom-Up & Top-Down Market Sizing
- 17.4 Primary Research – Stakeholder Framework, LOI & Sample Sizes
- 17.5 Forecast Methodology – Regression, Scenario & Sensitivity Analysis
- 17.6 Quality Control – Four-Layer Validation Framework
- 17.7 Limitations & Standard Assumptions
- 17.8 Disclaimer
