
Market Overview:
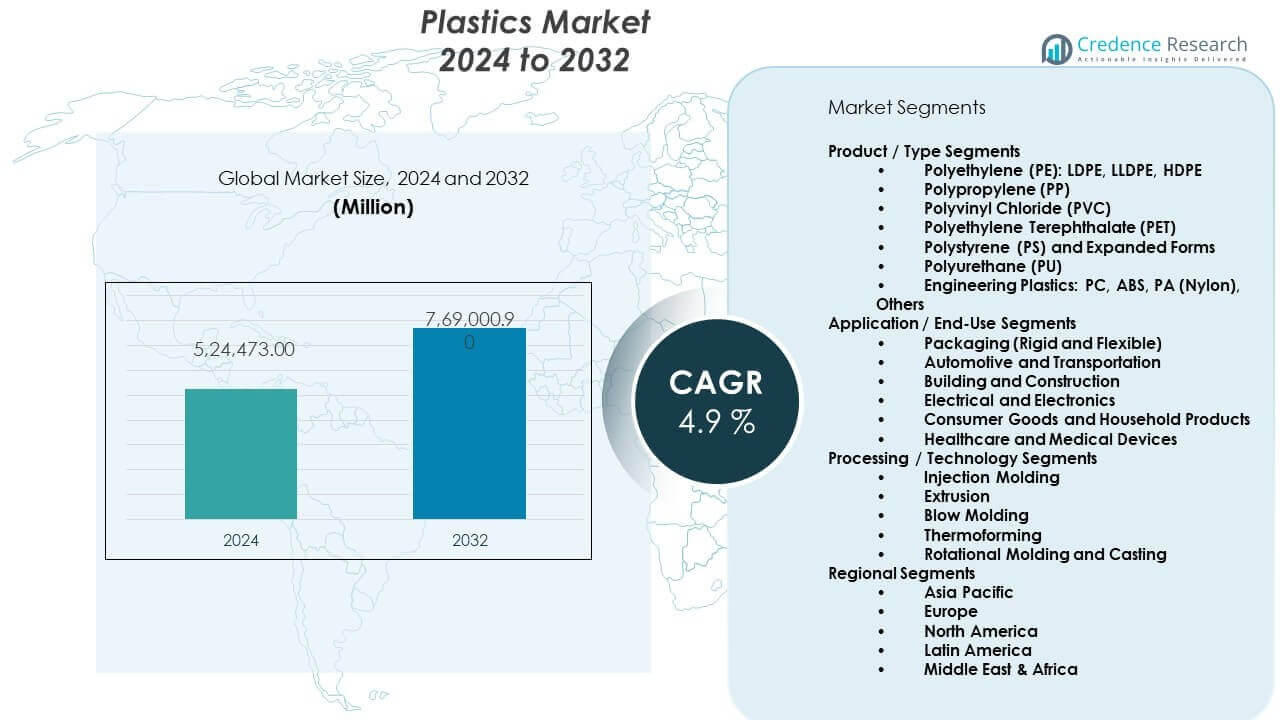
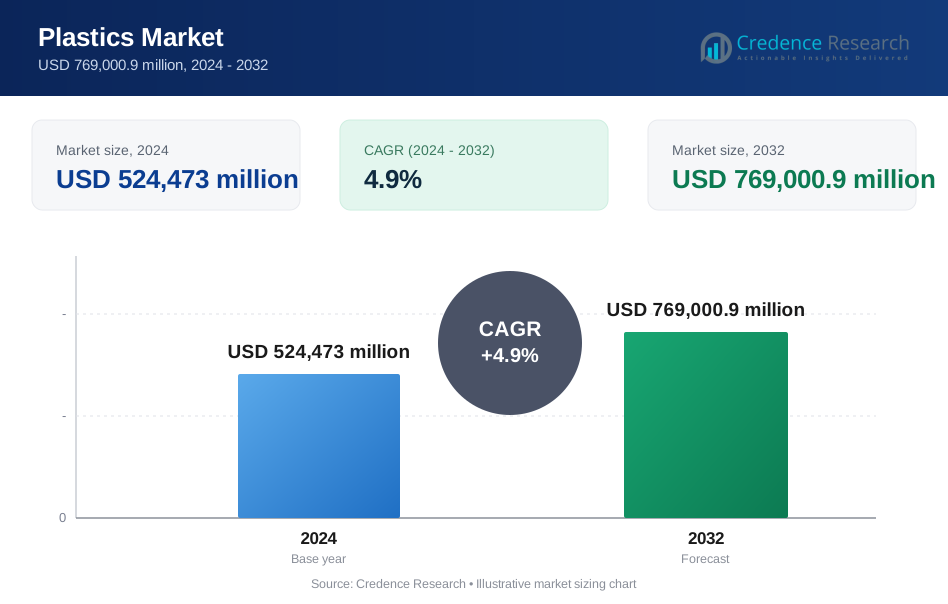
The Plastics market is projected to grow steadily during the forecast period. The market stood at USD 524,473 million in 2024 and is expected to reach USD 769,000.9 million by 2032. The Plastics market is projected to grow at a CAGR of 4.9% from 2024 to 2032.
| REPORT ATTRIBUTE | DETAILS |
|---|---|
| Historical Period | 2020-2023 |
| Base Year | 2024 |
| Forecast Period | 2025-2032 |
| Plastics Market Size 2024 | USD 524,473 million |
| Plastics Market, CAGR | 4.9% |
| Plastics Market Size 2032 | USD 769,000.9 million |
Market growth is driven by rising use of plastics in packaging, construction, and transportation sectors. Urban development increases demand for plastic pipes, insulation, and fittings. Food and beverage companies rely on lightweight and protective plastic packaging. Automotive manufacturers use plastics to reduce vehicle weight and improve fuel efficiency. Healthcare applications support steady demand for medical-grade plastics. Recycling improvements enhance material reuse and supply security. Manufacturers invest in advanced polymers to improve performance. Design flexibility also supports adoption across diverse industrial applications.
Asia Pacific leads the Plastics market due to large-scale manufacturing and strong domestic consumption. China and India drive demand through construction, packaging, and consumer goods production. Southeast Asian countries gain momentum from electronics and export-oriented manufacturing. North America shows stable demand from automotive, healthcare, and packaging industries. Europe focuses on sustainable plastics and circular economy practices. Germany and France support demand for engineering plastics. Latin America grows through infrastructure projects. The Middle East and Africa emerge with industrial and packaging investments.
Market Insights:
- The Plastics market stood at USD 524,473 million in 2024 and is projected to reach USD 769,000.9 million by 2032, registering a CAGR of 4.9% during the forecast period.
- Asia Pacific leads with about 45% share, driven by large-scale manufacturing, population growth, and packaging demand, while Europe holds around 22% due to strong engineering plastics use, and North America accounts for nearly 20% supported by automotive, healthcare, and consumer goods industries.
- Asia Pacific also remains the fastest-growing region with a 45% share, supported by infrastructure expansion, export-oriented manufacturing, and rising consumer demand in China, India, and Southeast Asia.
- By application, packaging dominates with an estimated 40% share, reflecting strong food, beverage, and logistics demand, followed by automotive and transportation at around 15% due to lightweight material adoption.
- By product type, polyethylene and polypropylene together account for nearly 50% share, supported by broad use in packaging, construction, and consumer manufacturing.
Market Drivers:
Expanding Demand From Packaging, Construction, And Consumer Manufacturing Industries
The Plastics market gains strong support from rising global packaging demand across industries. Food and beverage brands rely on plastics for safety, durability, and shelf life. Retail expansion increases demand for flexible and rigid packaging formats. Construction activity supports plastic use in pipes, insulation, and panels. Urban housing projects depend on durable and cost-efficient materials. Consumer goods manufacturers value lightweight and moldable properties. Cost control improves adoption across mass production sectors. The Plastics market benefits from wide application flexibility.
- For instance, Coca-Cola uses PET bottles with oxygen barrier layers that extend carbonated drink shelf life beyond 26 weeks, supporting global distribution.
Rising Automotive Production And Lightweight Material Preference
Automotive manufacturers increase plastic use to reduce vehicle weight and improve efficiency. Lightweight components support fuel economy and emission targets. Interior parts rely on plastics for comfort and consistent design. Electrical systems depend on plastic insulation and connectors. Global vehicle production sustains steady material demand. Electric vehicle growth raises plastic content per unit. Durability and impact resistance strengthen material acceptance. The Plastics market supports long-term automotive cost strategies.
- For instance, BMW Group uses glass-fiber-reinforced plastics in structural components, cutting part weight by up to 30% compared to steel.
Growth In Healthcare, Medical Devices, And Hygiene Applications
Healthcare systems depend on plastics for sterile and disposable products. Medical devices require precise and reliable polymer materials. Hospital expansion supports continuous consumption of plastic supplies. Diagnostic equipment uses plastics for safety and accuracy. Pharmaceutical packaging relies on contamination-resistant materials. Public health awareness supports single-use medical plastics. Manufacturers maintain strict quality standards. The Plastics market benefits from stable healthcare demand.
Industrial Expansion And Manufacturing Output Across Emerging Economies
Industrial growth supports higher plastic use in machinery and components. Factories depend on plastics for housings and protective parts. Electronics production relies on insulation and lightweight enclosures. Appliance manufacturers favor plastics for durability and cost control. Export-oriented manufacturing drives large-volume consumption. Emerging economies expand domestic production capacity. Infrastructure investment supports long-term material demand. The Plastics market aligns with industrial expansion trends.
Market Trends:
Shift Toward Recycled Plastics And Circular Material Practices
Manufacturers increase recycled plastic use across product lines. Brands commit to circular material targets. Packaging firms adopt post-consumer recycled content. Material suppliers improve recycling quality standards. Closed-loop systems gain industry acceptance. Recycled plastics support sustainability goals. Cost stability improves with local recycled feedstock. The Plastics market reflects gradual structural shifts.
- For instance, Coca-Cola rolled out 100% recycled PET bottles, excluding caps and labels, across multiple European markets, reducing virgin plastic use per bottle by over 50%.
Rising Use Of High-Performance And Engineering Plastics
Industries adopt advanced plastics for strength and heat resistance. Electronics applications demand precision polymer materials. Automotive designs use engineering plastics for structural parts. Industrial equipment relies on wear-resistant components. Product lifecycles improve through material innovation. Design freedom supports complex part production. Producers invest in performance upgrades. The Plastics market benefits from specialty material growth.
- For instance, BASF expanded Ultramid polyamide grades that withstand continuous temperatures above 200°C for automotive under-the-hood parts.
Digital Manufacturing And Automation In Plastic Processing
Producers integrate automation into plastic molding operations. Digital controls improve process consistency and output quality. Smart factories reduce waste and downtime. Injection molding systems support high-speed production. Data monitoring improves material efficiency. Automation strengthens manufacturing reliability. Labor productivity improves across plants. The Plastics market aligns with smart factory adoption.
Customization And Design Flexibility Across End-Use Products
Brands demand customized plastic shapes and finishes. Consumer goods rely on rapid design changes. Advanced molding supports complex product designs. Color and texture options increase product appeal. Low tooling costs support frequent updates. Short production cycles favor plastic materials. Customization improves brand differentiation. The Plastics market supports flexible design needs.
Market Challenges Analysis:
Environmental Concerns And Regulatory Pressure On Plastic Usage
Public concern over plastic waste affects material perception. Governments enforce stricter waste regulations. Single-use plastic bans affect certain applications. Compliance increases operational complexity for manufacturers. Recycling infrastructure gaps limit recovery rates. Producer responsibility rules raise cost pressure. Brand scrutiny influences material choices. The Plastics market faces sustained regulatory challenges.
Raw Material Price Volatility And Supply Chain Disruptions
Plastic production depends on petrochemical feedstocks. Oil price swings affect resin costs. Supply disruptions impact material availability. Logistics delays increase procurement risk. Manufacturers face margin pressure during price shifts. Inventory planning becomes complex. Regional imbalances affect production schedules. The Plastics market manages ongoing supply risks.
Market Opportunities:
Advancement In Bio-Based And Sustainable Plastic Materials
Companies invest in bio-based plastic alternatives. Renewable feedstocks reduce fossil dependence. Sustainable materials improve public acceptance. Packaging firms test compostable plastic solutions. Material innovation improves performance reliability. Policy support encourages eco-friendly adoption. Early adoption supports competitive advantage. The Plastics market opens sustainable growth paths.
Emerging Markets And Infrastructure Development Potential
Developing regions expand construction and packaging demand. Urban population growth increases material use. Local manufacturing reduces import reliance. Infrastructure projects support long-term demand. Affordable housing programs use plastic materials. Consumer goods penetration rises steadily. Industrial zones attract processing investments. The Plastics market benefits from regional expansion.
Market Segmentation Analysis:
Product / Type Segments
Polyethylene, polypropylene, and PVC form the volume backbone of the Plastics market. Polyethylene grades support films, containers, and piping due to flexibility and strength. Polypropylene serves automotive parts and packaging with heat resistance. PVC supports construction through pipes, profiles, and insulation uses. PET dominates beverage bottles and food packaging with clarity benefits. Polystyrene and expanded forms serve insulation and protective packaging needs. Polyurethane supports foams, coatings, and cushioning applications. Engineering plastics meet demand for strength, heat resistance, and precision parts.
- For instance, LyondellBasell produces Hostalen HDPE used in pressure pipes rated for service lives exceeding 50 years.
Application / End-Use Segments
Packaging represents the largest application due to food safety and logistics demand. Automotive uses plastics for weight reduction and interior components. Building and construction rely on plastics for durability and corrosion resistance. Electrical and electronics depend on plastics for insulation and housings. Consumer goods use plastics for cost efficiency and design flexibility. Healthcare applications require sterile and reliable plastic materials. Medical devices and disposables support steady consumption. End-use diversity stabilizes demand across economic cycles.
- For instance, Amcor integrates recycled polymers in flexible packaging while maintaining food-contact compliance.
Processing / Technology Segments
Injection molding supports high-volume and precision part production. Extrusion enables films, pipes, sheets, and profiles at scale. Blow molding dominates bottles, containers, and hollow products. Thermoforming supports trays, food containers, and lightweight panels. Rotational molding serves tanks and large hollow products. Casting supports specialty and low-volume applications. Technology choice depends on part complexity and volume needs. Processing diversity improves manufacturing flexibility and output efficiency.
Segmentation:
Product / Type Segments
- Polyethylene (PE): LDPE, LLDPE, HDPE
- Polypropylene (PP)
- Polyvinyl Chloride (PVC)
- Polyethylene Terephthalate (PET)
- Polystyrene (PS) and Expanded Forms
- Polyurethane (PU)
- Engineering Plastics: PC, ABS, PA (Nylon), Others
Application / End-Use Segments
- Packaging (Rigid and Flexible)
- Automotive and Transportation
- Building and Construction
- Electrical and Electronics
- Consumer Goods and Household Products
- Healthcare and Medical Devices
Processing / Technology Segments
- Injection Molding
- Extrusion
- Blow Molding
- Thermoforming
- Rotational Molding and Casting
Regional Segments
- North America
- U.S.
- Canada
- Mexico
- Europe
- Germany
- France
- U.K.
- Italy
- Spain
- Rest of Europe
- Asia Pacific
- China
- Japan
- India
- South Korea
- South-east Asia
- Rest of Asia Pacific
- Latin America
- Brazil
- Argentina
- Rest of Latin America
- Middle East & Africa
- GCC Countries
- South Africa
- Rest of the Middle East and Africa
Regional Analysis:
Asia Pacific Regional Overview
Asia Pacific leads the global plastics industry with an estimated market share of about 45%. China and India anchor demand through packaging, construction, and consumer goods output. Manufacturing scale, cost efficiency, and large populations support volume growth. Electronics and automotive production strengthen regional polymer consumption. Southeast Asia gains momentum from export-oriented packaging and appliances. Infrastructure expansion sustains pipe and insulation demand. The Plastics market benefits from strong domestic consumption and industrial capacity in this region.
Europe And North America Regional Overview
Europe holds close to 22% of the global market, supported by advanced manufacturing. Germany, France, and Italy drive demand for engineering and specialty plastics. Sustainability rules influence material selection and recycling adoption. North America accounts for around 20% market share with stable industrial demand. The United States leads regional consumption across packaging, healthcare, and automotive uses. Innovation in high-performance polymers supports value growth. The Plastics market in these regions shows maturity with steady replacement demand.
Latin America And Middle East & Africa Regional Overview
Latin America represents nearly 8% of the global plastics market. Brazil and Mexico lead regional demand through packaging and construction growth. Urban development supports steady material consumption across applications. The Middle East & Africa holds close to 5% market share. GCC countries benefit from petrochemical integration and export capacity. Africa shows gradual growth from infrastructure and consumer goods expansion. The Plastics market in these regions reflects emerging demand and long-term potential.
Key Player Analysis:
- ExxonMobil Chemical Company
- SABIC
- Dow Inc.
- LyondellBasell Industries
- BASF SE
- INEOS Group
- Borealis AG
- Formosa Plastics Corporation
- Covestro AG
- DuPont de Nemours, Inc.
- LG Chem Ltd.
- Mitsubishi Chemical Group
- Evonik Industries AG
Competitive Analysis:
The Plastics market shows a moderately concentrated structure led by global chemical majors. Companies such as BASF SE, Dow Inc., and LyondellBasell Industries control large-scale resin production. SABIC and ExxonMobil Chemical Company strengthen supply through integrated feedstock access. Competition centers on capacity scale, product range, and cost efficiency. Players focus on specialty and value-added polymers to protect margins. Regional producers compete through pricing and local supply strength. Strategic partnerships improve market access and technology reach. It remains competitive through innovation, global distribution, and long-term customer contracts.
Recent Developments:
- In the plastics market, ExxonMobil Chemical Company launched its transformative Signature Polymers initiative in October 2024, unifying its polyolefin products under a single portfolio brand designed to deepen customer partnerships. The company is accelerating six major projects in 2025, including a chemical complex in China, a hydrofiner in Fawley, UK, and the Singapore resid upgrade, alongside renewable diesel production in Strathcona, Canada and advanced plastics recycling units in Baytown, Texas. ExxonMobil expanded its Proxxima™ thermoset resin manufacturing facilities in East Texas with a targeted feedstock production capacity of nearly 200,000 metric tons per year by 2030. In May 2025, ExxonMobil signed a significant long-term partnership with Marubeni Corporation for approximately 250,000 tonnes of low-carbon ammonia annually from its Baytown facility, expected to produce virtually carbon-free hydrogen with 98% CO2 removal. Further strengthening its sustainability portfolio, ExxonMobil formed a strategic collaboration with BASF in November 2025 to advance methane pyrolysis technology, including plans to construct a demonstration plant in Baytown capable of producing up to 2,000 tons of low-carbon hydrogen and 6,000 tons of solid carbon product annually.
- SABIC, the Saudi petrochemical giant, made a final investment decision in January 2024 on a $6.4 billion Fujian petrochemical complex in China, positioning the company for significant expansion in Asia. The complex, developed through a 51:49 joint venture between SABIC Industrial Investment Co and Fujian Fuhua Gulei Petrochemical, includes a mixed-feed steam cracker with up to 1.8 million tonne per year ethylene capacity and various downstream production units for ethylene glycols, polyethylene, polypropylene, and polycarbonate. Operating as a 70% subsidiary of Saudi Aramco since June 2020, SABIC has achieved $468 million in cumulative synergy value through strategic integration with Aramco's upstream production capabilities.
- Dow Inc. executed significant portfolio optimization through strategic divestitures focused on its best-owner strategy. In December 2024, Arkema finalized the acquisition of Dow's flexible packaging laminating adhesives business, generating approximately $250 million in annual sales and employing 280 people across five production sites in Italy, the United States, and Mexico. The acquisition enabled Arkema to become a key player in the flexible packaging market, with expectations for $30 million in EBITDA synergies after five years based on an enterprise value of $150 million. Additionally, Dow agreed in June 2025 to sell its 50% ownership interest in DowAksa Advanced Composites Holdings BV to Aksa Akrilik Kimya Sanayii A.Ş. for approximately $125 million, with expected close in Q3 2025.
Report Coverage:
The research report offers an in-depth analysis based on product and type segments, application and end-use industries, processing technologies, and regional markets. It details leading market players, providing an overview of their business, product offerings, investments, revenue streams, and key applications. Additionally, the report includes insights into the competitive environment, SWOT analysis, current market trends, as well as the primary drivers and constraints. Furthermore, it discusses various factors that have driven market expansion in recent years. The report also explores market dynamics, regulatory scenarios, and technological advancements that are shaping the industry. It assesses the impact of external factors and global economic changes on market growth. Lastly, it provides strategic recommendations for new entrants and established companies to navigate the complexities of the market.
Future Outlook:
- Packaging demand will continue to support steady consumption across flexible and rigid plastic formats.
- Automotive lightweighting will increase plastic use in interior, exterior, and electrical components.
- Recycling adoption will expand as manufacturers align with circular material practices.
- Engineering plastics will gain traction in electronics, industrial, and mobility applications.
- Bio-based and low-impact plastics will attract greater research and investment focus.
- Emerging economies will drive volume growth through urbanization and infrastructure projects.
- Automation in processing will improve quality consistency and production efficiency.
- Supply chains will shift toward regional sourcing to improve resilience and cost control.
- Regulatory pressure will influence material design and product selection strategies.
- Product innovation will remain central to long-term competitiveness in plastics.
Request a Free Sample
Fill in your details and we'll send you a free sample report.
- Sample data tables & charts
- Research methodology
Need a Custom Version of This Report?
Tailor the scope, geography, or segments to your exact requirements.
- Custom geography or segment scope
- Direct access to our analyst team
Frequently Asked Questions
What is the current market size for Plastics market, and what is its projected size in 2032?
At what Compound Annual Growth Rate is the Plastics market projected to grow between 2025 and 2032?
Which Plastics market segment held the largest share in 2024?
What are the primary factors fueling the growth of the Plastics market?
Who are the leading companies in the Plastics market?
Which region commanded the largest share of the Plastics market in 2024?
Table of Content
Chapter 1. Report Introduction
- 1.1 Report Description & Purpose
- 1.1.1 Report Title & Market Definition
- 1.1.2 Unique Selling Propositions (USP) & Key Differentiators
- 1.1.3 Value Proposition for Stakeholders
- 1.2 Research Objectives
- 1.2.1 Market Sizing Objectives (Volume & Revenue)
- 1.2.2 Segmentation Objectives
- 1.2.3 Competitive Intelligence Objectives
- 1.2.4 Forecast & Scenario Objectives
- 1.3 Report Scope
- 1.3.1 Plastics Scope – Types & Subtypes Covered
- 1.3.2 Geographic Scope – Regions & Countries Covered
- 1.3.3 Historical Period, Base Year & Forecast Period (2024; forecast to 2032)
- 1.3.4 Inclusions & Exclusions
- 1.4 HS Code & Classification Framework
- 1.5 Currency, Units & Pricing Basis
- 1.6 Target Stakeholders
- 1.7 Limitations & Assumptions
Chapter 2. Executive Summary
- 2.1 Global Plastics Market Snapshot
- 2.1.1 Market Size – Historical (2024) & Forecast (2024-2032) (2024: USD 524,473 million → 2032: USD 769,000.9 million)
- 2.1.2 Volume & Revenue – Global Totals
- 2.1.3 Key Market Highlights – Top Five Facts
- 2.2 Plastics Market Segmentation Snapshot
- 2.2.1 Market Split by Region – 2024 vs. 2032
- 2.3 Competitive Snapshot
- 2.3.1 Top 10 Players by Revenue Share – 2024
- 2.3.2 Top 10 Players by Volume Share – 2024
- 2.3.3 Recent Strategic Developments (18-Month Summary)
- 2.4 Key Investment Highlights & Strategic Conclusions
Chapter 3. Plastics Market Dynamics & Industry Analysis
- 3.1 Market Overview & Context
- 3.1.1 Plastics Market Position in the Broader Automotive Value Chain
- 3.1.2 OEM vs. Replacement Market Dynamics
- 3.1.3 Market Maturity & Development Stage by Region
- 3.2 Plastics Market Drivers
- 3.3 Plastics Market Restraints & Challenges
- 3.4 Plastics Market Opportunities
- 3.5 Porter's Five Forces Analysis
- 3.5.1 Threat of New Entrants
- 3.5.2 Bargaining Power of Suppliers
- 3.5.3 Bargaining Power of Buyers
- 3.5.4 Threat of Substitutes
- 3.5.5 Competitive Rivalry – Intensity Assessment
- 3.6 Plastics Value Chain Analysis
- 3.6.1 Upstream – Raw Material/Input Suppliers
- 3.6.1.1 Raw Material/Input 1
- 3.6.1.2 Raw Material/Input 2
- 3.6.1.3 Raw Material/Input 3
- 3.6.2 Midstream – Production/Manufacturing/Service Delivery
- 3.6.2.1 Production/Process Overview
- 3.6.2.2 Key Facility Locations & Capacity by Manufacturer
- 3.6.3 Downstream – Distribution & End Consumer
- 3.6.3.1 Primary Channel – B2B/OEM
- 3.6.3.2 Secondary Channels – Dealer, Retail, Online, Direct
- 3.6.4 Value Chain Profitability Analysis
- 3.6.1 Upstream – Raw Material/Input Suppliers
- 3.7 PESTEL Analysis
- 3.7.1 Political Factors
- 3.7.2 Economic Factors
- 3.7.3 Social Factors
- 3.7.4 Technological Factors
- 3.7.5 Environmental Factors
- 3.7.6 Legal Factors
- 3.8 Plastics Supply Chain Analysis
- 3.8.1 Raw Material/Input Supply Risk Assessment
- 3.8.2 Manufacturing Concentration Risk (Geographic Exposure)
- 3.8.3 Trade Disruption Impact Analysis
- 3.9 Regulatory & Policy Landscape
Note: The regulatory and policy landscape section covers regulations based on their applicability to the market, Plastics category, geography, and scope of the study. Only regulatory frameworks with a material impact on operations, compliance, trade, sustainability, or market access are analyzed in detail.
Chapter 4. Key Investment Pockets & Opportunity Analysis
- 4.1 Plastics Market Attractiveness Analysis
- 4.1.1 By Region – Investment Attractiveness Matrix (Volume × CAGR)
- 4.2 Absolute Revenue Growth Opportunity
- 4.2.1 By Region – Absolute USD Growth Through 2032
- 4.3 Incremental Volume Opportunity
- 4.3.1 By Region – Incremental Volume Through 2032
- 4.3.2 Segment – Incremental Volume
- 4.4 Emerging Submarket Opportunity Deep Dive (Subject to Applicability)
- 4.5 Emerging Market Opportunity Scorecards
- 4.5.1 United States
- 4.5.2 Europe
- 4.5.3 Asia
- 4.5.4 Middle East & Africa
Note: Emerging Market Opportunity Scorecards will be included based on relevance and strategic importance. Regions listed are indicative and may vary depending on data availability and market dynamics.
Chapter 5. Plastics Import-Export Analysis & Trade Flows
- 5.1 Global Trade Overview
- 5.1.1 Global Export Value by Country (2024)
- 5.1.2 Global Export Volume by Country (2024)
- 5.1.3 Global Import Value by Country (2024)
- 5.1.4 Global Import Volume by Country (2024)
- 5.1.5 Net Trade Balance by Country (2024)
- 5.2 Export Analysis – Segment
- 5.2.1 Type 1 (HS Code)
- 5.2.2 Type 2 (HS Code)
- 5.2.3 Type 3 (HS Code)
- 5.2.4 Type 4 (HS Code)
- 5.2.5 Type 5 (HS Code)
- 5.3 Import Analysis – Segment
- 5.3.1 Type 1 (HS Code)
- 5.3.2 Type 2 (HS Code)
- 5.3.3 Type 3 (HS Code)
- 5.3.4 Type 4 (HS Code)
- 5.3.5 Type 5 (HS Code)
- 5.4 Average Unit Trade Prices
- 5.4.1 Average Export Price – Segment & Country
- 5.4.2 Average Import Price – Segment & Source Country
- 5.4.3 Price Trends (2024)
- 5.5 Key Trade Route Analysis
- 5.5.1 Trade Route 1
- 5.5.2 Trade Route 2
- 5.5.3 Trade Route 3
- 5.5.4 Trade Route 4
- 5.5.5 Trade Route 5
- 5.6 Trade Policy Impact Assessment
- 5.6.1 US Anti-Dumping & Section 301 Tariffs
- 5.6.2 EU Customs Union Impact
- 5.6.3 Major Free Trade Agreements
- 5.6.4 USMCA Rules of Origin
Note: Trade policy analysis will be included only where relevant to the Plastics market.
Chapter 6. Competitive Landscape & Company Benchmarking
- 6.1 Plastics Market Concentration & Structure
- 6.1.1 Herfindahl-Hirschman Index (HHI) – vs. 2024
- 6.1.2 Tier 1, Tier 2 & Tier 3 Market Structure
- 6.1.3 Global, Regional & Local Player Dynamics
- 6.2 Plastics Market Share Analysis – 2024
- 6.2.1 Global Revenue Share by Company
- 6.2.2 Global Volume Share by Company
- 6.2.3 Regional Revenue Share
- 6.2.4 Market Share Evolution ( vs. 2024)
- 6.2.5 OEM Segment Share by Company
- 6.2.6 Replacement Segment Share by Company
- 6.3 Production/Delivery Capacity & Facility Analysis
- 6.3.1 Global Installed Capacity
- 6.3.2 Capacity Utilization Rates
- 6.3.3 Production/Output Volume
- 6.3.4 Facility Locations & Capacity Map
- 6.3.5 Planned Capacity Additions
- 6.4 Plastics Competitive Benchmarking Matrix
- 6.4.1 Revenue, Volume, CAGR & Profitability Comparison
- 6.4.2 Channel Revenue Mix
- 6.4.3 Geographic Revenue Exposure
- 6.4.4 R&D Intensity
- 6.4.5 Sustainability Maturity
- 6.5 Strategic Developments in Plastics (Last 24 Months)
- 6.5.1 Mergers, Acquisitions & Divestments
- 6.5.2 New Plastics Launches
- 6.5.3 Facility Expansions
- 6.5.4 Strategic Alliances, Joint Ventures & Partnerships
- 6.5.5 Distribution Expansion & Market Entry
- 6.5.6 Sustainability & ESG Initiatives
- 6.6 Competitive Strategy Mapping
- 6.6.1 Leader, Challenger, Follower & Niche Classification
- 6.6.2 Pricing Strategy Comparison
- 6.6.3 Channel Strategy Matrix
Note: Strategic developments are included based on their materiality and the availability of reliable information.
Chapter 7. Global Plastics Market – By Distribution Channel
- 7.1 Segment Overview
- 7.1.1 Volume & Revenue Split by Channel (2024 & 2032)
- 7.1.2 Channel Mix Evolution (2024-2032)
Chapter 8. Regional Market Analysis – Global Overview
- 8.1 Global Regional Overview
- 8.1.1 Regional Volume Share
- 8.1.2 Regional Revenue Share
- 8.1.3 Regional Volume by Region
- 8.1.4 Regional Revenue by Region
- 8.1.5 Regional Forecast Through 2032
- 8.2 Cross-Regional Segment Analysis
- 8.2.1 By Distribution Channel
- 8.2.2 By Brand/Price Tier
Chapter 9. North America Plastics Market
- 9.1 United States
- 9.2 Canada
- 9.3 Mexico
Chapter 10. Europe Plastics Market
- 10.1 Germany
- 10.2 France
- 10.3 Italy
- 10.4 United Kingdom
- 10.5 Spain
- 10.6 Poland
- 10.7 Russia
- 10.8 Netherlands
- 10.9 Belgium
- 10.10 Sweden
- 10.11 Denmark
- 10.12 Norway
- 10.13 Rest of Europe
Chapter 11. Asia Pacific Plastics Market
- 11.1 China
- 11.2 India
- 11.3 Japan
- 11.4 South Korea
- 11.5 Thailand
- 11.6 Indonesia
- 11.7 Vietnam
- 11.8 Malaysia
- 11.9 Australia
- 11.10 Rest of Asia Pacific
Chapter 12. Latin America Plastics Market
- 12.1 Brazil
- 12.2 Argentina
- 12.3 Colombia
- 12.4 Chile
- 12.5 Rest of Latin America
Chapter 13. Middle East Plastics Market
- 13.1 Saudi Arabia
- 13.2 United Arab Emirates
- 13.3 Turkey
- 13.4 Israel
- 13.5 Iran
- 13.6 Rest of the Middle East
Chapter 14. Africa Plastics Market
- 14.1 South Africa
- 14.2 Egypt
- 14.3 Nigeria
- 14.4 Morocco
- 14.5 Rest of Africa
Chapter 15. Plastics Company Profiles
- 15.1 [Company 01]
- 15.1.1 Company Overview
- 15.1.2 Key Management Personnel
- 15.1.3 Products & Services Portfolio
- 15.1.4 Financial Performance
- 15.1.5 Key Market Focus & Geographic Presence
- 15.1.6 Recent Developments & Strategic Initiatives
Note: The company profile list is preliminary and may change based on research findings, market developments, data availability, and client requirements.
Chapter 16. Appendices
- Appendix A – List of Abbreviations & Acronyms
- Appendix B – Industry Classification Code Reference – Full Series
- Appendix C – Production & Capacity Data Tables
- Appendix D – End-Use & Demand Base Tables
- Appendix E – Consumption & Replacement Rate Assumptions
- Appendix F – ASP Reference Tables
- Appendix G – Manufacturing & Facility Database
- Appendix H – Import-Export Data Tables
- Appendix I – Regulatory Summary Tables
- Appendix J – Primary Research Participant List (Anonymized)
- Appendix K – Primary Research Questionnaire Framework
- Appendix L – Data Sources & Bibliography
- Appendix M – Market Size Divergence & Source Comparison
Chapter 17. Research Methodology
- 17.1 Research Framework & Philosophy
- 17.2 Secondary Research – Sources, Hierarchy & Data Extraction
- 17.3 Data Modeling – Bottom-Up & Top-Down Market Sizing
- 17.4 Primary Research – Stakeholder Framework, LOI & Sample Sizes
- 17.5 Forecast Methodology – Regression, Scenario & Sensitivity Analysis
- 17.6 Quality Control – Four-Layer Validation Framework
- 17.7 Limitations & Standard Assumptions
- 17.8 Disclaimer
