
Market Overview
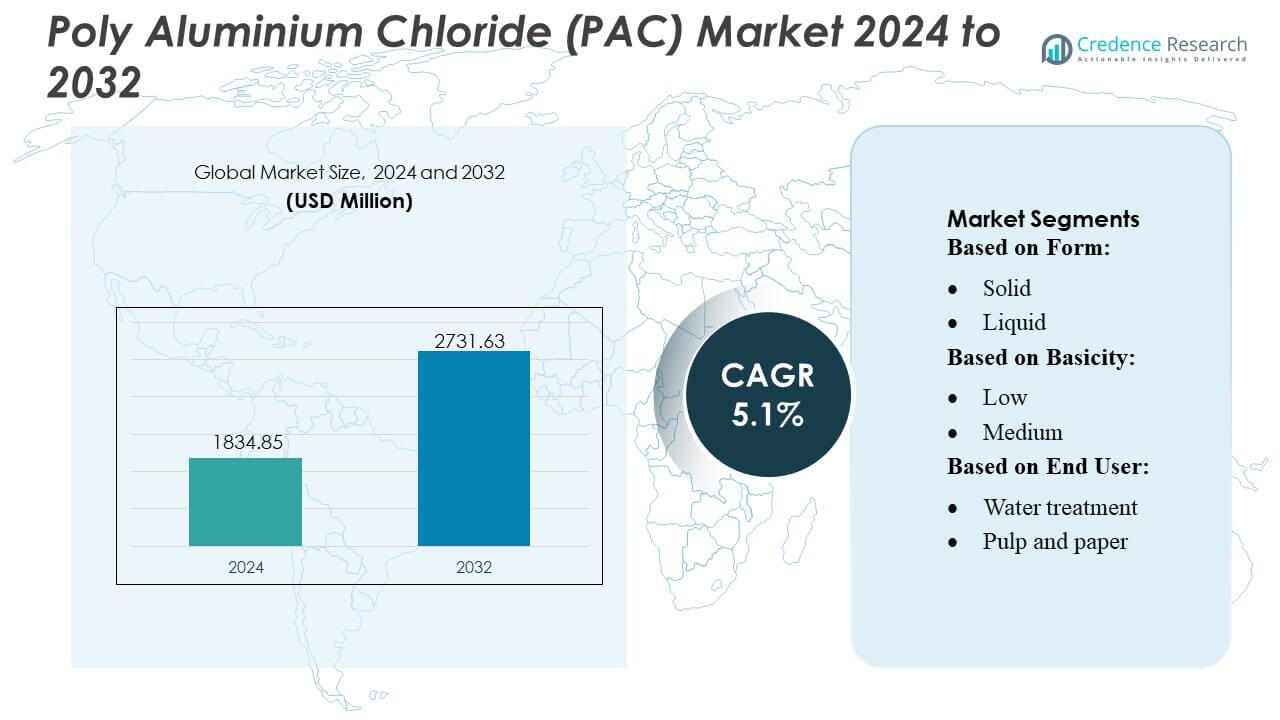
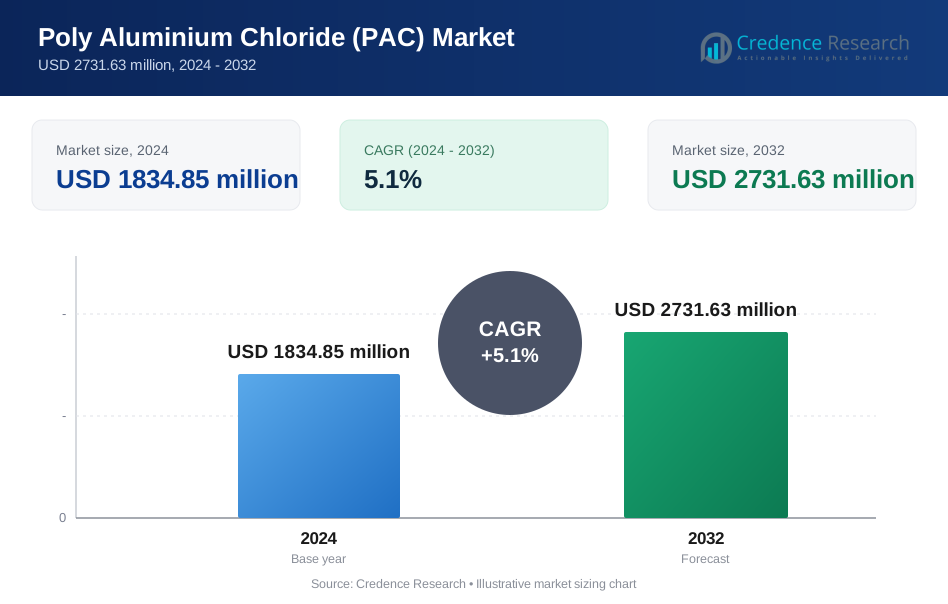
Poly Aluminium Chloride (PAC) Market size was valued USD 1834.85 million in 2024 and is anticipated to reach USD 2731.63 million by 2032, at a CAGR of 5.1% during the forecast period.
| REPORT ATTRIBUTE | DETAILS |
|---|---|
| Historical Period | 2020-2023 |
| Base Year | 2024 |
| Forecast Period | 2025-2032 |
| Poly Aluminium Chloride (PAC) Market Size 2024 | USD 1834.85 Million |
| Poly Aluminium Chloride (PAC) Market, CAGR | 5.1% |
| Poly Aluminium Chloride (PAC) Market Size 2032 | USD 2731.63 Million |
The Poly Aluminium Chloride (PAC) market features a competitive landscape shaped by global chemical manufacturers and specialized water treatment suppliers that focus on high-basicity formulations, cost-efficient production, and consistent product quality. Companies strengthen their market position through capacity expansions, automated process control, and long-term supply agreements with municipal utilities and industrial users. Innovation in low-residual and high-performance PAC grades supports broader adoption across wastewater treatment, industrial recycling, and desalination applications. Asia-Pacific leads the global market with an exact 38% share, driven by rapid urbanization, expanding industrial activity, and significant government investment in water purification infrastructure.
Market Insights
- The Poly Aluminium Chloride (PAC) Market reached USD 1834.85 million in 2024 and is projected to hit USD 2731.63 million by 2032 at a 1% CAGR, reflecting steady expansion across municipal and industrial treatment applications.
- Growing demand for efficient coagulation solutions in drinking water purification and industrial effluent treatment drives strong adoption, supported by increasing use of high-basicity PAC grades that enhance performance while reducing chemical consumption.
- Product innovation accelerates as manufacturers focus on low-residual, high-purity formulations and expand automated production capabilities to improve consistency and meet stricter environmental regulations.
- Supply-side constraints related to raw material pricing, logistics fluctuations, and compliance requirements pose key restraints, influencing procurement strategies and reinforcing the need for stable production networks.
- Asia-Pacific leads the market with 38% regional share, while the solid form segment dominates with a significant share due to operational efficiency and wider applicability; rising investments in water infrastructure across emerging economies further strengthen long-term growth opportunities.
 Market Segmentation Analysis:
By Form
Solid poly aluminium chloride holds the dominant share in the market due to its high active content, lower transportation cost, and longer shelf life, making it preferable for large-scale industrial and municipal applications. Its ease of storage and efficient dosing capabilities support strong adoption in regions with decentralized water treatment infrastructure. Solid PAC also enables consistent performance across varying raw water conditions, strengthening its position over liquid variants. Growing usage in rural water purification projects and packaged wastewater systems further reinforces the leadership of solid PAC across global applications.
- For instance, poly-aluminium chloride (PAC) powder grades typically offer aluminium oxide (Al₂O₃) content in the range of 28–31% in solid form, while liquid PACs are often limited to around 10–18% Al₂O₃.
By Basicity
High-basicity PAC leads the market, supported by its superior charge neutralization efficiency, lower sludge generation, and strong performance in treating highly turbid water. Its ability to deliver faster coagulation and improved floc formation makes it the preferred option for municipal water treatment authorities and industries requiring stringent output quality. High-basicity grades also reduce overall chemical consumption, aligning with cost-optimization goals in large-volume operations. Strong regulatory emphasis on treated-water clarity and the rising need for advanced coagulation solutions further strengthen the dominance of high-basicity PAC across end-use sectors.
- For instance, AutoHaul™ system, on 10 July 2018 Rio Tinto’s autonomous train network delivered about 28,000 tonnes of iron ore over a haul of around 280 km from its Tom Price mine to the port at Cape Lamber the first delivery by a heavy-haul, long-distance autonomous train in the world.
By End User
Water treatment remains the leading end-user segment, driven by its extensive use in municipal drinking water purification, industrial effluent treatment, and wastewater recycling systems. PAC’s effectiveness in removing suspended solids, organic matter, and pathogens ensures consistent adoption in both urban utilities and industrial clusters. Increasing global stress on freshwater resources accelerates investments in advanced treatment technologies, strengthening the reliance on PAC. Rising compliance with environmental discharge norms and the expansion of desalination pre-treatment operations further support the dominance of the water treatment segment over pulp and paper, textiles, oil and gas, and others.
Key Growth Drivers
1. Rising Investments in Municipal Water Treatment Infrastructure
Growing investments in municipal drinking water and wastewater treatment systems significantly drive PAC adoption. Governments prioritize modern coagulation technologies to meet stricter water quality regulations, pushing utilities to use PAC for its high turbidity removal efficiency and low sludge generation. Expanding urban populations increase demand for safe and treated water, accelerating upgrades in treatment plants and distribution networks. PAC’s superior performance across variable pH conditions and its cost-effectiveness in large-scale operations further reinforce its role as a preferred coagulant in advanced municipal water purification systems.
- For instance, GALDERMA’s Restylane® Lyft utilizes Non-Animal Stabilized Hyaluronic Acid cross-linking technology. The product is known for having a large particle size, typically specified in the range of approximately 750–1000 microns.
2. Expanding Industrial Effluent Treatment Requirements
Industries such as chemicals, food processing, textiles, and oil & gas increasingly depend on PAC to meet tightening discharge norms and sustainability goals. Its strong coagulation efficiency, compatibility with diverse effluent streams, and ability to reduce chemical oxygen demand enhance its use in industrial wastewater treatment. The growth of manufacturing hubs in Asia and the Middle East amplifies the need for reliable water recycling and zero-liquid-discharge systems. PAC’s ability to minimize residual aluminum levels and improve sludge dewatering efficiency strengthens its position across high-output industrial treatment systems.
- For instance, LG Chem Ltd. product is manufactured by LG Chem Ltd. It is a clear, colorless, and viscous gel containing BDDE (1,4-butanediol diglycidyl ether)-cross-linked sodium hyaluronate. Each pre-filled syringe contains 60 mg of the active ingredient in a 3.0 mL volume (20 mg/mL concentration).
3. Rising Preference for Cost-Efficient and High-Performance Coagulants
PAC continues to gain traction as industries seek coagulants that lower overall treatment costs while delivering consistent performance. Its higher basicity options offer faster coagulation, reduced chemical usage, and minimized downstream treatment requirements, improving operational efficiency for large facilities. The shift toward sustainable treatment chemicals supports PAC adoption due to its lower sludge volume compared to traditional alum. Increased awareness of lifecycle cost savings and regulatory pressure to adopt efficient coagulation systems further drives market penetration across both municipal and industrial applications.
Key Trends & Opportunities
1. Growing Adoption of High-Basicity and Specialty PAC Grades
Demand for high-basicity and specialty-formulated PAC grades continues to rise as users seek improved turbidity removal, optimized floc formation, and lower chemical consumption. Industries increasingly prefer customized PAC variants designed for specific contaminants, such as high-organic-content effluents or challenging industrial wastewater streams. This trend creates opportunities for manufacturers to expand product portfolios with high-purity, rapid-settling, and low-residual-aluminum formulations. The shift toward advanced treatment chemicals supports ongoing R&D investments and enhances the market appeal of premium PAC variants across emerging economies.
- For instance, Hyacyst® is a medical device containing a sterile solution of sodium hyaluronate. Hyacyst® (sodium hyaluronate), which is offered in pre-filled syringes of 40 mg in 50 mL and 120 mg in 50 mL.
2. Expansion of PAC Use in Desalination and Recycling Systems
As desalination projects expand globally, PAC is increasingly integrated into pre-treatment stages to remove suspended solids and improve membrane lifespan. Its compatibility with reverse osmosis systems and ability to prevent fouling positions it as a preferred coagulant in large-scale seawater purification plants. The global push for circular water use also promotes PAC adoption in wastewater recycling and industrial water recovery projects. These applications create new revenue opportunities for PAC suppliers, particularly in water-stressed regions across the Middle East, Africa, and Asia-Pacific.
- For instance, Ferring B.V.’s product EUFLEXXA® is formulated at 1% sodium hyaluronate (i.e., 10 mg per mL) for intra-articular knee injection.The material’s ability to reduce friction and promote tissue healing enhances treatment outcomes.
3. Technological Advancements in Production and Formulation
Improvements in PAC production technologies, such as optimized polymerization control and enhanced aluminum hydroxide purity, support the development of more efficient and environmentally friendly products. Manufacturers increasingly invest in automated process control systems to produce consistent, high-performance PAC grades suitable for demanding applications. Innovations in packaging, solid briquette formats, and low-dust powders further expand applicability in decentralized operations. These advancements open opportunities for differentiation, enabling suppliers to meet specialized sector needs and strengthen competitiveness in global markets.
Key Challenges
1. Volatility in Raw Material Availability and Pricing
Fluctuations in the availability and cost of key raw materials, particularly aluminum hydroxide and hydrochloric acid, create significant challenges for PAC manufacturers. Price instability disrupts production planning and affects profit margins, especially for suppliers operating on long-term municipal contracts. Global supply chain disruptions, energy cost fluctuations, and regional production imbalances further intensify pricing uncertainty. These factors compel manufacturers to adopt strategic sourcing and inventory management practices, yet volatility remains a major barrier to maintaining consistent and competitive pricing in the PAC market.
2. Competition from Alternative Coagulants and Treatment Technologies
The PAC market faces pressure from alternative coagulants such as polyferric sulfate, ferric chloride, and advanced organic coagulants used in specific niche applications. Emerging treatment technologies like membrane filtration, electrocoagulation, and advanced oxidation also challenge conventional coagulant usage in certain industries. While PAC maintains strong performance across diverse applications, the shift toward chemical-free or low-chemical treatment routes in some regions may limit its adoption. This competitive environment requires manufacturers to innovate and highlight PAC’s long-term performance and cost advantages to retain market share.
Regional Analysis
North America
North America holds an estimated 32% share of the global PAC market, driven by strong municipal water treatment mandates, advanced industrial effluent treatment systems, and heightened regulatory pressure on water quality. The region benefits from established treatment infrastructure and rapid adoption of high-basicity PAC in utilities seeking operational efficiency and compliance with drinking water standards. Growing investments in wastewater recycling, stormwater management upgrades, and industrial reuse programs further support demand. PAC usage continues to expand across sectors such as food processing, chemicals, and oil & gas, reinforcing the region’s strong market position.
Europe
Europe accounts for approximately 28% of the PAC market, supported by stringent EU water quality regulations and widespread implementation of advanced coagulation technologies in municipal and industrial treatment facilities. Countries such as Germany, the U.K., and France prioritize environmentally compliant coagulants, accelerating adoption of high-purity PAC grades with reduced residual aluminum content. Growing demand for sustainable treatment chemicals and increased investments in sludge reduction technologies support ongoing market growth. The region also sees rising PAC consumption in pulp and paper, textiles, and industrial wastewater recycling, strengthening Europe’s competitive presence in the global market.
Asia-Pacific
Asia-Pacific dominates the global PAC market with an estimated 38% share, driven by rapid urbanization, expanding industrial sectors, and major government-led investments in water purification infrastructure. China and India remain high-consumption markets due to large municipal treatment capacities and significant industrial wastewater volumes. The growth of manufacturing hubs, rising environmental compliance requirements, and the expansion of desalination projects in coastal regions fuel PAC uptake. Increasing preference for cost-effective and high-basicity PAC formulations supports market penetration across diverse industries, making Asia-Pacific the most influential regional contributor to global PAC demand.
Latin America
Latin America holds roughly 7% of the PAC market, supported by expanding water treatment projects and growing industrial activity in sectors such as mining, food processing, and textiles. Countries including Brazil, Mexico, and Chile increasingly invest in modernizing outdated treatment facilities to meet stricter water discharge standards. PAC adoption gains further traction as municipalities prioritize cost-efficient coagulants capable of improving turbidity removal in variable raw water conditions. Rising awareness of water scarcity and broader adoption of wastewater recycling technologies contribute to gradual market growth across the region.
Middle East & Africa
The Middle East & Africa region represents about 5% of the global PAC market, driven by rising desalination capacity, expanding industrial wastewater treatment needs, and increased investment in municipal water infrastructure. Gulf countries rely heavily on PAC for pre-treatment in large-scale reverse osmosis plants, where its efficiency in reducing suspended solids enhances membrane performance. In Africa, growing urban populations and development-led infrastructure upgrades support broader PAC adoption. While market penetration remains lower than other regions, accelerating water treatment initiatives and industrial growth create strong long-term opportunities.
Market Segmentations:
By Form:
- Solid
- Liquid
By Basicity:
- Low
- Medium
By End User:
- Water treatment
- Pulp and paper
By Geography
- North America
- U.S.
- Canada
- Mexico
- Europe
- Germany
- France
- U.K.
- Italy
- Spain
- Rest of Europe
- Asia Pacific
- China
- Japan
- India
- South Korea
- South-east Asia
- Rest of Asia Pacific
- Latin America
- Brazil
- Argentina
- Rest of Latin America
- Middle East & Africa
- GCC Countries
- South Africa
- Rest of the Middle East and Africa
Competitive Landscape
The Poly Aluminium Chloride (PAC) market players such as Südwestdeutsche Salzwerke AG, Cargill, Incorporated, Swiss Salt Works AG, Rio Tinto, Compass Minerals, Kishida Chemical Co., Ltd., Nouryon, Maldon Crystal Salt Company Ltd, K+S Aktiengesellschaft, and INEOS. The Poly Aluminium Chloride (PAC) market operates within a competitive environment shaped by manufacturers focused on high-performance formulations, efficient production processes, and broader application versatility. Companies compete by optimizing PAC grades with higher basicity, improved turbidity removal efficiency, and reduced sludge generation to meet stricter municipal and industrial water treatment requirements. Advancements in polymerization control, raw material quality, and automated process monitoring support consistent output, giving producers an edge in large-scale supply contracts. Market participants also prioritize capacity expansions in fast-growing regions, strengthened logistical capabilities, and technical support services for industrial and municipal clients. Rising adoption of PAC in desalination pre-treatment, industrial recycling, and specialized effluent streams further intensifies innovation. Sustainability-focused initiatives, including energy-efficient production and low-residual formulations, shape long-term differentiation as regulatory pressures increase. Overall, competition remains driven by product reliability, operational cost efficiency, and the ability to deliver tailored solutions across diverse end-use sectors.
Key Player Analysis
- Südwestdeutsche Salzwerke AG
- Cargill, Incorporated
- Swiss Salt Works AG
- Rio Tinto
- Compass Minerals
- Kishida Chemical Co., Ltd.
- Nouryon
- Maldon Crystal Salt Company Ltd
- K+S Aktiengesellschaft
- INEOS
Recent Developments
- In December 2024, Goyal Salt Limited, leading FMCG player which specializes in salt, is investing 80 crore to set up a large salt manufacturing plant in Gandhidham near salt, aimed at enhancing its production capacity and market reach.
- In September 2024, QatarEnergy announced a joint venture with Mesaieed Petrochemical Holding Company (MPHC), Qatar Industrial Manufacturing Company (QIMC), and Turkey's Atlas Yatirim Planlama to develop the new industrial salt production plant.
- In May 2024, Fast&Up launched Fast&Up Reload Ready-to-Drink (RTD) to expand beyond its popular effervescent tablets, targeting a broader market with convenient, low-sugar, electrolyte-rich hydration for active lifestyles, featuring essential electrolytes (Sodium, Potassium, Calcium, Magnesium, Chloride) and vitamins (B12, C) for fast rehydration, energy, and cramp prevention, aiming to compete in the growing hydration market.
- In February 2024, USALCO, LLC finished expanding its Chattanooga, TN plant to boost Polyaluminum Chloride (PAC) production, increasing supply for water treatment in the Southeastern U.S.. PAC is a key coagulant used to clump impurities in drinking water, and this expansion helps meet growing demand in the region for cleaner water.
Report Coverage
The research report offers an in-depth analysis based on Form, Basicity, End-User and Geography. It details leading market players, providing an overview of their business, product offerings, investments, revenue streams, and key applications. Additionally, the report includes insights into the competitive environment, SWOT analysis, current market trends, as well as the primary drivers and constraints. Furthermore, it discusses various factors that have driven market expansion in recent years. The report also explores market dynamics, regulatory scenarios, and technological advancements that are shaping the industry. It assesses the impact of external factors and global economic changes on market growth. Lastly, it provides strategic recommendations for new entrants and established companies to navigate the complexities of the market.
Future Outlook
- The market expects stronger demand as governments intensify investment in municipal drinking water and wastewater treatment infrastructure.
- High-basicity PAC formulations will gain wider adoption due to their improved coagulation efficiency and reduced sludge generation.
- Industrial sectors will expand PAC use to meet tighter environmental discharge norms and rising sustainability requirements.
- Desalination facilities will increasingly integrate PAC into pre-treatment systems to enhance membrane performance and operational stability.
- Manufacturers will invest more in energy-efficient production technologies and automated process monitoring for consistent product quality.
- Adoption of specialty PAC grades will grow across textile, pulp and paper, and chemical industries requiring tailored treatment solutions.
- Rapid industrialization in Asia and Africa will create strong long-term opportunities for high-volume PAC suppliers.
- Water-scarce regions will prioritize PAC in recycling and reuse systems to support circular water strategies.
- Supply chain optimization and raw material management will become crucial differentiators for competitive positioning.
- Sustainability-focused initiatives will drive innovation in low-residual and environmentally compliant PAC formulations.
Request a Free Sample
Fill in your details and we'll send you a free sample report.
- Sample data tables & charts
- Research methodology
Need a Custom Version of This Report?
Tailor the scope, geography, or segments to your exact requirements.
- Custom geography or segment scope
- Direct access to our analyst team
Frequently Asked Questions
What is the current market size for the Poly Aluminium Chloride (PAC) Market, and what is its projected size in 2032?
At what Compound Annual Growth Rate is the Poly Aluminium Chloride (PAC) Market projected to grow between 2025 and 2032?
Which Poly Aluminium Chloride (PAC) Market segment held the largest share in 2024?
What are the primary factors fueling the growth of the Poly Aluminium Chloride (PAC) Market?
Who are the leading companies in the Poly Aluminium Chloride (PAC) Market?
Which region commanded the largest share of the Poly Aluminium Chloride (PAC) Market in 2024?
Table of Content
Chapter 1. Report Introduction
- 1.1 Report Description & Purpose
- 1.1.1 Report Title & Market Definition
- 1.1.2 Unique Selling Propositions (USP) & Key Differentiators
- 1.1.3 Value Proposition for Stakeholders
- 1.2 Research Objectives
- 1.2.1 Market Sizing Objectives (Volume & Revenue)
- 1.2.2 Segmentation Objectives
- 1.2.3 Competitive Intelligence Objectives
- 1.2.4 Forecast & Scenario Objectives
- 1.3 Report Scope
- 1.3.1 Poly Aluminium Chloride (PAC) Scope – Types & Subtypes Covered
- 1.3.2 Geographic Scope – Regions & Countries Covered
- 1.3.3 Historical Period, Base Year & Forecast Period (2024; forecast to 2032)
- 1.3.4 Inclusions & Exclusions
- 1.4 HS Code & Classification Framework
- 1.5 Currency, Units & Pricing Basis
- 1.6 Target Stakeholders
- 1.7 Limitations & Assumptions
Chapter 2. Executive Summary
- 2.1 Global Poly Aluminium Chloride (PAC) Market Snapshot
- 2.1.1 Market Size – Historical (2024) & Forecast (2024-2032) (2024: USD 1834.85 million → 2032: USD 2731.63 million)
- 2.1.2 Volume & Revenue – Global Totals
- 2.1.3 Key Market Highlights – Top Five Facts
- 2.2 Poly Aluminium Chloride (PAC) Market Segmentation Snapshot
- 2.2.1 Market Split by Region – 2024 vs. 2032
- 2.3 Competitive Snapshot
- 2.3.1 Top 10 Players by Revenue Share – 2024
- 2.3.2 Top 10 Players by Volume Share – 2024
- 2.3.3 Recent Strategic Developments (18-Month Summary)
- 2.4 Key Investment Highlights & Strategic Conclusions
Chapter 3. Poly Aluminium Chloride (PAC) Market Dynamics & Industry Analysis
- 3.1 Market Overview & Context
- 3.1.1 Poly Aluminium Chloride (PAC) Market Position in the Broader Automotive Value Chain
- 3.1.2 OEM vs. Replacement Market Dynamics
- 3.1.3 Market Maturity & Development Stage by Region
- 3.2 Poly Aluminium Chloride (PAC) Market Drivers
- 3.3 Poly Aluminium Chloride (PAC) Market Restraints & Challenges
- 3.4 Poly Aluminium Chloride (PAC) Market Opportunities
- 3.5 Porter's Five Forces Analysis
- 3.5.1 Threat of New Entrants
- 3.5.2 Bargaining Power of Suppliers
- 3.5.3 Bargaining Power of Buyers
- 3.5.4 Threat of Substitutes
- 3.5.5 Competitive Rivalry – Intensity Assessment
- 3.6 Poly Aluminium Chloride (PAC) Value Chain Analysis
- 3.6.1 Upstream – Raw Material/Input Suppliers
- 3.6.1.1 Raw Material/Input 1
- 3.6.1.2 Raw Material/Input 2
- 3.6.1.3 Raw Material/Input 3
- 3.6.2 Midstream – Production/Manufacturing/Service Delivery
- 3.6.2.1 Production/Process Overview
- 3.6.2.2 Key Facility Locations & Capacity by Manufacturer
- 3.6.3 Downstream – Distribution & End Consumer
- 3.6.3.1 Primary Channel – B2B/OEM
- 3.6.3.2 Secondary Channels – Dealer, Retail, Online, Direct
- 3.6.4 Value Chain Profitability Analysis
- 3.6.1 Upstream – Raw Material/Input Suppliers
- 3.7 PESTEL Analysis
- 3.7.1 Political Factors
- 3.7.2 Economic Factors
- 3.7.3 Social Factors
- 3.7.4 Technological Factors
- 3.7.5 Environmental Factors
- 3.7.6 Legal Factors
- 3.8 Poly Aluminium Chloride (PAC) Supply Chain Analysis
- 3.8.1 Raw Material/Input Supply Risk Assessment
- 3.8.2 Manufacturing Concentration Risk (Geographic Exposure)
- 3.8.3 Trade Disruption Impact Analysis
- 3.9 Regulatory & Policy Landscape
Note: The regulatory and policy landscape section covers regulations based on their applicability to the market, Poly Aluminium Chloride (PAC) category, geography, and scope of the study. Only regulatory frameworks with a material impact on operations, compliance, trade, sustainability, or market access are analyzed in detail.
Chapter 4. Key Investment Pockets & Opportunity Analysis
- 4.1 Poly Aluminium Chloride (PAC) Market Attractiveness Analysis
- 4.1.1 By Region – Investment Attractiveness Matrix (Volume × CAGR)
- 4.2 Absolute Revenue Growth Opportunity
- 4.2.1 By Region – Absolute USD Growth Through 2032
- 4.3 Incremental Volume Opportunity
- 4.3.1 By Region – Incremental Volume Through 2032
- 4.3.2 Segment – Incremental Volume
- 4.4 Emerging Submarket Opportunity Deep Dive (Subject to Applicability)
- 4.5 Emerging Market Opportunity Scorecards
- 4.5.1 United States
- 4.5.2 Europe
- 4.5.3 Asia
- 4.5.4 Middle East & Africa
Note: Emerging Market Opportunity Scorecards will be included based on relevance and strategic importance. Regions listed are indicative and may vary depending on data availability and market dynamics.
Chapter 5. Poly Aluminium Chloride (PAC) Import-Export Analysis & Trade Flows
- 5.1 Global Trade Overview
- 5.1.1 Global Export Value by Country (2024)
- 5.1.2 Global Export Volume by Country (2024)
- 5.1.3 Global Import Value by Country (2024)
- 5.1.4 Global Import Volume by Country (2024)
- 5.1.5 Net Trade Balance by Country (2024)
- 5.2 Export Analysis – Segment
- 5.2.1 Type 1 (HS Code)
- 5.2.2 Type 2 (HS Code)
- 5.2.3 Type 3 (HS Code)
- 5.2.4 Type 4 (HS Code)
- 5.2.5 Type 5 (HS Code)
- 5.3 Import Analysis – Segment
- 5.3.1 Type 1 (HS Code)
- 5.3.2 Type 2 (HS Code)
- 5.3.3 Type 3 (HS Code)
- 5.3.4 Type 4 (HS Code)
- 5.3.5 Type 5 (HS Code)
- 5.4 Average Unit Trade Prices
- 5.4.1 Average Export Price – Segment & Country
- 5.4.2 Average Import Price – Segment & Source Country
- 5.4.3 Price Trends (2024)
- 5.5 Key Trade Route Analysis
- 5.5.1 Trade Route 1
- 5.5.2 Trade Route 2
- 5.5.3 Trade Route 3
- 5.5.4 Trade Route 4
- 5.5.5 Trade Route 5
- 5.6 Trade Policy Impact Assessment
- 5.6.1 US Anti-Dumping & Section 301 Tariffs
- 5.6.2 EU Customs Union Impact
- 5.6.3 Major Free Trade Agreements
- 5.6.4 USMCA Rules of Origin
Note: Trade policy analysis will be included only where relevant to the Poly Aluminium Chloride (PAC) market.
Chapter 6. Competitive Landscape & Company Benchmarking
- 6.1 Poly Aluminium Chloride (PAC) Market Concentration & Structure
- 6.1.1 Herfindahl-Hirschman Index (HHI) – vs. 2024
- 6.1.2 Tier 1, Tier 2 & Tier 3 Market Structure
- 6.1.3 Global, Regional & Local Player Dynamics
- 6.2 Poly Aluminium Chloride (PAC) Market Share Analysis – 2024
- 6.2.1 Global Revenue Share by Company
- 6.2.2 Global Volume Share by Company
- 6.2.3 Regional Revenue Share
- 6.2.4 Market Share Evolution ( vs. 2024)
- 6.2.5 OEM Segment Share by Company
- 6.2.6 Replacement Segment Share by Company
- 6.3 Production/Delivery Capacity & Facility Analysis
- 6.3.1 Global Installed Capacity
- 6.3.2 Capacity Utilization Rates
- 6.3.3 Production/Output Volume
- 6.3.4 Facility Locations & Capacity Map
- 6.3.5 Planned Capacity Additions
- 6.4 Poly Aluminium Chloride (PAC) Competitive Benchmarking Matrix
- 6.4.1 Revenue, Volume, CAGR & Profitability Comparison
- 6.4.2 Channel Revenue Mix
- 6.4.3 Geographic Revenue Exposure
- 6.4.4 R&D Intensity
- 6.4.5 Sustainability Maturity
- 6.5 Strategic Developments in Poly Aluminium Chloride (PAC) (Last 24 Months)
- 6.5.1 Mergers, Acquisitions & Divestments
- 6.5.2 New Poly Aluminium Chloride (PAC) Launches
- 6.5.3 Facility Expansions
- 6.5.4 Strategic Alliances, Joint Ventures & Partnerships
- 6.5.5 Distribution Expansion & Market Entry
- 6.5.6 Sustainability & ESG Initiatives
- 6.6 Competitive Strategy Mapping
- 6.6.1 Leader, Challenger, Follower & Niche Classification
- 6.6.2 Pricing Strategy Comparison
- 6.6.3 Channel Strategy Matrix
Note: Strategic developments are included based on their materiality and the availability of reliable information.
Chapter 7. Global Poly Aluminium Chloride (PAC) Market – By Distribution Channel
- 7.1 Segment Overview
- 7.1.1 Volume & Revenue Split by Channel (2024 & 2032)
- 7.1.2 Channel Mix Evolution (2024-2032)
Chapter 8. Regional Market Analysis – Global Overview
- 8.1 Global Regional Overview
- 8.1.1 Regional Volume Share
- 8.1.2 Regional Revenue Share
- 8.1.3 Regional Volume by Region
- 8.1.4 Regional Revenue by Region
- 8.1.5 Regional Forecast Through 2032
- 8.2 Cross-Regional Segment Analysis
- 8.2.1 By Distribution Channel
- 8.2.2 By Brand/Price Tier
Chapter 9. North America Poly Aluminium Chloride (PAC) Market
- 9.1 United States
- 9.2 Canada
- 9.3 Mexico
Chapter 10. Europe Poly Aluminium Chloride (PAC) Market
- 10.1 Germany
- 10.2 France
- 10.3 Italy
- 10.4 United Kingdom
- 10.5 Spain
- 10.6 Poland
- 10.7 Russia
- 10.8 Netherlands
- 10.9 Belgium
- 10.10 Sweden
- 10.11 Denmark
- 10.12 Norway
- 10.13 Rest of Europe
Chapter 11. Asia Pacific Poly Aluminium Chloride (PAC) Market
- 11.1 China
- 11.2 India
- 11.3 Japan
- 11.4 South Korea
- 11.5 Thailand
- 11.6 Indonesia
- 11.7 Vietnam
- 11.8 Malaysia
- 11.9 Australia
- 11.10 Rest of Asia Pacific
Chapter 12. Latin America Poly Aluminium Chloride (PAC) Market
- 12.1 Brazil
- 12.2 Argentina
- 12.3 Colombia
- 12.4 Chile
- 12.5 Rest of Latin America
Chapter 13. Middle East Poly Aluminium Chloride (PAC) Market
- 13.1 Saudi Arabia
- 13.2 United Arab Emirates
- 13.3 Turkey
- 13.4 Israel
- 13.5 Iran
- 13.6 Rest of the Middle East
Chapter 14. Africa Poly Aluminium Chloride (PAC) Market
- 14.1 South Africa
- 14.2 Egypt
- 14.3 Nigeria
- 14.4 Morocco
- 14.5 Rest of Africa
Chapter 15. Poly Aluminium Chloride (PAC) Company Profiles
- 15.1 [Company 01]
- 15.1.1 Company Overview
- 15.1.2 Key Management Personnel
- 15.1.3 Products & Services Portfolio
- 15.1.4 Financial Performance
- 15.1.5 Key Market Focus & Geographic Presence
- 15.1.6 Recent Developments & Strategic Initiatives
Note: The company profile list is preliminary and may change based on research findings, market developments, data availability, and client requirements.
Chapter 16. Appendices
- Appendix A – List of Abbreviations & Acronyms
- Appendix B – Industry Classification Code Reference – Full Series
- Appendix C – Production & Capacity Data Tables
- Appendix D – End-Use & Demand Base Tables
- Appendix E – Consumption & Replacement Rate Assumptions
- Appendix F – ASP Reference Tables
- Appendix G – Manufacturing & Facility Database
- Appendix H – Import-Export Data Tables
- Appendix I – Regulatory Summary Tables
- Appendix J – Primary Research Participant List (Anonymized)
- Appendix K – Primary Research Questionnaire Framework
- Appendix L – Data Sources & Bibliography
- Appendix M – Market Size Divergence & Source Comparison
Chapter 17. Research Methodology
- 17.1 Research Framework & Philosophy
- 17.2 Secondary Research – Sources, Hierarchy & Data Extraction
- 17.3 Data Modeling – Bottom-Up & Top-Down Market Sizing
- 17.4 Primary Research – Stakeholder Framework, LOI & Sample Sizes
- 17.5 Forecast Methodology – Regression, Scenario & Sensitivity Analysis
- 17.6 Quality Control – Four-Layer Validation Framework
- 17.7 Limitations & Standard Assumptions
- 17.8 Disclaimer
