
| REPORT ATTRIBUTE | DETAILS |
|---|---|
| Historical Period | 2019-2022 |
| Base Year | 2023 |
| Forecast Period | 2024-2032 |
| Positive Air Pressure Devices Market Size 2024 | USD 2515 million |
| Positive Air Pressure Devices Market, CAGR | 6.9% |
| Positive Air Pressure Devices Market Size 2032 | USD 4289.03 million |
Market Overview:
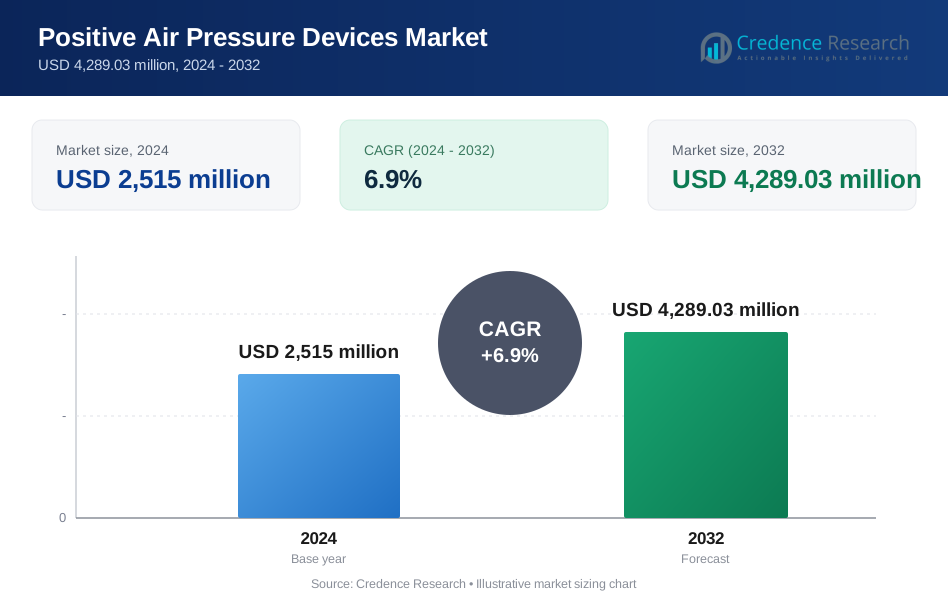
The Positive Air Pressure Devices Market is projected to grow from USD 2515 million in 2024 to an estimated USD 4289.03 million by 2032, with a compound annual growth rate (CAGR) of 6.9% from 2024 to 2032.
Several factors are contributing to the growth of the Positive Air Pressure Devices Market. Key drivers include an aging global population, which increases the incidence of respiratory diseases, and the rise in lifestyle-related health conditions. Additionally, the integration of innovative features such as wireless connectivity, portability, and enhanced comfort in modern positive air pressure devices has attracted a larger consumer base. The shift towards home healthcare, particularly in emerging economies, is also fueling market demand. Healthcare providers and patients are increasingly opting for cost-effective, at-home treatment alternatives, leading to increased adoption of these devices.
Regionally, North America dominates the Positive Air Pressure Devices Market due to the high prevalence of respiratory diseases and advanced healthcare infrastructure. The U.S. is the largest contributor to market growth, driven by strong healthcare reimbursement policies and high awareness among patients. Europe follows closely, with countries like Germany, France, and the U.K. exhibiting substantial demand. The Asia-Pacific region is expected to witness the highest growth rate over the forecast period, owing to improving healthcare standards, a growing elderly population, and increased disposable income in countries like China and India. In contrast, the Asia-Pacific region is expected to experience the highest growth rate in the forecast period. Factors driving this growth include improving healthcare standards and increased disposable income in countries such as China and India. As these nations enhance their healthcare facilities and expand access to medical technologies, the adoption of positive air pressure devices is likely to accelerate. Overall, the Positive Air Pressure Devices Market is on an upward trajectory fueled by demographic shifts, technological innovations, and changing healthcare paradigms that prioritize patient-centric solutions. The ongoing evolution in this market underscores the need for manufacturers to adapt swiftly to consumer demands while ensuring that their products remain accessible and effective in treating respiratory conditions.
Market Drivers:
Rising Prevalence of Respiratory Disorders
The increasing incidence of respiratory conditions, particularly sleep apnea and chronic obstructive pulmonary disease (COPD), is a significant driver of the Positive Air Pressure Devices Market. For instance, studies have shown that sleep apnea affects approximately 936 million people worldwide. As the global population ages, the occurrence of these disorders has risen, increasing the need for therapeutic solutions. Positive air pressure devices are widely used for treating sleep apnea, a condition that affects millions of people globally, thereby boosting market demand.
Technological Advancements in Devices
Technological innovations are a major factor fueling the growth of the Positive Air Pressure Devices Market. Modern devices offer enhanced features such as wireless connectivity, better comfort, portability, and more precise pressure settings. For example, the latest CPAP (Continuous Positive Airway Pressure) machines come with integrated mobile apps that allow patients to track their sleep data in real-time. These advancements not only improve the effectiveness of treatment but also enhance patient satisfaction. Moreover, the integration of AI and data analytics for monitoring patient conditions remotely has further augmented the appeal of these devices.
Growth in Home Healthcare Solutions
The shift towards home healthcare solutions has significantly impacted the demand for positive air pressure devices. More patients are opting for home-based treatments, seeking cost-effective alternatives to hospital stays. For instance, a survey indicated that 68% of patients preferred receiving treatment at home rather than in a healthcare facility. This trend is particularly prominent in emerging markets, where there is an increasing emphasis on affordable, accessible healthcare options. Home healthcare services, combined with improved device usability, are propelling market growth.
Increasing Awareness and Patient Education
Rising awareness about respiratory conditions and available treatment options is another key factor contributing to the growth of the market. Educational initiatives, online resources, and healthcare campaigns are playing a pivotal role in informing the public about the benefits of positive air pressure therapy. For example, the American Sleep Apnea Association (ASAA) has been running a nationwide awareness campaign to educate people about the risks of untreated sleep apnea. This growing awareness has led to higher adoption rates among patients, further driving demand for these devices across global markets.
Market Trends:
Integration of Smart Technology
One of the prominent trends in the Positive Air Pressure Devices Market is the integration of smart technology. Many manufacturers are incorporating features such as Bluetooth connectivity, mobile app integration, and real-time data monitoring in their devices. For instance, the CirrusSense Wireless Bluetooth Pressure Transducer allows users to view data on their smartphones using a simple app, enabling real-time monitoring and data logging. These advancements allow healthcare providers and patients to track treatment progress, adjust settings, and monitor vital parameters remotely, improving overall management of respiratory conditions. The shift towards these smart, connected devices enhances the convenience and effectiveness of therapy.
Portable and Compact Device Designs
Another trend is the development of more portable and compact positive air pressure devices. As patients increasingly prefer home-based treatment, the demand for lightweight and easily transportable devices has surged. For example, the CONTEC R100 Positive Airway Pressure Device is a portable respiratory therapy device that is compact and easy to carry, making it convenient for patients who travel frequently. These devices are designed to be discreet, user-friendly, and convenient for patients who require constant therapy, including those who travel frequently. This trend aligns with the broader move toward patient-centered care and home healthcare solutions.
Customization and Comfort Features
Positive air pressure devices are becoming more customizable to meet individual patient needs, further driving market growth. Manufacturers are focusing on improving comfort by offering various mask designs, pressure settings, and noise reduction features. For instance, ResMed's AirSense 10 AutoSet uses artificial intelligence to monitor breathing and adjust pressure levels automatically. The ability to personalize therapy according to a patient's specific condition or lifestyle preferences enhances treatment adherence and patient satisfaction. This trend is particularly significant in the treatment of sleep apnea, where patient comfort is crucial for long-term compliance.
Focus on Non-Invasive Treatments
There is a growing focus on non-invasive treatment options, and positive air pressure devices are becoming the go-to solution for managing conditions like sleep apnea and other respiratory issues. For example, the American Academy of Sleep Medicine recommends positive airway pressure (PAP) therapy as the first-line treatment for obstructive sleep apnea (OSA).As healthcare systems emphasize reducing the need for invasive procedures and hospitalizations, the demand for effective, non-invasive therapies has increased. This shift is driving innovations in positive air pressure devices, making them a preferred choice for patients seeking comfortable, convenient, and minimally invasive treatment options.
Market Challenges Analysis:
High Initial Cost of Devices
One of the key challenges in the Positive Air Pressure Devices Market is the high initial cost of these devices. Although they provide long-term benefits, the upfront price of purchasing positive air pressure devices can be prohibitive for many patients, especially in emerging economies. This cost barrier may deter individuals from seeking treatment, particularly in markets where reimbursement policies are less favorable. The high price point can also limit market penetration in lower-income regions, hindering the growth potential of the market. Patient adherence to therapy remains a significant challenge in the Positive Air Pressure Devices Market. Many users face discomfort while using these devices, particularly during sleep apnea treatment, due to factors such as mask fit, air pressure settings, and noise levels. If patients find the devices uncomfortable, they may discontinue usage or fail to use them consistently, which can compromise the effectiveness of treatment. Ensuring better patient comfort and promoting long-term adherence remains a crucial issue for manufacturers and healthcare providers.
Regulatory and Reimbursement Challenges
The regulatory environment surrounding positive air pressure devices presents another challenge. These devices must meet stringent regulations in various regions, including the U.S. Food and Drug Administration (FDA) approvals and CE marking in Europe, which can result in long approval timelines and added costs for manufacturers. Additionally, inconsistent reimbursement policies across different countries may affect patient access to these devices, particularly in regions where insurance coverage is limited or unclear. This regulatory complexity and reimbursement inconsistency can impede market growth and hinder wider adoption. As the market shifts toward more advanced, smart, and connected devices, technological complexity has become a challenge. The need for regular maintenance, troubleshooting, and software updates can increase operational costs for both manufacturers and consumers. Moreover, patients who are not tech-savvy may struggle with device setup and operation, potentially leading to reduced usage and customer dissatisfaction. Addressing these issues will be essential for improving user experience and fostering market expansion.
Market Segmentation Analysis:
By Product
The Positive Air Pressure Devices Market is segmented into continuous positive air pressure (CPAP) devices, bilevel positive air pressure (BiPAP) devices, and adaptive servo-ventilation (ASV) devices. CPAP devices dominate the market due to their widespread use in treating obstructive sleep apnea. These devices deliver a continuous stream of air to keep the airways open. BiPAP devices, which provide two different pressure levels for inhalation and exhalation, are gaining traction due to their effectiveness in treating conditions like COPD. ASV devices are designed for more complex cases, such as central sleep apnea, and are expected to witness growth due to their advanced functionalities.
By Application
In terms of application, the market is primarily segmented into sleep apnea, chronic obstructive pulmonary disease (COPD), and others. Sleep apnea accounts for the largest share due to the growing prevalence of this condition and increased awareness of treatment options. COPD is the second-largest application, driven by the increasing global burden of the disease. Other applications include conditions like asthma, congestive heart failure, and pulmonary hypertension, which are expected to contribute to the market's growth.
By End User
The end-user segment includes hospitals, homecare settings, and sleep centers. Homecare settings hold the largest market share, driven by the shift toward home-based treatment solutions. The growing preference for convenient and cost-effective therapies is propelling the adoption of positive air pressure devices in households. Hospitals and sleep centers continue to be significant end-users, particularly for patients requiring intensive care and diagnosis.
Segmentations:
By Product
- Continuous Positive Air Pressure (CPAP) Devices
- Bilevel Positive Air Pressure (BiPAP) Devices
- Adaptive Servo-Ventilation (ASV) Devices
By Application
- Sleep Apnea
- Chronic Obstructive Pulmonary Disease (COPD)
- Others
By End User
- Hospitals
- Homecare Settings
- Sleep Centers
By Region
- North America
- U.S.
- Canada
- Mexico
- Europe
- Germany
- France
- U.K.
- Italy
- Spain
- Rest of Europe
- Asia Pacific
- China
- Japan
- India
- South Korea
- South-east Asia
- Rest of Asia Pacific
- Latin America
- Brazil
- Argentina
- Rest of Latin America
- Middle East & Africa
- GCC Countries
- South Africa
- Rest of the Middle East and Africa
Regional Analysis:
North America North America leads the Positive Air Pressure Devices Market, holding 40% of the global market share. This dominance is driven by a high prevalence of respiratory disorders like sleep apnea and COPD, along with an advanced healthcare infrastructure. The United States is a key contributor, supported by favorable reimbursement policies, strong patient awareness, and significant adoption of innovative technologies, such as smart devices. Additionally, the region’s emphasis on research and development further supports its market leadership.
Europe Europe holds a 30% share in the market, with countries such as Germany, the United Kingdom, and France playing pivotal roles. The rising incidence of sleep apnea and COPD, coupled with the region's advanced healthcare systems, high awareness, and comprehensive reimbursement mechanisms, boosts the demand for positive air pressure devices. The growing preference for home healthcare and non-invasive therapies, as well as portable devices, aligns with Europe’s patient-centric care trends. The strong presence of key manufacturers and widespread adoption of advanced technologies further strengthens Europe’s market position.
Asia-Pacific The Asia-Pacific region is experiencing rapid growth, with a market share of 20%. This growth is fueled by the increasing elderly population, rising disposable incomes, and improving healthcare standards in countries like China, India, and Japan. The growing prevalence of respiratory disorders, including sleep apnea, is driving demand for positive air pressure devices. The rise of home healthcare solutions and the adoption of more affordable devices also contribute to the region's market expansion. Improved healthcare infrastructure and technology adoption further accelerate market growth in Asia-Pacific.
Latin America Latin America holds a smaller share of 5%, but the market is gradually expanding. Increased awareness of respiratory conditions and improving access to healthcare services, particularly in Brazil and Mexico, are driving demand for positive air pressure devices. However, challenges like high device costs and limited reimbursement options continue to impede the market's growth potential. Despite these hurdles, the adoption of home-based therapies continues to rise in urban areas.
Middle East & Africa The Middle East & Africa accounts for 5% of the market share, driven by increased healthcare investments, growing awareness of respiratory diseases, and improved healthcare infrastructure in regions such as Saudi Arabia and the UAE. However, the market faces challenges like limited access to affordable healthcare and disparities in healthcare availability, which affect market penetration. Despite these obstacles, the region shows potential for growth as patient awareness and healthcare access continue to improve.
Key Player Analysis:
- Philips Respironics
- Fisher & Paykel Healthcare Ltd.
- Curative Medical Inc.
- ResMed
- Drive Devilbliss Healthcare Ltd.
- Medtronic, Inc.
- Servona GmbH
- Armstrong Medical
- Medical Depot Inc
- Smiths Group PLC
Competitive Analysis:
The Positive Air Pressure Devices Market is highly competitive, with several key players leading the industry through continuous innovation and strategic initiatives. Major companies such as ResMed, Philips Healthcare, and Fisher & Paykel Healthcare dominate the market, offering a range of CPAP, BiPAP, and ASV devices. These companies focus on technological advancements, such as the integration of smart devices, enhanced comfort features, and wireless connectivity to differentiate their offerings. Additionally, mergers, acquisitions, and partnerships are common strategies used by market leaders to expand their product portfolios and strengthen their market presence. For example, Philips Healthcare's DreamStation BiPAP devices offer advanced data storage and remote monitoring capabilities.Smaller players also contribute to market growth by offering cost-effective solutions and targeting niche segments, such as emerging economies. The competitive landscape is further shaped by regulatory standards and reimbursement policies that influence market access and pricing strategies. As patient-centric care and home healthcare solutions gain traction, companies are increasingly focusing on developing portable, user-friendly devices to stay competitive.
Recent Developments:
- In October 2023, Philips Respironics announced updates regarding their OmniLab Advanced + sleep lab devices, offering customers options for remediation or credits for affected devices as part of their ongoing response to a major recall initiated in June 2021 due to health risks associated with certain materials used in their devices.
- In January 2025, ResMed launched the AirSense 11 CPAP device in India, advanced features like a Personal Therapy Assistant and Care Check-In to enhance user experience and adherence to therapy for patients with obstructive sleep apnea (OSA).
Market Concentration & Characteristics:
The Positive Air Pressure Devices Market is moderately concentrated, with a few large players commanding the majority of the market share. Leading companies such as ResMed, Philips Healthcare, and Fisher & Paykel Healthcare dominate the market through their extensive product offerings, technological innovations, and strong brand presence. These companies focus on enhancing device performance with features like wireless connectivity, improved comfort, and portability, catering to the increasing demand for home healthcare solutions. Despite the dominance of major players, the market also includes smaller companies that provide cost-effective solutions and target specific regional or niche segments. The market is characterized by significant research and development investments, particularly in the areas of smart devices and non-invasive therapies. Competitive dynamics are shaped by ongoing product innovations, strategic partnerships, and a growing emphasis on patient-centric care, which drives companies to continually enhance the usability and functionality of their devices.
Report Coverage:
The research report offers an in-depth analysis based on By Product, By Application, By End User and By Region. It details leading market players, providing an overview of their business, product offerings, investments, revenue streams, and key applications. Additionally, the report includes insights into the competitive environment, SWOT analysis, current market trends, as well as the primary drivers and constraints. Furthermore, it discusses various factors that have driven market expansion in recent years. The report also explores market dynamics, regulatory scenarios, and technological advancements that are shaping the industry. It assesses the impact of external factors and global economic changes on market growth. Lastly, it provides strategic recommendations for new entrants and established companies to navigate the complexities of the market.
Future Outlook:
- The demand for positive air pressure devices is expected to increase due to the growing prevalence of respiratory disorders such as sleep apnea and COPD.
- Advancements in technology will drive innovation, leading to smarter, more connected devices with features like wireless monitoring and real-time data tracking.
- The shift towards home healthcare solutions will continue to propel market growth, as patients seek more convenient, cost-effective treatment options.
- The rising elderly population globally will contribute to a higher incidence of respiratory conditions, further boosting demand for these devices.
- Increased awareness and education about sleep apnea and other respiratory conditions will drive patient adoption of positive air pressure devices.
- The growing focus on non-invasive treatments will make positive air pressure devices the preferred option for managing respiratory disorders.
- Manufacturers will continue to focus on improving the comfort and portability of devices to enhance patient compliance and long-term usage.
- Emerging economies will experience significant market growth due to improving healthcare infrastructure, rising disposable incomes, and increased access to treatment options.
- The regulatory environment will evolve, with potential changes in reimbursement policies that could influence the adoption and pricing of devices.
- Competitive dynamics will intensify, with companies investing in research and development to create more efficient, user-friendly, and affordable solutions for patients.
Request a Free Sample
Fill in your details and we'll send you a free sample report.
- Sample data tables & charts
- Research methodology
Need a Custom Version of This Report?
Tailor the scope, geography, or segments to your exact requirements.
- Custom geography or segment scope
- Direct access to our analyst team
Frequently Asked Questions
What is the projected growth of the Positive Air Pressure Devices Market?
What factors are driving the growth of the Positive Air Pressure Devices Market?
Which regions are leading the Positive Air Pressure Devices Market?
Which countries are the largest contributors to the market's growth?
Table of Content
Chapter 1. Report Introduction
- 1.1 Report Description & Purpose
- 1.1.1 Report Title & Market Definition
- 1.1.2 Unique Selling Propositions (USP) & Key Differentiators
- 1.1.3 Value Proposition for Stakeholders
- 1.2 Research Objectives
- 1.2.1 Market Sizing Objectives (Volume & Revenue)
- 1.2.2 Segmentation Objectives
- 1.2.3 Competitive Intelligence Objectives
- 1.2.4 Forecast & Scenario Objectives
- 1.3 Report Scope
- 1.3.1 Positive Air Pressure Devices Scope – Types & Subtypes Covered
- 1.3.2 Geographic Scope – Regions & Countries Covered
- 1.3.3 Historical Period, Base Year & Forecast Period (2024; forecast to 2032)
- 1.3.4 Inclusions & Exclusions
- 1.4 HS Code & Classification Framework
- 1.5 Currency, Units & Pricing Basis
- 1.6 Target Stakeholders
- 1.7 Limitations & Assumptions
Chapter 2. Executive Summary
- 2.1 Global Positive Air Pressure Devices Market Snapshot
- 2.1.1 Market Size – Historical (2024) & Forecast (2024-2032) (2024: USD 2,515 million → 2032: USD 4,289.03 million)
- 2.1.2 Volume & Revenue – Global Totals
- 2.1.3 Key Market Highlights – Top Five Facts
- 2.2 Positive Air Pressure Devices Market Segmentation Snapshot
- 2.2.1 Market Split by Region – 2024 vs. 2032
- 2.3 Competitive Snapshot
- 2.3.1 Top 10 Players by Revenue Share – 2024
- 2.3.2 Top 10 Players by Volume Share – 2024
- 2.3.3 Recent Strategic Developments (18-Month Summary)
- 2.4 Key Investment Highlights & Strategic Conclusions
Chapter 3. Positive Air Pressure Devices Market Dynamics & Industry Analysis
- 3.1 Market Overview & Context
- 3.1.1 Positive Air Pressure Devices Market Position in the Broader Automotive Value Chain
- 3.1.2 OEM vs. Replacement Market Dynamics
- 3.1.3 Market Maturity & Development Stage by Region
- 3.2 Positive Air Pressure Devices Market Drivers
- 3.3 Positive Air Pressure Devices Market Restraints & Challenges
- 3.4 Positive Air Pressure Devices Market Opportunities
- 3.5 Porter's Five Forces Analysis
- 3.5.1 Threat of New Entrants
- 3.5.2 Bargaining Power of Suppliers
- 3.5.3 Bargaining Power of Buyers
- 3.5.4 Threat of Substitutes
- 3.5.5 Competitive Rivalry – Intensity Assessment
- 3.6 Positive Air Pressure Devices Value Chain Analysis
- 3.6.1 Upstream – Raw Material/Input Suppliers
- 3.6.1.1 Raw Material/Input 1
- 3.6.1.2 Raw Material/Input 2
- 3.6.1.3 Raw Material/Input 3
- 3.6.2 Midstream – Production/Manufacturing/Service Delivery
- 3.6.2.1 Production/Process Overview
- 3.6.2.2 Key Facility Locations & Capacity by Manufacturer
- 3.6.3 Downstream – Distribution & End Consumer
- 3.6.3.1 Primary Channel – B2B/OEM
- 3.6.3.2 Secondary Channels – Dealer, Retail, Online, Direct
- 3.6.4 Value Chain Profitability Analysis
- 3.6.1 Upstream – Raw Material/Input Suppliers
- 3.7 PESTEL Analysis
- 3.7.1 Political Factors
- 3.7.2 Economic Factors
- 3.7.3 Social Factors
- 3.7.4 Technological Factors
- 3.7.5 Environmental Factors
- 3.7.6 Legal Factors
- 3.8 Positive Air Pressure Devices Supply Chain Analysis
- 3.8.1 Raw Material/Input Supply Risk Assessment
- 3.8.2 Manufacturing Concentration Risk (Geographic Exposure)
- 3.8.3 Trade Disruption Impact Analysis
- 3.9 Regulatory & Policy Landscape
Note: The regulatory and policy landscape section covers regulations based on their applicability to the market, Positive Air Pressure Devices category, geography, and scope of the study. Only regulatory frameworks with a material impact on operations, compliance, trade, sustainability, or market access are analyzed in detail.
Chapter 4. Key Investment Pockets & Opportunity Analysis
- 4.1 Positive Air Pressure Devices Market Attractiveness Analysis
- 4.1.1 By Region – Investment Attractiveness Matrix (Volume × CAGR)
- 4.2 Absolute Revenue Growth Opportunity
- 4.2.1 By Region – Absolute USD Growth Through 2032
- 4.3 Incremental Volume Opportunity
- 4.3.1 By Region – Incremental Volume Through 2032
- 4.3.2 Segment – Incremental Volume
- 4.4 Emerging Submarket Opportunity Deep Dive (Subject to Applicability)
- 4.5 Emerging Market Opportunity Scorecards
- 4.5.1 United States
- 4.5.2 Europe
- 4.5.3 Asia
- 4.5.4 Middle East & Africa
Note: Emerging Market Opportunity Scorecards will be included based on relevance and strategic importance. Regions listed are indicative and may vary depending on data availability and market dynamics.
Chapter 5. Positive Air Pressure Devices Import-Export Analysis & Trade Flows
- 5.1 Global Trade Overview
- 5.1.1 Global Export Value by Country (2024)
- 5.1.2 Global Export Volume by Country (2024)
- 5.1.3 Global Import Value by Country (2024)
- 5.1.4 Global Import Volume by Country (2024)
- 5.1.5 Net Trade Balance by Country (2024)
- 5.2 Export Analysis – Segment
- 5.2.1 Type 1 (HS Code)
- 5.2.2 Type 2 (HS Code)
- 5.2.3 Type 3 (HS Code)
- 5.2.4 Type 4 (HS Code)
- 5.2.5 Type 5 (HS Code)
- 5.3 Import Analysis – Segment
- 5.3.1 Type 1 (HS Code)
- 5.3.2 Type 2 (HS Code)
- 5.3.3 Type 3 (HS Code)
- 5.3.4 Type 4 (HS Code)
- 5.3.5 Type 5 (HS Code)
- 5.4 Average Unit Trade Prices
- 5.4.1 Average Export Price – Segment & Country
- 5.4.2 Average Import Price – Segment & Source Country
- 5.4.3 Price Trends (2024)
- 5.5 Key Trade Route Analysis
- 5.5.1 Trade Route 1
- 5.5.2 Trade Route 2
- 5.5.3 Trade Route 3
- 5.5.4 Trade Route 4
- 5.5.5 Trade Route 5
- 5.6 Trade Policy Impact Assessment
- 5.6.1 US Anti-Dumping & Section 301 Tariffs
- 5.6.2 EU Customs Union Impact
- 5.6.3 Major Free Trade Agreements
- 5.6.4 USMCA Rules of Origin
Note: Trade policy analysis will be included only where relevant to the Positive Air Pressure Devices market.
Chapter 6. Competitive Landscape & Company Benchmarking
- 6.1 Positive Air Pressure Devices Market Concentration & Structure
- 6.1.1 Herfindahl-Hirschman Index (HHI) – vs. 2024
- 6.1.2 Tier 1, Tier 2 & Tier 3 Market Structure
- 6.1.3 Global, Regional & Local Player Dynamics
- 6.2 Positive Air Pressure Devices Market Share Analysis – 2024
- 6.2.1 Global Revenue Share by Company
- 6.2.2 Global Volume Share by Company
- 6.2.3 Regional Revenue Share
- 6.2.4 Market Share Evolution ( vs. 2024)
- 6.2.5 OEM Segment Share by Company
- 6.2.6 Replacement Segment Share by Company
- 6.3 Production/Delivery Capacity & Facility Analysis
- 6.3.1 Global Installed Capacity
- 6.3.2 Capacity Utilization Rates
- 6.3.3 Production/Output Volume
- 6.3.4 Facility Locations & Capacity Map
- 6.3.5 Planned Capacity Additions
- 6.4 Positive Air Pressure Devices Competitive Benchmarking Matrix
- 6.4.1 Revenue, Volume, CAGR & Profitability Comparison
- 6.4.2 Channel Revenue Mix
- 6.4.3 Geographic Revenue Exposure
- 6.4.4 R&D Intensity
- 6.4.5 Sustainability Maturity
- 6.5 Strategic Developments in Positive Air Pressure Devices (Last 24 Months)
- 6.5.1 Mergers, Acquisitions & Divestments
- 6.5.2 New Positive Air Pressure Devices Launches
- 6.5.3 Facility Expansions
- 6.5.4 Strategic Alliances, Joint Ventures & Partnerships
- 6.5.5 Distribution Expansion & Market Entry
- 6.5.6 Sustainability & ESG Initiatives
- 6.6 Competitive Strategy Mapping
- 6.6.1 Leader, Challenger, Follower & Niche Classification
- 6.6.2 Pricing Strategy Comparison
- 6.6.3 Channel Strategy Matrix
Note: Strategic developments are included based on their materiality and the availability of reliable information.
Chapter 7. Global Positive Air Pressure Devices Market – By Distribution Channel
- 7.1 Segment Overview
- 7.1.1 Volume & Revenue Split by Channel (2024 & 2032)
- 7.1.2 Channel Mix Evolution (2024-2032)
Chapter 8. Regional Market Analysis – Global Overview
- 8.1 Global Regional Overview
- 8.1.1 Regional Volume Share
- 8.1.2 Regional Revenue Share
- 8.1.3 Regional Volume by Region
- 8.1.4 Regional Revenue by Region
- 8.1.5 Regional Forecast Through 2032
- 8.2 Cross-Regional Segment Analysis
- 8.2.1 By Distribution Channel
- 8.2.2 By Brand/Price Tier
Chapter 9. North America Positive Air Pressure Devices Market
- 9.1 United States
- 9.2 Canada
- 9.3 Mexico
Chapter 10. Europe Positive Air Pressure Devices Market
- 10.1 Germany
- 10.2 France
- 10.3 Italy
- 10.4 United Kingdom
- 10.5 Spain
- 10.6 Poland
- 10.7 Russia
- 10.8 Netherlands
- 10.9 Belgium
- 10.10 Sweden
- 10.11 Denmark
- 10.12 Norway
- 10.13 Rest of Europe
Chapter 11. Asia Pacific Positive Air Pressure Devices Market
- 11.1 China
- 11.2 India
- 11.3 Japan
- 11.4 South Korea
- 11.5 Thailand
- 11.6 Indonesia
- 11.7 Vietnam
- 11.8 Malaysia
- 11.9 Australia
- 11.10 Rest of Asia Pacific
Chapter 12. Latin America Positive Air Pressure Devices Market
- 12.1 Brazil
- 12.2 Argentina
- 12.3 Colombia
- 12.4 Chile
- 12.5 Rest of Latin America
Chapter 13. Middle East Positive Air Pressure Devices Market
- 13.1 Saudi Arabia
- 13.2 United Arab Emirates
- 13.3 Turkey
- 13.4 Israel
- 13.5 Iran
- 13.6 Rest of the Middle East
Chapter 14. Africa Positive Air Pressure Devices Market
- 14.1 South Africa
- 14.2 Egypt
- 14.3 Nigeria
- 14.4 Morocco
- 14.5 Rest of Africa
Chapter 15. Positive Air Pressure Devices Company Profiles
- 15.1 [Company 01]
- 15.1.1 Company Overview
- 15.1.2 Key Management Personnel
- 15.1.3 Products & Services Portfolio
- 15.1.4 Financial Performance
- 15.1.5 Key Market Focus & Geographic Presence
- 15.1.6 Recent Developments & Strategic Initiatives
Note: The company profile list is preliminary and may change based on research findings, market developments, data availability, and client requirements.
Chapter 16. Appendices
- Appendix A – List of Abbreviations & Acronyms
- Appendix B – Industry Classification Code Reference – Full Series
- Appendix C – Production & Capacity Data Tables
- Appendix D – End-Use & Demand Base Tables
- Appendix E – Consumption & Replacement Rate Assumptions
- Appendix F – ASP Reference Tables
- Appendix G – Manufacturing & Facility Database
- Appendix H – Import-Export Data Tables
- Appendix I – Regulatory Summary Tables
- Appendix J – Primary Research Participant List (Anonymized)
- Appendix K – Primary Research Questionnaire Framework
- Appendix L – Data Sources & Bibliography
- Appendix M – Market Size Divergence & Source Comparison
Chapter 17. Research Methodology
- 17.1 Research Framework & Philosophy
- 17.2 Secondary Research – Sources, Hierarchy & Data Extraction
- 17.3 Data Modeling – Bottom-Up & Top-Down Market Sizing
- 17.4 Primary Research – Stakeholder Framework, LOI & Sample Sizes
- 17.5 Forecast Methodology – Regression, Scenario & Sensitivity Analysis
- 17.6 Quality Control – Four-Layer Validation Framework
- 17.7 Limitations & Standard Assumptions
- 17.8 Disclaimer
