
Market Overview
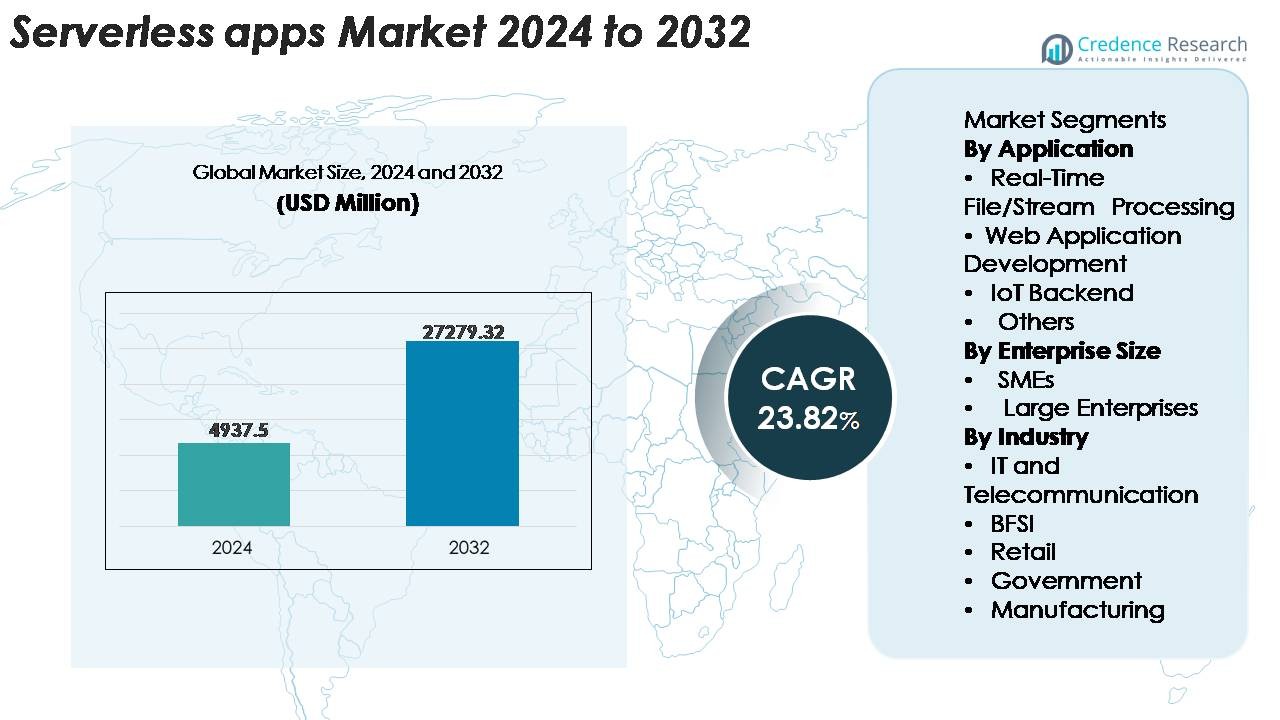
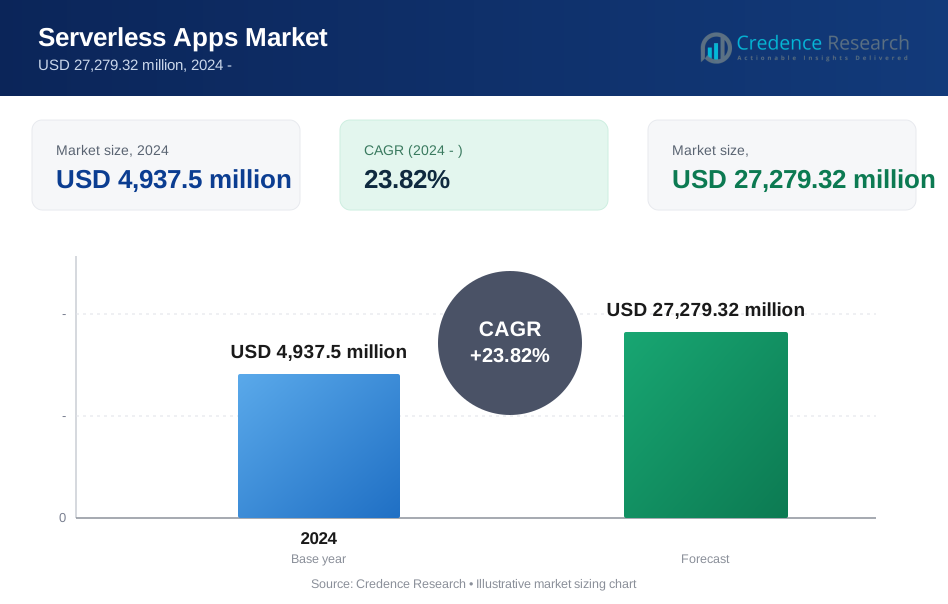
The global serverless applications market was valued at USD 4,937.5 million in 2024 and is projected to reach USD 27,279.32 million by 2032, expanding at a CAGR of 23.82% during the forecast period (2025–2032).
| REPORT ATTRIBUTE | DETAILS |
|---|---|
| Historical Period | 2020-2023 |
| Base Year | 2024 |
| Forecast Period | 2025-2032 |
| Serverless Apps Market Size 2024 | USD 4,937.5 Million |
| Serverless Apps Market, CAGR | 23.82% |
| Serverless Apps Market Size 2032 | USD 27,279.32 Million |
The serverless applications market is shaped by major cloud and technology providers that dominate global adoption through extensive FaaS, API management, and event-driven computing capabilities. Leading players include Amazon Web Services (AWS), Microsoft Azure, Google Cloud, IBM, Oracle, Alibaba Cloud, Cisco, and Nutanix, each strengthening their portfolios with automation, integrated developer tools, and high-performance serverless runtimes. North America remains the dominant regional market, holding an exact 38% share, driven by advanced cloud maturity and strong enterprise modernization initiatives. Europe and Asia-Pacific follow as high-growth regions as enterprises accelerate digital transformation and expand cloud-native, event-oriented architectures.
Market Insights
- The global serverless applications market was valued at USD 4,937.5 million in 2024 and is projected to reach USD 27,279.32 million by 2032, registering a strong CAGR of 23.82% during the forecast period.
- Demand is driven by rapid enterprise migration to microservices, automation of event-driven workflows, and the need for scalable, cost-efficient cloud execution models across BFSI, telecom, retail, and manufacturing sectors.
- Key trends include the expansion of AI-enabled real-time processing, increased adoption of multi-cloud and hybrid serverless frameworks, and deeper integration with edge computing for low-latency IoT workloads.
- The competitive landscape is dominated by AWS, Microsoft, Google, IBM, Oracle, Alibaba Cloud, and Cisco, with serverless shaping product differentiation through enhanced runtime performance, security, and developer tooling; however, challenges include vendor lock-in and observability complexity.
- Regionally, North America leads with 38% share, followed by Europe at 27% and Asia-Pacific at 24%, while the Real-Time File/Stream Processing segment holds the largest application share due to high-volume event analytics demand.
Market Segmentation Analysis:
By Application
Real-time file and stream processing remains the dominant application segment, accounting for the largest market share due to its critical role in analytics-driven architectures, log aggregation, fraud detection, and event-driven automation. Organizations prefer serverless functions for their ability to scale instantly during traffic spikes and handle parallel execution without infrastructure management. Web application development also grows steadily as developers adopt FaaS to accelerate deployment cycles. The IoT backend segment benefits from lightweight compute requirements and device-triggered workflows, while the “Others” category includes batch jobs, scheduled tasks, and workflow orchestration gaining traction across digital enterprises.
- For instance, AWS Lambda supports up to 10,240 MB of memory and 6 vCPUs per function, enabling high-throughput parallel processing for event streams.
By Enterprise Size
Large enterprises hold the dominant share in the serverless applications market, driven by their rapid cloud modernization initiatives, extensive API-based systems, and the need to process high-volume, latency-sensitive workloads. They leverage serverless architectures to reduce operational overhead, improve resource utilization, and accelerate application delivery across multi-cloud environments. SMEs, however, represent a fast-growing segment as they adopt serverless platforms to avoid upfront infrastructure investments and access enterprise-grade scalability at minimal cost. Flexible pricing models, simplified DevOps, and integration with managed databases and analytics tools further expand adoption across both enterprise categories.
- For instance, AWS allows enterprises to raise their Lambda concurrency limits into the tens of thousands far above the default 1,000 concurrent executions to support mission-critical workloads.
By Industry
IT and telecommunications is the leading industry segment, holding the highest market share due to its heavy reliance on API management, real-time network analytics, microservices modernization, and automated provisioning workflows. BFSI rapidly increases adoption for event-based transaction processing, security monitoring, and fraud detection. Retail leverages serverless for inventory visibility, personalized recommendations, and omnichannel workloads. Government agencies utilize it for digital public services and demand-based computing efficiency, while manufacturing integrates serverless architectures into predictive maintenance, production monitoring, and connected-factory ecosystems, supporting scalable automation across diverse industrial operations.
Key Growth Drivers
Rising Enterprise Shift Toward Event-Driven and Microservices Architectures
Enterprises increasingly transition from monolithic systems to microservices and event-driven architectures, creating strong momentum for serverless adoption. Organizations prioritise agility, modular deployment, and real-time responsiveness, which serverless platforms deliver through automatic scaling, distributed execution, and stateless function design. As digital ecosystems expand, applications generate continuous event streams from API triggers to IoT signals and user interactions requiring rapid processing without infrastructure bottlenecks. Serverless computing supports these needs by executing granular functions independently, reducing deployment cycles, and accelerating innovation. Cloud providers further enhance this shift through built-in orchestration tools, managed API gateways, and integrated monitoring capabilities that simplify lifecycle management. As businesses intensify modernization initiatives across retail, BFSI, telecom, and manufacturing, the demand for lightweight, event-responsive applications strengthens the role of serverless in supporting scalable, fault-tolerant digital operations.
- For instance, Amazon EventBridge supports a region-specific default throughput for event ingestion, which is up to 10,000 events per second per event bus in major regions (like us-east-1, us-west-2, and eu-west-1), while other regions have lower defaults. These are adjustable quotas, enabling enterprises to process large-scale event streams by requesting increases through the AWS Service Quotas console without needing manual provisioning of the underlying infrastructure.
Growing Need for Cost Optimization and Operational Efficiency in Cloud Workloads
Organizations across sectors prioritize cost optimization as cloud spending becomes a larger share of IT budgets. Serverless models address this requirement by eliminating idle resource consumption, enabling pay-per-execution pricing, and reducing infrastructure maintenance overhead. Businesses avoid provisioning, scaling, and patching servers, allowing development teams to focus entirely on application logic and faster release cycles. This operational efficiency significantly reduces total cost of ownership for compute-intensive and variable workloads. Serverless frameworks also integrate automated scaling, fault recovery, and usage-based billing, which benefit enterprises with fluctuating demand patterns such as e-commerce traffic peaks, analytics batch jobs, and periodic backend workflows. As companies consolidate DevOps workflows and reduce hardware dependencies, serverless platforms become strategic cost-saving tools. The shift toward financial governance frameworks (FinOps) further accelerates adoption, as organizations identify serverless as a key mechanism for optimizing cloud consumption and improving compute efficiency.
- For instance, AWS Lambda bills execution in increments as small as 1 millisecond, allowing enterprises to pay only for the exact compute time consumed rather than pre-allocated capacity.
Expansion of Cloud-Native Development and Rapid Adoption of Modern DevOps Practices
The global rise of cloud-native development supports strong growth in serverless applications. Businesses increasingly adopt containerization, CI/CD automation, API-first design, and GitOps workflows, all of which align naturally with serverless environments. Serverless enables developers to build modular, decoupled functions that integrate seamlessly into cloud-native ecosystems, accelerating delivery cycles and increasing deployment frequency. DevOps teams benefit from reduced complexity, faster testing, and real-time monitoring embedded within serverless platforms. The emergence of low-code and function-based development tools further democratizes application creation, enabling cross-functional teams to build lightweight serverless services quickly. As organizations scale their digital products and adopt continuous delivery pipelines, the need for architectures that support rapid iteration, instant scalability, and automated operational management becomes essential. Serverless computing fulfills these requirements, strengthening its role as a foundational component of modern DevOps and cloud-native transformation strategies.
Key Trends & Opportunities
Expansion of AI-Driven, Data-Intensive, and Real-Time Processing Use Cases
Serverless platforms are increasingly used to handle AI workflows, streaming analytics, and real-time processing tasks, opening new growth opportunities. As enterprises deploy machine learning pipelines, IoT telemetry systems, and edge analytics, the need for instantaneous compute becomes critical. Serverless functions support these demands by executing parallel tasks at scale, ingesting data bursts, and triggering automated pipelines without latency-heavy provisioning. Cloud providers enhance this capability by integrating serverless with AI inference engines, vector databases, and autonomous orchestration systems. This trend enables real-time fraud detection, personalized customer experiences, real-time network optimization, and sensor-driven industrial automation. The convergence of serverless with AI/ML and edge computing creates substantial opportunity for industries seeking low-latency, intelligence-driven decision systems. As adoption accelerates across BFSI, telecom, retail, and logistics, serverless becomes a key enabler of next-generation data-centric applications.
- For instance, Cloudflare Workers AI runs inference on its global edge network of more than 310 data centers, reducing model response times to under 20 milliseconds for latency-sensitive tasks.
Rising Adoption of Serverless for Multi-Cloud, Hybrid Cloud, and Edge Deployments
Businesses increasingly embrace multi-cloud and hybrid cloud models to reduce vendor dependency, strengthen resilience, and optimize workload distribution. This shift expands opportunities for serverless frameworks that can operate seamlessly across diverse environments. Vendors now offer interoperable serverless runtimes, open-source function engines, and decentralized compute layers that extend serverless capabilities to edge nodes and on-premises systems. Edge serverless platforms enable real-time data processing closer to the source in manufacturing plants, telecom networks, healthcare facilities, and retail outlets. Hybrid serverless adoption supports compliance, security, and localized execution for regulated environments while ensuring cloud-level scalability. As organizations pursue distributed computing strategies, serverless functions serve as flexible execution layers capable of running across geographically dispersed infrastructures. This trend positions serverless as a core component of enterprise digital ecosystems that require agility, resilience, and workload portability.
- For instance, Google Cloud’s Anthos can manage serverless workloads across on-premises and multiple public clouds, supporting up to 15,000 nodes within a single managed cluster.
Key Challenges
Complexity in Debugging, Monitoring, and Managing Function-Based Distributed Systems
Despite its advantages, serverless computing introduces operational challenges related to debugging, observability, and dependency tracing. Since applications run as numerous independent functions, identifying performance issues, latency bottlenecks, or failure points becomes more complex than in traditional architectures. Cold starts, asynchronous execution, and multi-service interactions add additional layers of complexity for engineering teams. While cloud providers offer monitoring tools, they often lack granular visibility across function chains and hybrid deployments. Organizations must adopt advanced observability solutions that support distributed tracing, log aggregation, and end-to-end flow mapping. The increasing complexity requires more mature DevOps practices and specialized skill sets, creating adoption hurdles for teams transitioning from monolithic or VM-based architectures. As workloads grow in scale, these operational challenges intensify, requiring better tooling and architectural discipline.
Vendor Lock-In, Portability Limitations, and Compliance Constraints
Vendor lock-in remains a prominent challenge in serverless adoption, as organizations risk becoming dependent on proprietary runtimes, APIs, and ecosystem integrations tied to specific cloud providers. Migrating serverless workloads across clouds is labor-intensive due to differences in triggers, event formats, identity frameworks, and orchestration tools. This limits flexibility for multi-cloud strategies and increases long-term switching costs. Industries such as BFSI, government, and healthcare also face regulatory challenges that require data localization, auditability, and strict governance controls-areas where serverless environments vary widely across regions. Additionally, limited control over underlying infrastructure complicates compliance with security standards and performance guarantees. These constraints force enterprises to carefully evaluate portability, governance frameworks, and architectural design before scaling serverless deployments.
Regional Analysis
North America
North America holds the largest share of the global serverless applications market, accounting for around 38% in 2024. Strong cloud maturity, rapid enterprise modernization, and extensive adoption of event-driven architectures reinforce the region’s leadership. Major cloud providers such as AWS, Microsoft, and Google dominate regional deployments through extensive serverless portfolios and integrated developer ecosystems. Industries including BFSI, retail, telecom, and technology lead migration to microservices and API-centric systems. Rising investments in real-time analytics, automation, and DevOps acceleration continue to support market growth. Additionally, robust enterprise spending on AI-driven workloads enhances serverless adoption across digital-native and large legacy enterprises.
Europe
Europe represents about 27% of the serverless applications market, supported by strong enterprise digitalization and increasing compliance-focused cloud adoption. Organizations in Germany, the U.K., France, and the Nordics drive demand for serverless workloads, particularly for IoT analytics, network automation, and customer experience applications. The region benefits from strict regulatory frameworks such as GDPR, pushing companies toward architectures that optimize efficiency while ensuring data integrity and operational transparency. BFSI, public sector, and manufacturing industries lead adoption, driven by modernization of legacy systems. Growing emphasis on low-latency edge workloads and hybrid cloud environments further strengthens serverless integration across European enterprises.
Asia-Pacific
Asia-Pacific is the fastest-growing regional market, holding approximately 24% share and expected to expand rapidly as cloud-native adoption accelerates. Strong digital transformation initiatives in China, India, Japan, South Korea, and Southeast Asia drive large-scale consumption of serverless platforms for e-commerce, fintech, telecommunications, and mobile-first applications. The region benefits from significant investments in 5G, IoT, and edge infrastructure, enabling enterprises to deploy event-driven and real-time processing workloads efficiently. SMEs adopting cloud-first strategies contribute substantially to growth due to cost flexibility and simplified development models. As hyperscalers expand regional data centers, serverless adoption gains traction across public and private sectors.
Latin America
Latin America captures around 6% of the serverless applications market, with emerging adoption across Brazil, Mexico, Colombia, and Chile. Regional enterprises increasingly adopt cloud-native architectures to improve agility, reduce infrastructure costs, and modernize legacy environments. Growth is driven by expanding fintech ecosystems, rising e-commerce activity, and broader digital transformation across telecom and retail sectors. Local governments and public institutions gradually migrate services toward scalable serverless workflows to improve service delivery. While adoption is slower due to cloud skill gaps and uneven infrastructure maturity, increasing cloud investment by global hyperscalers continues to strengthen the region’s serverless ecosystem.
Middle East & Africa
The Middle East & Africa region holds about 5% of the serverless applications market, supported by growing cloud investments in the UAE, Saudi Arabia, South Africa, and Egypt. Government-led digital transformation programs, smart city initiatives, and large-scale modernization in banking, telecommunications, and public services fuel demand for scalable serverless platforms. Enterprises increasingly deploy event-driven analytics, API-based services, and IoT backends to enhance operational efficiency. Cloud providers are expanding regional data centers, enabling compliance-driven sectors to shift workloads to secure serverless architectures. Despite infrastructure constraints in parts of Africa, adoption continues to rise as organizations prioritize cost-efficient digital solutions.
Market Segmentations:
By Application
- Real-Time File/Stream Processing
- Web Application Development
- IoT Backend
- Others
By Enterprise Size
- SMEs
- Large Enterprises
By Industry
- IT and Telecommunication
- BFSI
- Retail
- Government
- Manufacturing
By Geography
- North America
- U.S.
- Canada
- Mexico
- Europe
- Germany
- France
- U.K.
- Italy
- Spain
- Rest of Europe
- Asia Pacific
- China
- Japan
- India
- South Korea
- South-east Asia
- Rest of Asia Pacific
- Latin America
- Brazil
- Argentina
- Rest of Latin America
- Middle East & Africa
- GCC Countries
- South Africa
- Rest of the Middle East and Africa
Competitive Landscape
The competitive landscape of the serverless applications market is defined by the strong presence of global cloud providers and technology vendors offering advanced function-as-a-service (FaaS) platforms, API ecosystems, and event-driven computing capabilities. AWS Lambda, Microsoft Azure Functions, and Google Cloud Functions lead the market through extensive integrations, broad runtime support, and mature developer environments. Players such as IBM, Oracle, Alibaba Cloud, and Cisco strengthen competition by expanding hybrid and multi-cloud serverless frameworks tailored for regulated industries and enterprise-grade workloads. Vendors increasingly differentiate through enhanced cold-start performance, real-time observability, security automation, and support for AI-driven workloads. Strategic partnerships with DevOps tooling companies, container orchestration providers, and edge computing platforms further expand their market reach. As enterprise digital transformation accelerates, competition intensifies around ease of adoption, interoperability, API management depth, and ecosystem maturity, driving continuous innovation across the global serverless application landscape.
Key Player Analysis
- Cloudflare, Inc.
- Oracle Corporation
- Twistlock Inc.
- Serverless, Inc.
- Cisco Systems, Inc.
- Rackspace Technology
- Palo Alto Networks
- Google LLC
- NTT Data Corporation
- Apache
Recent Developments
- In November 2025, Cloudflare announced it will acquire Replicate to enable developers to deploy and run AI models globally via its Workers serverless platform.
- In October 2025, Oracle launched enhancements for its Autonomous AI Database Serverless service (including AI-native workloads, external table caching, and workload replay) under its serverless database portfolio.
- In March 2025, Rackspace announced its "Rackspace AI Business", a high-performance hybrid cloud platform optimised for AI training and inference, aimed at modern cloud-native applications including serverless compute patterns.
Report Coverage
The research report offers an in-depth analysis based on Application, Enterprise size, Industry and Geography. It details leading market players, providing an overview of their business, product offerings, investments, revenue streams, and key applications. Additionally, the report includes insights into the competitive environment, SWOT analysis, current market trends, as well as the primary drivers and constraints. Furthermore, it discusses various factors that have driven market expansion in recent years. The report also explores market dynamics, regulatory scenarios, and technological advancements that are shaping the industry. It assesses the impact of external factors and global economic changes on market growth. Lastly, it provides strategic recommendations for new entrants and established companies to navigate the complexities of the market.
Future Outlook
- Serverless adoption will accelerate as enterprises modernize applications and prioritize microservices and event-driven architectures.
- Real-time data processing and AI-driven workflows will increasingly shift to serverless platforms for instant scalability.
- Hybrid and multi-cloud serverless deployments will expand as organizations reduce dependency on a single cloud provider.
- Edge serverless computing will grow as low-latency applications in IoT, manufacturing, and telecom become mainstream.
- Developer productivity will improve through enhanced runtimes, integrated observability tools, and automated deployment pipelines.
- Security features such as zero-trust execution and automated vulnerability detection will become standard.
- BFSI, telecom, retail, and government sectors will drive large-scale adoption for mission-critical digital services.
- Serverless container integration will deepen as organizations balance portability with high-performance compute needs.
- Open-source function frameworks will gain traction, reducing vendor lock-in and supporting customizable deployments.
- Ecosystem partnerships across DevOps, API management, and edge platforms will strengthen competitive differentiation.
Request a Free Sample
Fill in your details and we'll send you a free sample report.
- Sample data tables & charts
- Research methodology
Need a Custom Version of This Report?
Tailor the scope, geography, or segments to your exact requirements.
- Custom geography or segment scope
- Direct access to our analyst team
Frequently Asked Questions
What is the current market size for Serverless apps, and what is its projected size in 2032?
At what Compound Annual Growth Rate is the Serverless apps market projected to grow between 2025 and 2032?
Which Serverless apps segment held the largest share in 2024?
What are the primary factors fueling the growth of the Serverless apps market?
Who are the leading companies in the Serverless apps market?
Which region commanded the largest share of the Serverless apps market in 2024?
Table of Content
Chapter 1. Report Introduction
- 1.1 Report Description & Purpose
- 1.1.1 Report Title & Market Definition
- 1.1.2 Unique Selling Propositions (USP) & Key Differentiators
- 1.1.3 Value Proposition for Stakeholders
- 1.2 Research Objectives
- 1.2.1 Market Sizing Objectives (Volume & Revenue) (Volume Where Applicable)
- 1.2.2 Segmentation Objectives
- 1.2.3 Competitive Intelligence Objectives
- 1.2.4 Forecast & Scenario Objectives
- 1.3 Report Scope
- 1.3.1 Serverless Apps Scope – Segments & Subsegments Covered
- 1.3.2 Geographic Scope – Regions & Countries Covered
- 1.3.3 Historical Period, Base Year & Forecast Period (2024; forecast to the forecast period)
- 1.3.4 Inclusions & Exclusions
- 1.4 Industry Classification & Applicable Codes
- 1.5 Currency, Measurement Units & Valuation Basis
- 1.6 Target Stakeholders
- 1.7 Limitations & Assumptions
Chapter 2. Executive Summary
- 2.1 Global Serverless Apps Market Snapshot
- 2.1.1 Market Size – Historical (2024) & Forecast (the forecast period) (2024: USD 4,937.5 million → forecast year: USD 27,279.32 million)
- 2.1.2 Volume & Revenue – Global Totals (Volume Where Applicable)
- 2.1.3 Key Market Highlights – Top Five Facts
- 2.2 Serverless Apps Market Segmentation Snapshot
- 2.2.1 Market Split by Region – 2024 vs.
- 2.3 Competitive Snapshot
- 2.3.1 Top 10 Players by Revenue Share – 2024
- 2.3.2 Top 10 Players by Volume Share – 2024 (Volume Where Applicable)
- 2.3.3 Recent Strategic Developments (18-Month Summary)
- 2.4 Key Investment Highlights & Strategic Conclusions
Chapter 3. Serverless Apps Market Dynamics & Industry Analysis
- 3.1 Market Overview & Context
- 3.1.1 Serverless Apps Market Position in the Broader Industry Value Chain
- 3.1.2 Demand Structure & Purchasing Dynamics
- 3.1.3 Market Maturity & Development Stage by Region
- 3.2 Serverless Apps Market Drivers
- 3.3 Serverless Apps Market Restraints & Challenges
- 3.4 Serverless Apps Market Opportunities
- 3.5 Porter's Five Forces Analysis
- 3.5.1 Threat of New Entrants
- 3.5.2 Bargaining Power of Suppliers
- 3.5.3 Bargaining Power of Buyers
- 3.5.4 Threat of Substitutes
- 3.5.5 Competitive Rivalry – Intensity Assessment
- 3.6 Serverless Apps Value Chain Analysis
- 3.6.1 Upstream – Key Inputs, Resources & Suppliers
- 3.6.1.1 Key Input/Resource 1
- 3.6.1.2 Key Input/Resource 2
- 3.6.1.3 Key Input/Resource 3
- 3.6.2 Midstream – Core Operations & Value Creation
- 3.6.2.1 Operating Model & Process Overview
- 3.6.2.2 Key Operating Locations & Capabilities by Company
- 3.6.3 Downstream – Market Channels & End Users
- 3.6.3.1 Direct Sales & Customer Engagement Channels
- 3.6.3.2 Indirect Sales, Intermediaries & Partner Channels
- 3.6.4 Value Chain Profitability Analysis
- 3.6.1 Upstream – Key Inputs, Resources & Suppliers
- 3.7 PESTEL Analysis
- 3.7.1 Political Factors
- 3.7.2 Economic Factors
- 3.7.3 Social Factors
- 3.7.4 Technological Factors
- 3.7.5 Environmental Factors
- 3.7.6 Legal Factors
- 3.8 Serverless Apps Supply Chain Analysis
- 3.8.1 Critical Input & Resource Availability Risk Assessment
- 3.8.2 Supplier & Operational Concentration Risk (Geographic Exposure)
- 3.8.3 Supply & Service Disruption Impact Analysis
- 3.9 Regulatory & Policy Landscape
Note: The regulatory and policy landscape section covers regulations based on their applicability to the market, Serverless Apps category, geography, and scope of the study. Only regulatory frameworks with a material impact on operations, compliance, trade, sustainability, or market access are analyzed in detail.
Chapter 4. Key Investment Pockets & Opportunity Analysis
- 4.1 Serverless Apps Market Attractiveness Analysis
- 4.1.1 By Region – Investment Attractiveness Matrix (Market Size × CAGR)
- 4.2 Absolute Revenue Growth Opportunity
- 4.2.1 By Region – Absolute Revenue Growth Through the forecast period
- 4.3 Incremental Demand Opportunity
- 4.3.1 By Region – Incremental Demand Through the forecast period
- 4.3.2 Segment – Incremental Demand
- 4.4 Emerging Submarket Opportunity Deep Dive (Subject to Applicability)
- 4.5 Priority Market Opportunity Scorecards
- 4.5.1 United States
- 4.5.2 Europe
- 4.5.3 Asia
- 4.5.4 Middle East & Africa
Note: Priority market opportunity scorecards reflect the geographic scope and strategic relevance of the study. Listed markets are indicative and may be adapted to the industry.
Chapter 5. Serverless Apps Cross-Border Trade & Market Access Analysis
- 5.1 International Trade & Cross-Border Activity Overview
- 5.1.1 Global Export Value by Country (2024)
- 5.1.2 Global Export Volume by Country (2024) (Volume Where Applicable)
- 5.1.3 Global Import Value by Country (2024)
- 5.1.4 Global Import Volume by Country (2024) (Volume Where Applicable)
- 5.1.5 Net Trade Balance by Country (2024)
- 5.2 Export Analysis – Segment
- 5.2.1 Category 1 (Applicable Classification Code)
- 5.2.2 Category 2 (Applicable Classification Code)
- 5.2.3 Category 3 (Applicable Classification Code)
- 5.2.4 Category 4 (Applicable Classification Code)
- 5.2.5 Category 5 (Applicable Classification Code)
- 5.3 Import Analysis – Segment
- 5.3.1 Category 1 (Applicable Classification Code)
- 5.3.2 Category 2 (Applicable Classification Code)
- 5.3.3 Category 3 (Applicable Classification Code)
- 5.3.4 Category 4 (Applicable Classification Code)
- 5.3.5 Category 5 (Applicable Classification Code)
- 5.4 Cross-Border Pricing & Transaction Benchmarks
- 5.4.1 Export Pricing – Segment & Country
- 5.4.2 Import Pricing – Segment & Source Country
- 5.4.3 Price Trends (2024)
- 5.5 Key Cross-Border Trade & Delivery Routes
- 5.5.1 Cross-Border Trade/Delivery Route 1
- 5.5.2 Cross-Border Trade/Delivery Route 2
- 5.5.3 Cross-Border Trade/Delivery Route 3
- 5.5.4 Cross-Border Trade/Delivery Route 4
- 5.5.5 Cross-Border Trade/Delivery Route 5
- 5.6 Trade Policy & Market Access Impact Assessment
- 5.6.1 Tariff & Non-Tariff Barriers
- 5.6.2 Regional Trade & Economic Integration Frameworks
- 5.6.3 Bilateral & Multilateral Trade Agreements
- 5.6.4 Cross-Border Operating, Licensing & Localization Requirements
Note: This chapter applies where cross-border trade or delivery is relevant to Serverless Apps. Goods, services, and digital offerings are assessed using applicable classifications and transaction measures. Import-export volumes, trade balances, and route analyses are included only where meaningful to the market.
Chapter 6. Competitive Landscape & Company Benchmarking
- 6.1 Serverless Apps Market Concentration & Structure
- 6.1.1 Herfindahl-Hirschman Index (HHI) – vs. 2024
- 6.1.2 Leading, Mid-Sized & Emerging Player Structure
- 6.1.3 Global, Regional & Local Player Dynamics
- 6.2 Serverless Apps Market Share Analysis – 2024
- 6.2.1 Global Revenue Share by Company
- 6.2.2 Global Volume Share by Company (Volume Where Applicable)
- 6.2.3 Regional Revenue Share
- 6.2.4 Market Share Evolution ( vs. 2024)
- 6.2.5 Company Market Share by Key Segment
- 6.2.6 Company Market Share by Customer Group
- 6.3 Operating Scale, Capacity & Infrastructure Analysis
- 6.3.1 Global Operating Scale & Supply Capacity
- 6.3.2 Resource Utilization & Operating Efficiency
- 6.3.3 Output, Service Delivery & Activity Metrics
- 6.3.4 Operating Footprint & Infrastructure Map
- 6.3.5 Planned Operational & Capacity Expansion
- 6.4 Serverless Apps Competitive Benchmarking Matrix
- 6.4.1 Revenue, Growth, Profitability & Operating Metric Comparison
- 6.4.2 Channel Revenue Mix
- 6.4.3 Geographic Revenue Exposure
- 6.4.4 R&D Intensity
- 6.4.5 Sustainability Maturity
- 6.5 Strategic Developments in Serverless Apps (Last 24 Months)
- 6.5.1 Mergers, Acquisitions & Divestments
- 6.5.2 New Products, Services & Solutions in Serverless Apps
- 6.5.3 Operational & Infrastructure Expansions
- 6.5.4 Strategic Alliances, Joint Ventures & Partnerships
- 6.5.5 Distribution Expansion & Market Entry
- 6.5.6 Sustainability & ESG Initiatives
- 6.6 Competitive Strategy Mapping
- 6.6.1 Leader, Challenger, Follower & Niche Classification
- 6.6.2 Pricing Strategy Comparison
- 6.6.3 Channel Strategy Matrix
Note: Strategic developments are included based on their materiality and the availability of reliable information.
Chapter 7. Global Serverless Apps Market – By Sales & Delivery Channel
- 7.1 Segment Overview
- 7.1.1 Volume & Revenue Split by Channel (2024 & ) (Volume Where Applicable)
- 7.1.2 Channel Mix Evolution (the forecast period)
Chapter 8. Regional Market Analysis – Global Overview
- 8.1 Global Regional Overview
- 8.1.1 Regional Volume Share (Volume Where Applicable)
- 8.1.2 Regional Revenue Share
- 8.1.3 Regional Volume by Region (Volume Where Applicable)
- 8.1.4 Regional Revenue by Region
- 8.1.5 Regional Forecast Through the forecast period
- 8.2 Cross-Regional Segment Analysis
- 8.2.1 By Sales & Delivery Channel
- 8.2.2 By Competitive Positioning & Price Tier
Chapter 9. North America Serverless Apps Market
- 9.1 United States
- 9.2 Canada
- 9.3 Mexico
Chapter 10. Europe Serverless Apps Market
- 10.1 Germany
- 10.2 France
- 10.3 Italy
- 10.4 United Kingdom
- 10.5 Spain
- 10.6 Poland
- 10.7 Russia
- 10.8 Netherlands
- 10.9 Belgium
- 10.10 Sweden
- 10.11 Denmark
- 10.12 Norway
- 10.13 Rest of Europe
Chapter 11. Asia Pacific Serverless Apps Market
- 11.1 China
- 11.2 India
- 11.3 Japan
- 11.4 South Korea
- 11.5 Thailand
- 11.6 Indonesia
- 11.7 Vietnam
- 11.8 Malaysia
- 11.9 Australia
- 11.10 Rest of Asia Pacific
Chapter 12. Latin America Serverless Apps Market
- 12.1 Brazil
- 12.2 Argentina
- 12.3 Colombia
- 12.4 Chile
- 12.5 Rest of Latin America
Chapter 13. Middle East Serverless Apps Market
- 13.1 Saudi Arabia
- 13.2 United Arab Emirates
- 13.3 Turkey
- 13.4 Israel
- 13.5 Iran
- 13.6 Rest of the Middle East
Chapter 14. Africa Serverless Apps Market
- 14.1 South Africa
- 14.2 Egypt
- 14.3 Nigeria
- 14.4 Morocco
- 14.5 Rest of Africa
Chapter 15. Serverless Apps Company Profiles
- 15.1 [Company 01]
- 15.1.1 Company Overview
- 15.1.2 Key Management Personnel
- 15.1.3 Products & Services Portfolio
- 15.1.4 Financial Performance
- 15.1.5 Key Market Focus & Geographic Presence
- 15.1.6 Recent Developments & Strategic Initiatives
Note: The company profile list is preliminary and may change based on research findings, market developments, data availability, and client requirements.
Chapter 16. Appendices
- Appendix A – List of Abbreviations & Acronyms
- Appendix B – Industry Classification Code Reference – Full Series
- Appendix C – Supply, Output & Operating Capacity Data Tables
- Appendix D – End-Use & Demand Base Tables
- Appendix E – Demand, Adoption & Usage Assumptions
- Appendix F – Pricing & Revenue Metric Reference Tables
- Appendix G – Company Operations & Infrastructure Database
- Appendix H – Cross-Border Trade & Activity Data Tables (Where Applicable)
- Appendix I – Regulatory Summary Tables
- Appendix J – Primary Research Participant List (Anonymized)
- Appendix K – Primary Research Questionnaire Framework
- Appendix L – Data Sources & Bibliography
- Appendix M – Market Size Divergence & Source Comparison
Chapter 17. Research Methodology
- 17.1 Research Framework & Philosophy
- 17.2 Secondary Research – Sources, Hierarchy & Data Extraction
- 17.3 Data Modeling – Bottom-Up & Top-Down Market Sizing
- 17.4 Primary Research – Stakeholder Framework, LOI & Sample Sizes
- 17.5 Forecast Methodology – Regression, Scenario & Sensitivity Analysis
- 17.6 Quality Control – Four-Layer Validation Framework
- 17.7 Limitations & Standard Assumptions
- 17.8 Disclaimer
