
Market Overview:
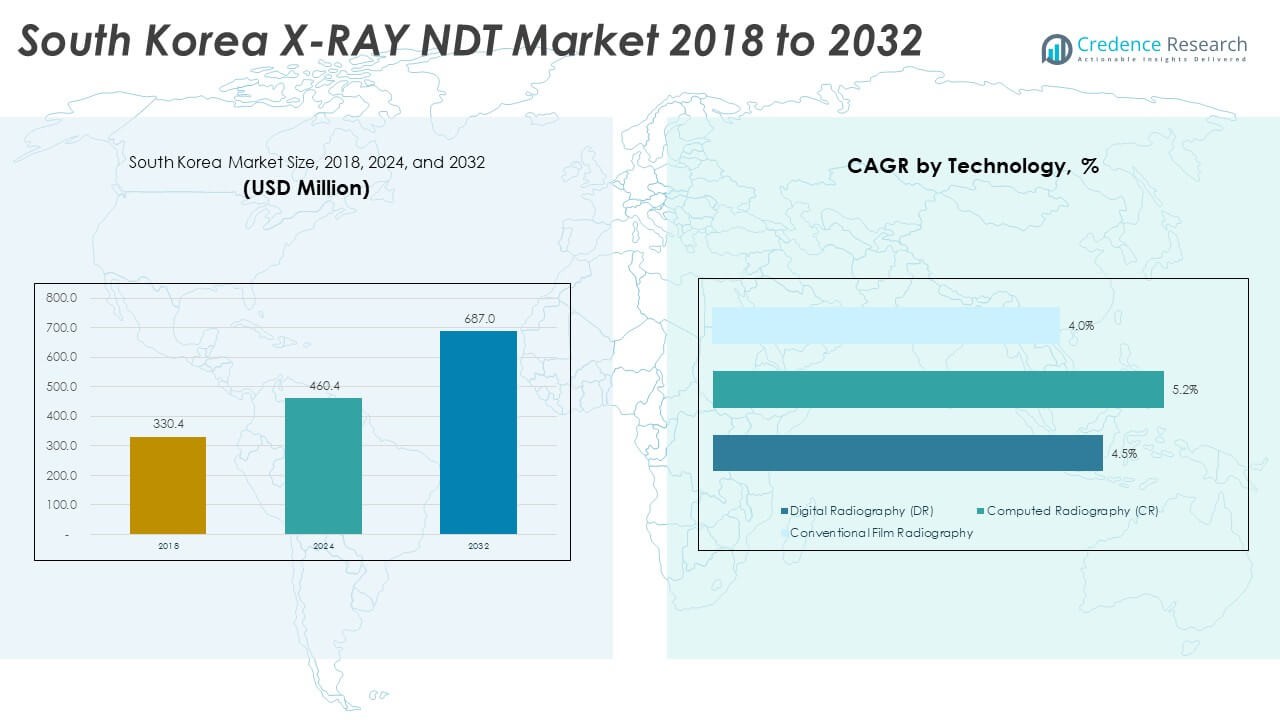
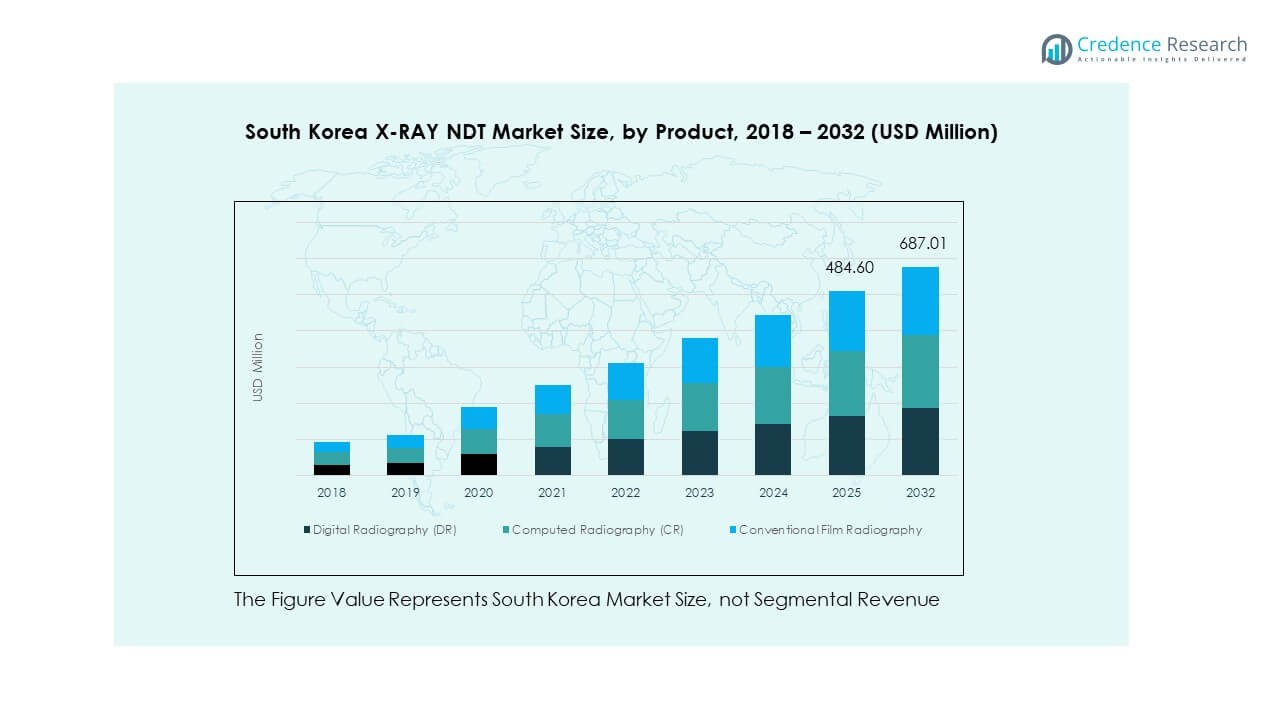
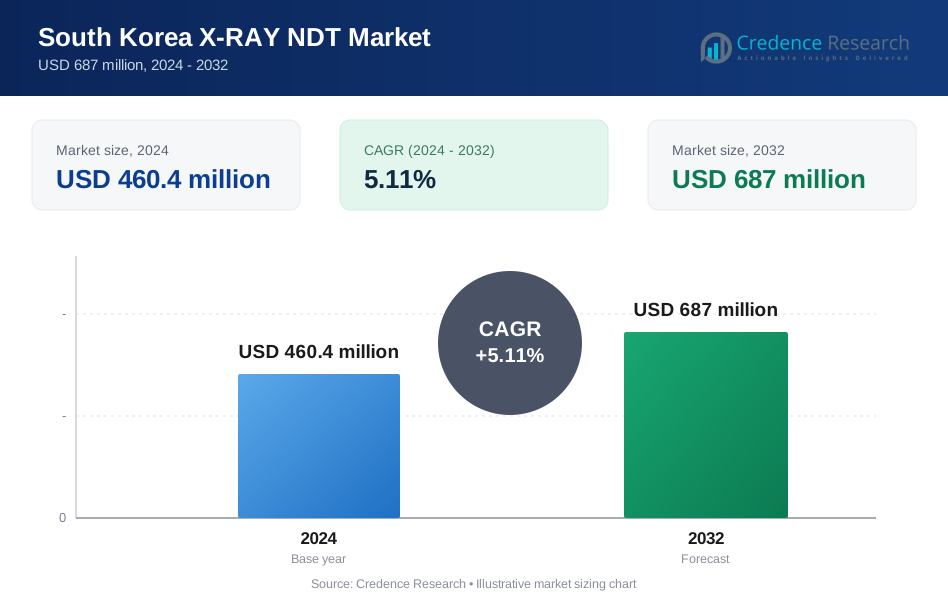
The South Korea X-RAY NDT Market size was valued at USD 330.4 million in 2018 to USD 460.4 million in 2024 and is anticipated to reach USD 687 million by 2032, at a CAGR of 5.11% during the forecast period.
| REPORT ATTRIBUTE | DETAILS |
|---|---|
| Historical Period | 2020-2023 |
| Base Year | 2024 |
| Forecast Period | 2025-2032 |
| South Korea X-RAY NDT Market Size 2024 | USD 460.4 Million |
| South Korea X-RAY NDT Market, CAGR | 5.11% |
| South Korea X-RAY NDT Market Size 2032 | USD 687 Million |
Market drivers center on advanced manufacturing growth and rising quality expectations. South Korea expands electric vehicle lines, semiconductor fabs, and precision electronics, which need accurate internal imaging for safe production. Companies adopt digital radiography, CT scanners, and automated inspection to reduce defects and maintain global compliance. Strong innovation in micro-joining, battery modules, and complex parts pushes higher resolution testing. Defense and aerospace suppliers raise quality rules, which encourages broader equipment upgrades across factories. These shifts strengthen long-term adoption across high-tech industries.
Regional analysis shows strong concentration around Seoul, Gyeonggi, and Incheon due to dense clusters of electronics, EV, and semiconductor plants. These hubs lead demand because factories operate high-volume lines that require advanced inspection. Emerging growth appears in Ulsan and Busan, supported by shipyards and heavy machinery producers seeking better weld and casting evaluation. Daegu and Gwangju also build momentum as automation expands in local industrial zones. Broader adoption aligns with South Korea’s nationwide focus on advanced manufacturing and export-ready quality standards.
Market Insights:
- The South Korea X-RAY NDT Market grew from USD 330.4 million in 2018 to USD 460.4 million in 2024 and is forecast to reach USD 687 million by 2032, progressing at a 5.11% CAGR, supported by rising inspection needs in EVs, semiconductors, and aerospace.
- The Seoul Capital Region leads with about 48–52% share, driven by dense semiconductor and electronics clusters; the Southeastern Belt holds 28–32% due to shipbuilding and petrochemical bases; the Southwest & Central region captures 16–20% backed by research institutes and advanced engineering hubs.
- The fastest-growing region is the Southwest & Central corridor, which maintains a 16–20% share, fueled by demand from defense-linked research centers and mid-scale manufacturing parks expanding automated inspection workflows.
- Digital Radiography (DR) appears to command the highest product share at an estimated 50% in the chart due to rapid adoption across high-volume and high-precision production lines.
- Computed Radiography (CR) holds roughly 35%, while Conventional Film Radiography contributes 20%, reflecting continued usage in legacy-heavy sectors like shipbuilding and pressure equipment inspection.
Market Drivers:
Rising Adoption of High-Precision Testing Across Advanced Manufacturing
The South Korea X-RAY NDT Market gains momentum through strong demand for precision testing across automotive, electronics, and shipbuilding segments. Manufacturers raise inspection standards to protect safety and reduce defect rates. EV battery producers rely on X-ray tools for cell integrity checks and module verification. Semiconductor lines use advanced imaging to validate micro-level joints. Shipyards require weld inspection under strict national rules. Aerospace suppliers follow global quality codes. Local factories expand automation that supports faster digital radiography. These factors strengthen steady adoption across production lines.
- For instance, Waygate Technologies provides industrial CT systems for battery pack inspection and failure analysis. Semiconductor lines use advanced imaging to validate micro-level joints; for example, Waygate’s high-resolution 2D X-ray and 3D CT solutions support electronics production lines.
Growth Driven by Expanding EV, Semiconductor, and Industrial Electronics Output
Rapid expansion in EV platforms pushes companies to adopt high-resolution radiography for module safety checks. The sector uses defect detection to improve thermal safety and structural durability. Semiconductor producers invest in imaging to track packaging reliability. Electronics firms validate solder precision to avoid field failures. EV and chip exports drive wider use of digital inspection. Inspection workflows support sustainable quality targets. Strong industrial clusters strengthen adoption. The South Korea X-RAY NDT Market moves toward deeper integration in advanced production lines.
- For instance, electronics manufacturers employ Waygate’s CT inspection to detect internal voids or mis-alignments in solder joints. Electronics firms validate solder precision to avoid field failures. EV and chip exports drive wider use of digital inspection.
Shift Toward Automation, AI-Backed Defect Detection, and Faster Cycle Times
AI-backed inspection tools support rapid defect isolation in high-volume lines. Automated recognition systems reduce manual review time. Robotics integration supports safe inspection in restricted areas. Portable units enable field checks across heavy plants. Automation improves consistency across multisite operations. Producers aim for lower downtime. AI enhances detection speed. Technology progress pushes companies to upgrade their inspection fleets.
Stricter Safety Regulations and Rising Compliance Mandates Across Industries
National standards push industries to maintain higher inspection quality. Shipyards and aerospace suppliers follow strict compliance rules. Electronics firms aim for zero-defect supply chains. EV safety norms require deeper checks at every assembly stage. Local regulators enforce strict oversight. Export-driven firms must match global testing codes. Strong verification needs raise demand for advanced imaging. The South Korea X-RAY NDT Market supports these requirements across large and mid-sized factories.
Market Trends:
Expansion of Digital Radiography and Real-Time Inspection Platforms
Digital radiography adoption rises as producers target faster validation cycles. Real-time imaging supports instant quality decisions. Factories shift from film units to digital units for higher efficiency. Real-time review improves accuracy in complex assembly checks. Battery and chip lines gain from fast screening. Lightweight portable systems gain traction across field operations. Digital platforms support cloud review workflows. The South Korea X-RAY NDT Market sees strong upgrades toward fully connected inspection lines.
- For instance, Waygate’s digital radiography (CR/DR) systems deliver fast, accurate imaging to replace older film-based radiography. Real-time review improves accuracy in complex assembly checks.
Increasing Use of Portable, Lightweight, and Field-Friendly X-Ray Systems
Portable systems gain momentum in shipyards, construction plants, and heavy industry. Light units support weld and pipeline checks. Field teams prefer rugged systems for remote work. Portable gear reduces downtime for industrial teams. Quick setup improves productivity for mobile tasks. Safety-focused designs support high-risk environments. Field units support rapid decision cycles. Portability strengthens market acceptance across diverse sectors.
- For instance, portable digital X-ray devices from global vendors enable inspectors to operate onsite without full-scale lab setup. Portable gear reduces downtime for industrial teams.
Integration of Cloud Analytics, Data Platforms, and Centralized Reporting Tools
Cloud tools support central review of inspection data. Factories use unified dashboards for defect trends. Central reporting helps multi-location plants maintain consistent quality. Data makes audit workflows easier for compliance teams. Cloud systems support fast collaboration across engineering groups. Centralized storage reduces the risk of data loss. Analytics improve precision in long-term process control. The South Korea X-RAY NDT Market gains from strong adoption of digital data management.
Rising Preference for Low-Dose, Energy-Efficient, and Worker-Safe Imaging Systems
Producers push for systems that lower radiation exposure. Low-dose units support worker safety goals. Energy-efficient systems reduce power loads in large factories. Compact cooling designs support space-limited plants. Safety certification drives interest in newer platforms. Low-risk systems fit strict global norms. These features boost adoption among export-focused factories. Market demand moves toward sustainable system designs.
Market Challenges Analysis:
High Equipment Costs, Skill Gaps, and Slow Integration in Smaller Factories
The South Korea X-RAY NDT Market faces challenges from high equipment costs. Many SMEs struggle to invest in advanced units. Skilled professionals remain limited for high-resolution systems. Training demands raise operational barriers. Factories face long qualification cycles for new tools. Legacy equipment slows digital adoption. Many firms find integration complex. Cost and skill gaps affect adoption speed across smaller industrial clusters.
Complex Compliance Requirements, Data Handling Restrictions, and Safety Protocol Pressures
Strict rules govern radiation, data control, and safety procedures. Compliance raises audit pressure on operators. Many factories require constant documentation updates. Data protection requirements create review delays. Complex facility layouts limit installation options. Safety norms require controlled environments. Each challenge slows deployment cycles for new platforms. Vendors work to simplify adoption steps.
Market Opportunities:
Growth Opportunities From AI-Enhanced Imaging, Automation, and High-Density Manufacturing
AI-enhanced systems create strong potential for high-volume factories. Automated recognition improves defect visibility. EV and chip plants seek faster inspection. Aerospace and defense suppliers upgrade to smarter units. Robotics integration supports safer workflows. Automated inspection improves overall efficiency. These shifts open new revenue areas for vendors. The South Korea X-RAY NDT Market gains long-term prospects from these advancements.
Expansion Potential in Export Manufacturing, Renewable Energy, and Infrastructure Projects
Export-focused sectors seek deeper inspection capabilities. Renewable plants adopt imaging for structural checks. Infrastructure expansion fuels weld and component analysis. Offshore and onshore facilities need regular inspection. Heavy industry modernization widens scope for imaging systems. Local suppliers pursue advanced contracts. These shifts support long-term opportunities for market growth. Strong sector expansion widens the adoption base.
Market Segmentation Analysis:
Technology Segment Analysis
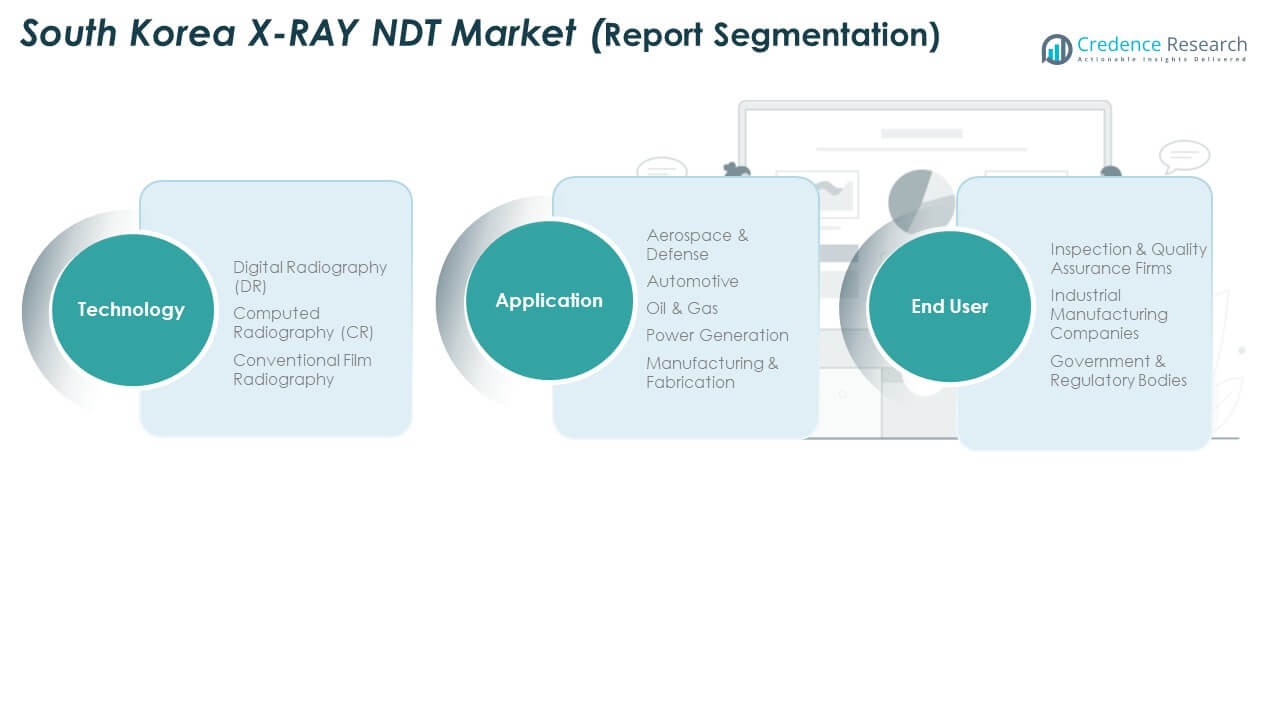
The South Korea X-RAY NDT Market gains strong traction from Digital Radiography (DR), which offers faster imaging, sharper resolution, and easier data integration for automated inspection lines. DR strengthens demand across semiconductor, EV, and electronics plants due to high throughput needs. Computed Radiography (CR) maintains relevance in mid-tier facilities seeking a cost-effective upgrade path from film. Conventional Film Radiography stays active in legacy-heavy sectors such as shipbuilding and defense where physical archiving and regulatory norms support continued use. Each technology tier serves different operational maturity levels and supports market depth.
Application Segment Analysis
Aerospace & Defense leads adoption due to strict compliance needs for welds, castings, and structural parts used in critical systems. Automotive follows with rapid use of X-ray tools for EV battery modules, power electronics, and high-precision components. Oil & Gas applies X-ray systems for pipeline integrity and pressure equipment checks, driven by safety codes. Power Generation depends on advanced inspection for turbine blades and critical infrastructure. Manufacturing & Fabrication expands use across cast metals, electronics hardware, and complex assemblies that require reliable defect detection.
- For instance, all aircraft turbine blades undergo mandatory fluorescent liquid penetrant testing on exterior surfaces, radiographic inspection of interior structure, and visual inspection, with advanced methods such as Laue X-ray diffraction and ultrasonic inspection performed during manufacturing stages to ensure defect-free aerospace-grade components.
End User Segment Analysis
Inspection & Quality Assurance firms hold a central role, offering third-party validation for regulated industries and high-risk components. Industrial Manufacturing Companies drive steady demand through investment in inline and near-line X-ray systems that improve reliability and reduce defect escape. Government & Regulatory Bodies influence adoption through national safety codes, defense standards, and certification programs. The end-user ecosystem supports strong compliance, rapid product cycles, and rigorous quality rules across South Korea’s industrial landscape.
Segmentation:
Technology Segments
- Digital Radiography (DR)
- Computed Radiography (CR)
- Conventional Film Radiography
Application Segments
- Aerospace & Defense
- Automotive
- Oil & Gas
- Power Generation
- Manufacturing & Fabrication
End User Segments
- Inspection & Quality Assurance Firms
- Industrial Manufacturing Companies
- Government & Regulatory Bodies
Regional Analysis:
Seoul Capital Region
The South Korea X-RAY NDT Market holds its largest concentration in the Seoul Capital Region with an estimated 52% share. The region leads due to dense clusters of semiconductor fabs, battery plants, aerospace suppliers, and advanced electronics firms. It benefits from high investments in digital radiography systems driven by fast production cycles and strict global compliance rules. Government-certified labs and quality agencies in Seoul further support stronger adoption of X-ray inspection. The region maintains a robust ecosystem of service providers that supply inspection, calibration, and maintenance support. It strengthens demand for high-resolution imaging tools used in EV modules, micro-joints, and precision metal parts. Strong innovation pipelines keep the region dominant across local and export-focused industries.
Southeastern Industrial Belt (Busan, Ulsan, Daegu)
The Southeastern Belt secures 32% market share, driven by heavy industries, shipyards, petrochemical zones, and automotive hubs. Busan and Ulsan create strong demand for film radiography and digital systems used in weld testing, casting validation, and pressure equipment checks. Daegu’s emerging automation base increases interest in computed radiography for mid-range manufacturing lines. The belt relies on X-ray NDT for safety-critical infrastructure across refineries, storage tanks, and high-load machinery. It maintains steady growth due to regional expansion of EV parts, industrial components, and marine structures. It gains traction from compliance requirements tied to global shipbuilding codes and national pressure equipment standards. Strong industrial diversity supports a balanced mix of technology adoption.
Southwest & Central Region (Gwangju, Daejeon, Chungcheong)
The Southwest and Central areas account for 20% market share, supported by research hubs, government agencies, and precision engineering clusters. Gwangju’s manufacturing base uses X-ray inspection for automotive parts and electronics hardware. Daejeon's research institutes and defense-linked units influence higher use of advanced radiography for prototype evaluation and material analysis. Chungcheong’s industrial parks expand adoption across machinery, tooling, and fabrication lines. The region benefits from rising investment in quality assurance for mid-scale manufacturing plants. It supports broader use of inspection services operated by accredited testing centers. It strengthens national coverage by supplying NDT capacity to small and medium industries spread across central South Korea.
Key Player Analysis:
- Korea Testing Laboratory (KTL)
- Korea NDT Co., Ltd.
- Samil NDT
- Korea Institute of Machinery & Materials (KIMM)
- Hyundai WIA
- APN Co., Ltd.
- SGS SA
- NDT Engineering & Aerospace Co., Ltd.
- SITCO
- Other Key Players
Competitive Analysis:
The South Korea X-RAY NDT Market features strong competition led by domestic manufacturers, accredited labs, and global inspection firms. Leading players invest in digital radiography, automated scanning tools, and advanced material evaluation to strengthen performance across high-tech sectors. It maintains competitive depth through a mix of technology developers, equipment distributors, and quality assurance providers located near major industrial hubs. Companies work to improve accuracy, speed, and compliance support to serve semiconductor, automotive, and defense applications. Local firms benefit from close links with research institutes, which helps them secure early access to emerging technologies. Global participants focus on premium systems that offer sharper imaging and wider integration with automated production lines. The landscape reflects active upgrades, steady innovation, and rising demand for high-resolution inspection systems.
Recent Developments:
- In January 2025, SGS SA entered a strategic partnership with India‑based Thermax to deliver enhanced industrial energy‑efficiency and climate‑change consulting services, combining SGS’s global TIC network of more than 2,700 laboratories and facilities with Thermax’s digital tools and utilities expertise. Announced on January 1, 2025, the collaboration focuses on detailed energy audits, real‑time monitoring and analytics for energy‑intensive plants, allowing refineries, chemical complexes and power producers to optimize specific energy consumption and decarbonization programs; these assets already depend heavily on radiographic and X‑ray NDT for pressure equipment, piping and structural integrity, so the tie‑up indirectly reinforces SGS’s role as a comprehensive inspection and advisory partner for Korean and global industrial clients.
- In February 2024, the Korea Institute of Machinery & Materials (KIMM) announced that a joint KIMM–Seoul National University research team had developed a new elastic metamaterial that perfectly converts linear ultrasonic waves into circularly polarized ultrasonic waves, enabling detection of cracks that form in arbitrary directions inside large structures such as buildings, bridges and aircraft. The study, published in Nature Communicationson February 12, 2024 under the title “Perfect Circular Polarization of Elastic Waves in Solid Media,” is positioned for use in ultrasonic non‑destructive defect diagnosis, offering higher crack detection coverage and sensitivity compared with conventional guided‑wave methods and providing a complementary technology path to radiographic and X‑ray NDT in critical infrastructure and aerospace components.
Report Coverage:
The research report offers an in-depth analysis based on Technology, Application, and End User segments. It details leading market players, providing an overview of their business, product offerings, investments, revenue streams, and key applications. Additionally, the report includes insights into the competitive environment, SWOT analysis, current market trends, as well as the primary drivers and constraints. Furthermore, it discusses various factors that have driven market expansion in recent years. The report also explores market dynamics, regulatory scenarios, and technological advancements that are shaping the industry. It assesses the impact of external factors and global economic changes on market growth. Lastly, it provides strategic recommendations for new entrants and established companies to navigate the complexities of the market.
Future Outlook:
- Adoption of digital radiography will accelerate due to stronger demand for faster inspection cycles.
- Semiconductor and EV battery production will shape new needs for high-resolution imaging.
- Inline X-ray systems will gain importance in automated factories seeking tighter quality control.
- Aerospace suppliers will invest in advanced CT tools to support stricter global certification rules.
- Shipbuilding hubs will upgrade weld inspection workflows to meet rising safety requirements.
- Cloud-linked inspection platforms will expand usage of data analytics in defect detection.
- Service providers will build capacity for heavy-industry projects across power and petrochemical sectors.
- National R&D programs will support technology upgrades for next-generation radiographic tools.
- Vendors will strengthen after-sales support to improve uptime in high-throughput facilities.
- Regional demand will rise as more mid-sized manufacturers adopt modern NDT systems for export readiness.
Request a Free Sample
Fill in your details and we'll send you a free sample report.
- Sample data tables & charts
- Research methodology
Need a Custom Version of This Report?
Tailor the scope, geography, or segments to your exact requirements.
- Custom geography or segment scope
- Direct access to our analyst team
Frequently Asked Questions
What is the current market size for the South Korea X-RAY NDT Market, and what is its projected size in 2032?
At what Compound Annual Growth Rate is the South Korea X-RAY NDT Market projected to grow between 2024 and 2032?
Which South Korea X-RAY NDT Market segment held the largest share in 2024?
What are the primary factors fueling the growth of the South Korea X-RAY NDT Market?
Who are the leading companies in the South Korea X-RAY NDT Market?
Which region commanded the largest share of the South Korea X-RAY NDT Market in 2024?
Table of Content
Chapter 1. Report Introduction
- 1.1 Report Description & Purpose
- 1.1.1 Report Title & Market Definition
- 1.1.2 Unique Selling Propositions (USP) & Key Differentiators
- 1.1.3 Value Proposition for Stakeholders
- 1.2 Research Objectives
- 1.2.1 Market Sizing Objectives (Volume & Revenue)
- 1.2.2 Segmentation Objectives
- 1.2.3 Competitive Intelligence Objectives
- 1.2.4 Forecast & Scenario Objectives
- 1.3 Report Scope
- 1.3.1 South Korea X-RAY NDT Scope – Types & Subtypes Covered
- 1.3.2 Geographic Scope – Regions & Countries Covered
- 1.3.3 Historical Period, Base Year & Forecast Period (2024; forecast to 2032)
- 1.3.4 Inclusions & Exclusions
- 1.4 HS Code & Classification Framework
- 1.5 Currency, Units & Pricing Basis
- 1.6 Target Stakeholders
- 1.7 Limitations & Assumptions
Chapter 2. Executive Summary
- 2.1 Global South Korea X-RAY NDT Market Snapshot
- 2.1.1 Market Size – Historical (2024) & Forecast (2024-2032) (2024: USD 460.4 million → 2032: USD 687 million)
- 2.1.2 Volume & Revenue – Global Totals
- 2.1.3 Key Market Highlights – Top Five Facts
- 2.2 South Korea X-RAY NDT Market Segmentation Snapshot
- 2.2.1 Market Split by Region – 2024 vs. 2032
- 2.3 Competitive Snapshot
- 2.3.1 Top 10 Players by Revenue Share – 2024
- 2.3.2 Top 10 Players by Volume Share – 2024
- 2.3.3 Recent Strategic Developments (18-Month Summary)
- 2.4 Key Investment Highlights & Strategic Conclusions
Chapter 3. South Korea X-RAY NDT Market Dynamics & Industry Analysis
- 3.1 Market Overview & Context
- 3.1.1 South Korea X-RAY NDT Market Position in the Broader Automotive Value Chain
- 3.1.2 OEM vs. Replacement Market Dynamics
- 3.1.3 Market Maturity & Development Stage by Region
- 3.2 South Korea X-RAY NDT Market Drivers
- 3.3 South Korea X-RAY NDT Market Restraints & Challenges
- 3.4 South Korea X-RAY NDT Market Opportunities
- 3.5 Porter's Five Forces Analysis
- 3.5.1 Threat of New Entrants
- 3.5.2 Bargaining Power of Suppliers
- 3.5.3 Bargaining Power of Buyers
- 3.5.4 Threat of Substitutes
- 3.5.5 Competitive Rivalry – Intensity Assessment
- 3.6 South Korea X-RAY NDT Value Chain Analysis
- 3.6.1 Upstream – Raw Material/Input Suppliers
- 3.6.1.1 Raw Material/Input 1
- 3.6.1.2 Raw Material/Input 2
- 3.6.1.3 Raw Material/Input 3
- 3.6.2 Midstream – Production/Manufacturing/Service Delivery
- 3.6.2.1 Production/Process Overview
- 3.6.2.2 Key Facility Locations & Capacity by Manufacturer
- 3.6.3 Downstream – Distribution & End Consumer
- 3.6.3.1 Primary Channel – B2B/OEM
- 3.6.3.2 Secondary Channels – Dealer, Retail, Online, Direct
- 3.6.4 Value Chain Profitability Analysis
- 3.6.1 Upstream – Raw Material/Input Suppliers
- 3.7 PESTEL Analysis
- 3.7.1 Political Factors
- 3.7.2 Economic Factors
- 3.7.3 Social Factors
- 3.7.4 Technological Factors
- 3.7.5 Environmental Factors
- 3.7.6 Legal Factors
- 3.8 South Korea X-RAY NDT Supply Chain Analysis
- 3.8.1 Raw Material/Input Supply Risk Assessment
- 3.8.2 Manufacturing Concentration Risk (Geographic Exposure)
- 3.8.3 Trade Disruption Impact Analysis
- 3.9 Regulatory & Policy Landscape
Note: The regulatory and policy landscape section covers regulations based on their applicability to the market, South Korea X-RAY NDT category, geography, and scope of the study. Only regulatory frameworks with a material impact on operations, compliance, trade, sustainability, or market access are analyzed in detail.
Chapter 4. Key Investment Pockets & Opportunity Analysis
- 4.1 South Korea X-RAY NDT Market Attractiveness Analysis
- 4.1.1 By Region – Investment Attractiveness Matrix (Volume × CAGR)
- 4.2 Absolute Revenue Growth Opportunity
- 4.2.1 By Region – Absolute USD Growth Through 2032
- 4.3 Incremental Volume Opportunity
- 4.3.1 By Region – Incremental Volume Through 2032
- 4.3.2 Segment – Incremental Volume
- 4.4 Emerging Submarket Opportunity Deep Dive (Subject to Applicability)
- 4.5 Emerging Market Opportunity Scorecards
- 4.5.1 United States
- 4.5.2 Europe
- 4.5.3 Asia
- 4.5.4 Middle East & Africa
Note: Emerging Market Opportunity Scorecards will be included based on relevance and strategic importance. Regions listed are indicative and may vary depending on data availability and market dynamics.
Chapter 5. South Korea X-RAY NDT Import-Export Analysis & Trade Flows
- 5.1 Global Trade Overview
- 5.1.1 Global Export Value by Country (2024)
- 5.1.2 Global Export Volume by Country (2024)
- 5.1.3 Global Import Value by Country (2024)
- 5.1.4 Global Import Volume by Country (2024)
- 5.1.5 Net Trade Balance by Country (2024)
- 5.2 Export Analysis – Segment
- 5.2.1 Type 1 (HS Code)
- 5.2.2 Type 2 (HS Code)
- 5.2.3 Type 3 (HS Code)
- 5.2.4 Type 4 (HS Code)
- 5.2.5 Type 5 (HS Code)
- 5.3 Import Analysis – Segment
- 5.3.1 Type 1 (HS Code)
- 5.3.2 Type 2 (HS Code)
- 5.3.3 Type 3 (HS Code)
- 5.3.4 Type 4 (HS Code)
- 5.3.5 Type 5 (HS Code)
- 5.4 Average Unit Trade Prices
- 5.4.1 Average Export Price – Segment & Country
- 5.4.2 Average Import Price – Segment & Source Country
- 5.4.3 Price Trends (2024)
- 5.5 Key Trade Route Analysis
- 5.5.1 Trade Route 1
- 5.5.2 Trade Route 2
- 5.5.3 Trade Route 3
- 5.5.4 Trade Route 4
- 5.5.5 Trade Route 5
- 5.6 Trade Policy Impact Assessment
- 5.6.1 US Anti-Dumping & Section 301 Tariffs
- 5.6.2 EU Customs Union Impact
- 5.6.3 Major Free Trade Agreements
- 5.6.4 USMCA Rules of Origin
Note: Trade policy analysis will be included only where relevant to the South Korea X-RAY NDT market.
Chapter 6. Competitive Landscape & Company Benchmarking
- 6.1 South Korea X-RAY NDT Market Concentration & Structure
- 6.1.1 Herfindahl-Hirschman Index (HHI) – vs. 2024
- 6.1.2 Tier 1, Tier 2 & Tier 3 Market Structure
- 6.1.3 Global, Regional & Local Player Dynamics
- 6.2 South Korea X-RAY NDT Market Share Analysis – 2024
- 6.2.1 Global Revenue Share by Company
- 6.2.2 Global Volume Share by Company
- 6.2.3 Regional Revenue Share
- 6.2.4 Market Share Evolution ( vs. 2024)
- 6.2.5 OEM Segment Share by Company
- 6.2.6 Replacement Segment Share by Company
- 6.3 Production/Delivery Capacity & Facility Analysis
- 6.3.1 Global Installed Capacity
- 6.3.2 Capacity Utilization Rates
- 6.3.3 Production/Output Volume
- 6.3.4 Facility Locations & Capacity Map
- 6.3.5 Planned Capacity Additions
- 6.4 South Korea X-RAY NDT Competitive Benchmarking Matrix
- 6.4.1 Revenue, Volume, CAGR & Profitability Comparison
- 6.4.2 Channel Revenue Mix
- 6.4.3 Geographic Revenue Exposure
- 6.4.4 R&D Intensity
- 6.4.5 Sustainability Maturity
- 6.5 Strategic Developments in South Korea X-RAY NDT (Last 24 Months)
- 6.5.1 Mergers, Acquisitions & Divestments
- 6.5.2 New South Korea X-RAY NDT Launches
- 6.5.3 Facility Expansions
- 6.5.4 Strategic Alliances, Joint Ventures & Partnerships
- 6.5.5 Distribution Expansion & Market Entry
- 6.5.6 Sustainability & ESG Initiatives
- 6.6 Competitive Strategy Mapping
- 6.6.1 Leader, Challenger, Follower & Niche Classification
- 6.6.2 Pricing Strategy Comparison
- 6.6.3 Channel Strategy Matrix
Note: Strategic developments are included based on their materiality and the availability of reliable information.
Chapter 7. Global South Korea X-RAY NDT Market – By Distribution Channel
- 7.1 Segment Overview
- 7.1.1 Volume & Revenue Split by Channel (2024 & 2032)
- 7.1.2 Channel Mix Evolution (2024-2032)
Chapter 8. Regional Market Analysis – Global Overview
- 8.1 Global Regional Overview
- 8.1.1 Regional Volume Share
- 8.1.2 Regional Revenue Share
- 8.1.3 Regional Volume by Region
- 8.1.4 Regional Revenue by Region
- 8.1.5 Regional Forecast Through 2032
- 8.2 Cross-Regional Segment Analysis
- 8.2.1 By Distribution Channel
- 8.2.2 By Brand/Price Tier
Chapter 9. North America South Korea X-RAY NDT Market
- 9.1 United States
- 9.2 Canada
- 9.3 Mexico
Chapter 10. Europe South Korea X-RAY NDT Market
- 10.1 Germany
- 10.2 France
- 10.3 Italy
- 10.4 United Kingdom
- 10.5 Spain
- 10.6 Poland
- 10.7 Russia
- 10.8 Netherlands
- 10.9 Belgium
- 10.10 Sweden
- 10.11 Denmark
- 10.12 Norway
- 10.13 Rest of Europe
Chapter 11. Asia Pacific South Korea X-RAY NDT Market
- 11.1 China
- 11.2 India
- 11.3 Japan
- 11.4 South Korea
- 11.5 Thailand
- 11.6 Indonesia
- 11.7 Vietnam
- 11.8 Malaysia
- 11.9 Australia
- 11.10 Rest of Asia Pacific
Chapter 12. Latin America South Korea X-RAY NDT Market
- 12.1 Brazil
- 12.2 Argentina
- 12.3 Colombia
- 12.4 Chile
- 12.5 Rest of Latin America
Chapter 13. Middle East South Korea X-RAY NDT Market
- 13.1 Saudi Arabia
- 13.2 United Arab Emirates
- 13.3 Turkey
- 13.4 Israel
- 13.5 Iran
- 13.6 Rest of the Middle East
Chapter 14. Africa South Korea X-RAY NDT Market
- 14.1 South Africa
- 14.2 Egypt
- 14.3 Nigeria
- 14.4 Morocco
- 14.5 Rest of Africa
Chapter 15. South Korea X-RAY NDT Company Profiles
- 15.1 [Company 01]
- 15.1.1 Company Overview
- 15.1.2 Key Management Personnel
- 15.1.3 Products & Services Portfolio
- 15.1.4 Financial Performance
- 15.1.5 Key Market Focus & Geographic Presence
- 15.1.6 Recent Developments & Strategic Initiatives
Note: The company profile list is preliminary and may change based on research findings, market developments, data availability, and client requirements.
Chapter 16. Appendices
- Appendix A – List of Abbreviations & Acronyms
- Appendix B – Industry Classification Code Reference – Full Series
- Appendix C – Production & Capacity Data Tables
- Appendix D – End-Use & Demand Base Tables
- Appendix E – Consumption & Replacement Rate Assumptions
- Appendix F – ASP Reference Tables
- Appendix G – Manufacturing & Facility Database
- Appendix H – Import-Export Data Tables
- Appendix I – Regulatory Summary Tables
- Appendix J – Primary Research Participant List (Anonymized)
- Appendix K – Primary Research Questionnaire Framework
- Appendix L – Data Sources & Bibliography
- Appendix M – Market Size Divergence & Source Comparison
Chapter 17. Research Methodology
- 17.1 Research Framework & Philosophy
- 17.2 Secondary Research – Sources, Hierarchy & Data Extraction
- 17.3 Data Modeling – Bottom-Up & Top-Down Market Sizing
- 17.4 Primary Research – Stakeholder Framework, LOI & Sample Sizes
- 17.5 Forecast Methodology – Regression, Scenario & Sensitivity Analysis
- 17.6 Quality Control – Four-Layer Validation Framework
- 17.7 Limitations & Standard Assumptions
- 17.8 Disclaimer
