
Market Overview
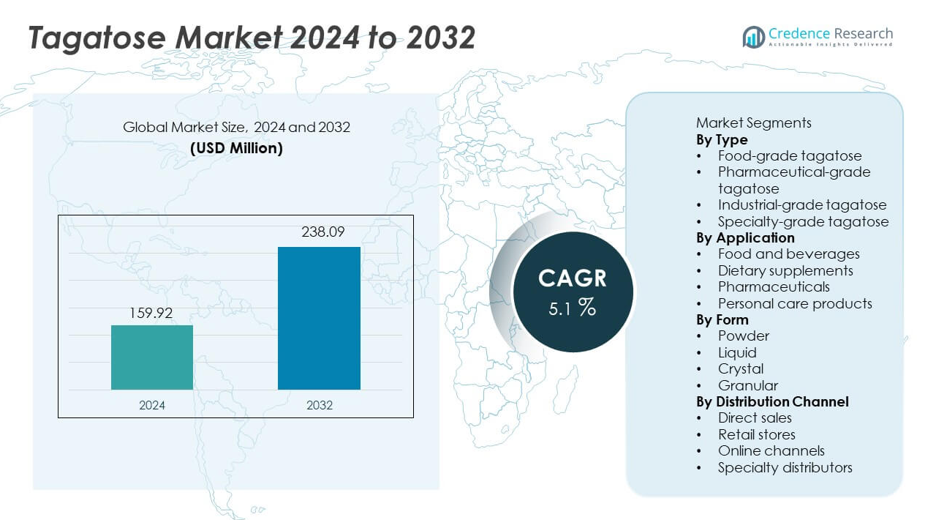
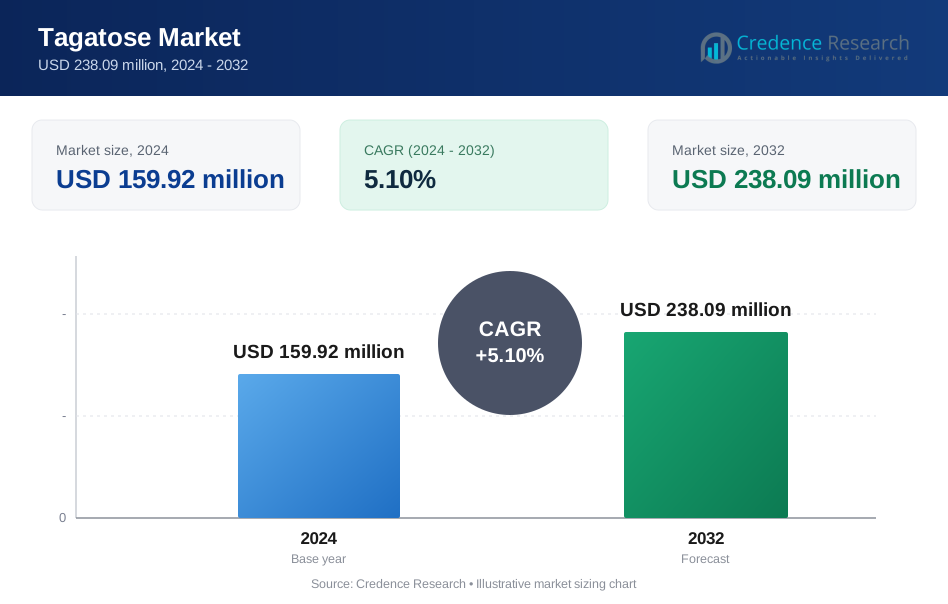
Tagatose market size was valued at USD 159.92 million in 2024 and is projected to reach USD 238.09 million by 2032, registering a CAGR of 5.1% during the forecast period.
| REPORT ATTRIBUTE | DETAILS |
|---|---|
| Historical Period | 2020-2023 |
| Base Year | 2024 |
| Forecast Period | 2025-2032 |
| Tagatose market Size 2024 | USD 159.92 million |
| Tagatose market, CAGR | 5.1% |
| Tagatose market Size 2032 | USD 238.09 million |
The top players in the Tagatose market include Bonumose Inc., CJ CheilJedang Corporation, Nutrilab NV, Ingredion Incorporated, Manus Bio, Südzucker AG, Tate & Lyle PLC, FrieslandCampina Ingredients, Arla Foods Ingredients, and Sigma Aldrich (Merck Group). These companies strengthen the market through innovations in enzymatic production, expanded commercial-scale manufacturing, and partnerships with food and nutraceutical brands seeking natural, low-calorie sweeteners. North America leads the market with a 36% share, driven by strong demand for clean-label and diabetic-friendly products. Europe follows with a 32% share, supported by strict sugar-reduction regulations, while Asia Pacific holds a 24% share, driven by rising health awareness and rapid growth in functional food applications.
Market Insights
- The Tagatose market reached USD 159.92 million in 2024 and will grow at a CAGR of 5.1 percent through 2032.
- Rising demand for low-calorie and low-glycemic sweeteners drives adoption, with food-grade tagatose holding a 58 percent share due to its use in bakery, beverages, and confectionery.
- Clean-label and natural ingredient trends support wider use of tagatose in functional foods, dietary supplements, and personal care products.
- Leading players enhance competitiveness by improving production efficiency, scaling fermentation technologies, and expanding partnerships with major food manufacturers.
- North America leads with a 36 percent share, followed by Europe at 32 percent and Asia Pacific at 24 percent, supported by strong sugar-reduction initiatives, rising health awareness, and growing demand for natural sweetener alternatives across key consumer markets.
Market Segmentation Analysis:
By Type
Food-grade tagatose dominates this segment with a 58% share, driven by rising demand for low-calorie sweeteners in bakery, dairy, and confectionery products. Manufacturers adopt food-grade tagatose as a sugar alternative due to its low glycemic index and favorable taste profile. Pharmaceutical-grade variants expand steadily as tagatose supports prebiotic formulations and diabetic-friendly products. Industrial-grade and specialty-grade tagatose grow as niche sectors explore its use in fermentation processes and functional ingredient development. Increasing consumer shift toward healthier sugar substitutes strengthens overall segment demand.
- For instance, Bonumose operates a continuous bioprocessing platform producing food-grade tagatose from abundant, plant-based feedstocks. The company has a patented process that is a cost-effective and scalable enzymatic method, which yields high purity.
By Application
Food and beverages lead with a 62% share, supported by growing adoption of tagatose in chocolates, beverages, ice creams, and baked goods due to its similar sweetness profile to sucrose and reduced caloric content. Dietary supplements also grow as tagatose supports gut health and weight management formulations. Pharmaceutical applications increase with its benefits in diabetic-friendly products and low-impact glucose regulation. Personal care products use tagatose in moisturizing and skin-conditioning formulations. Rising preference for natural sweeteners fuels expansion across applications.
- For instance, Ingredion tested tagatose in chocolate and dairy systems, achieving sweetness equivalence at 0.92 sweetness intensity versus sucrose. FrieslandCampina Ingredients validated tagatose stability across pH 3.5 to 7.0 in liquid nutrition and beverage prototypes.
By Form
Powder form holds a 49% share, driven by its wide use in food manufacturing, easy blending properties, and strong stability in dry formulations. Powdered tagatose is preferred in bakery mixes, supplements, and confectionery products due to consistent performance. Liquid form grows steadily as beverage producers adopt tagatose for low-calorie drink formulations. Crystal and granular forms gain traction in tabletop sweeteners and functional food products. Increasing use of tagatose in processed foods and specialty nutrition supports growth across all formats.
Key Growth Drivers
Rising Demand for Low-Calorie and Low-Glycemic Sweeteners
Consumers seek healthier sugar alternatives, driving strong demand for tagatose due to its low-calorie content and minimal impact on blood glucose levels. Food manufacturers incorporate tagatose into bakery items, beverages, and confectionery products to meet growing interest in diabetes-friendly and weight-management diets. Increased awareness of metabolic health encourages adoption across global markets. Regulatory support for natural sweeteners further boosts usage in packaged foods. This shift toward health-focused consumption plays a key role in expanding tagatose adoption.
- For instance, Tate & Lyle validated tagatose in baked goods with a measured glycemic response of 3 on standardized glucose testing. CJ CheilJedang demonstrated tagatose stability at baking temperatures up to 180°C across multiple product trials.
Growing Use in Functional and Nutraceutical Products
Tagatose gains traction in dietary supplements and functional foods due to its prebiotic properties and gut-health benefits. Manufacturers integrate tagatose into fiber blends, probiotic formulations, and digestive wellness products. Its compatibility with nutraceutical ingredients supports product diversification in wellness categories. Rising consumer interest in digestive health and immunity drives new formulation development. The expanding nutraceutical industry strengthens long-term demand for high-quality sweetener alternatives like tagatose.
- For instance, Nutrilab NV incorporated tagatose into synbiotic formulations supporting over 1×10⁹ CFU probiotic viability after 24 months of shelf testing. Arla Foods Ingredients confirmed tagatose solubility above 600 g/L in liquid nutrition blends used for digestive health applications.
Expansion Across Pharmaceutical and Personal Care Applications
Pharmaceutical companies use tagatose in diabetic-friendly formulations and oral care products due to its low cariogenic effect and favorable sweetness profile. It also supports controlled-release compositions and therapeutic blends. Personal care brands adopt tagatose for moisturizing and skin-conditioning benefits. Growing research exploring new biomedical uses expands application potential. Rising investment in sugar alternatives across pharma and cosmetics sectors reinforces market growth.
Key Trends & Opportunities
Shift Toward Natural and Clean-Label Sweetener Solutions
Consumers show strong preference for natural, non-artificial sweeteners, creating opportunities for tagatose due to its natural origin and clean-label acceptance. Food and beverage companies reformulate products to replace synthetic sweeteners with plant-derived alternatives. This trend expands opportunities in premium, organic, and health-focused categories. Rising demand for natural ingredients in beverages, snacks, and lifestyle nutrition products supports broader adoption. Clean-label positioning strengthens market penetration across global regions.
- For instance, the general production of tagatose is achieved through enzymatic conversion. Reputable chemical suppliers provide analytical-grade tagatose for research purposes, confirming its established molecular weight.
Increasing Adoption in Low-Calorie Product Innovation
Growing interest in low-calorie and sugar-reduced foods drives innovation in formulations that incorporate tagatose for improved taste and functionality. Manufacturers explore tagatose in energy bars, dairy alternatives, frozen desserts, and ready-to-drink beverages. Opportunities expand as companies seek sweeteners with better stability, browning performance, and mouthfeel. Advancements in production technology reduce costs and support wider product development. Rising demand for premium low-sugar products fuels new market opportunities.
- For instance, Manus Bio developed a fermentation-based process for tagatose intermediates used in low-sugar formulations. Tagatose has been shown to be stable across typical thermal processing conditions, with minimal degradation during storage at typical refrigerated and ambient temperatures in beverages, including milk and dairy-alternative prototypes.
Key Challenges
High Production Costs and Limited Commercial-Scale Manufacturing
Tagatose production remains cost-intensive due to complex processing steps and reliance on advanced enzymatic technologies. Limited manufacturing capacity restricts large-scale availability and affects pricing stability. High production costs hinder adoption in price-sensitive markets, slowing penetration into mass-market food categories. Companies face challenges in scaling up efficient production to meet rising global demand. Investment in new technologies is required to improve yield and reduce costs.
Regulatory and Formulation Challenges in Certain Applications
Although tagatose is approved in many regions, regulatory variations affect its adoption in global markets. Formulation challenges arise due to its unique melting and browning characteristics, which may require adjustments in baking and confectionery processes. Some manufacturers face compatibility issues with specific ingredients in beverages or supplements. These hurdles slow product development timelines and increase reformulation costs. Overcoming regulatory and technical barriers remains essential for broader market expansion.
Regional Analysis
North America
North America holds a 36% share, driven by strong demand for low-calorie sweeteners and rising adoption of clean-label ingredients in food and beverage products. The region benefits from high consumer awareness of metabolic health, increasing interest in diabetic-friendly foods, and rapid growth of functional nutrition brands. Manufacturers integrate tagatose into snacks, beverages, and dietary supplements as they reformulate products to reduce sugar levels. Supportive regulatory frameworks and innovations in sweetener technology further strengthen market expansion. Widespread acceptance of natural alternatives continues to drive steady growth across the region.
Europe
Europe accounts for a 32% share, supported by strict regulations on sugar reduction, rising health consciousness, and strong demand for natural sweeteners. Food companies widely adopt tagatose in confectionery, bakery, and dairy categories to meet lower-sugar formulation requirements. The region’s mature functional food market encourages the use of tagatose in nutraceuticals and digestive wellness products. Growing consumer preference for clean-label and plant-derived ingredients strengthens adoption. Ongoing product innovation and sustainability-focused manufacturing practices further support market development across major European economies.
Asia Pacific
Asia Pacific holds a 24% share, fueled by rising incidences of diabetes and obesity, increasing consumer focus on healthier diets, and rapid growth of the packaged food industry. Demand for tagatose rises in beverages, dairy alternatives, and functional snacks as manufacturers seek natural sweeteners with low glycemic impact. Expanding middle-class populations and growing awareness of nutritional benefits contribute to wider acceptance. The region also benefits from expanding nutraceutical production and greater investment in sugar-reduction technologies. Urbanization and lifestyle shifts continue to strengthen long-term demand.
Latin America
Latin America captures a 5% share, driven by gradual adoption of reduced-sugar foods and beverages and rising awareness of healthier sweetener alternatives. Countries experience growing demand for low-calorie products due to increasing obesity and diabetes rates. Food manufacturers introduce tagatose-based formulations in confectionery and bakery categories to align with shifting consumer preferences. However, high production costs and limited local manufacturing capacity restrain faster adoption. Partnerships with international suppliers and expanding health-focused product lines support moderate market growth across the region.
Middle East & Africa
The Middle East & Africa region holds a 3% share, supported by rising interest in functional foods, increasing prevalence of lifestyle diseases, and growing demand for natural sweeteners in premium product categories. Adoption expands mainly in urban markets where consumers favor low-sugar and diabetic-friendly options. Food and beverage brands use tagatose in energy bars, dairy drinks, and confectionery products. Limited manufacturing infrastructure and higher import dependency slow broader market penetration. Nonetheless, expanding health awareness and rising investments in food innovation create steady long-term opportunities.
Market Segmentations:
By Type
- Food-grade tagatose
- Pharmaceutical-grade tagatose
- Industrial-grade tagatose
- Specialty-grade tagatose
By Application
- Food and beverages
- Dietary supplements
- Pharmaceuticals
- Personal care products
By Form
- Powder
- Liquid
- Crystal
- Granular
By Distribution Channel
- Direct sales
- Retail stores
- Online channels
- Specialty distributors
By Geography
- North America
- U.S.
- Canada
- Mexico
- Europe
- Germany
- France
- U.K.
- Italy
- Spain
- Rest of Europe
- Asia Pacific
- China
- Japan
- India
- South Korea
- South-east Asia
- Rest of Asia Pacific
- Latin America
- Brazil
- Argentina
- Rest of Latin America
- Middle East & Africa
- GCC Countries
- South Africa
- Rest of the Middle East and Africa
Competitive Landscape
The Tagatose market is shaped by key players such as Bonumose Inc., CJ CheilJedang Corporation, Nutrilab NV, Ingredion Incorporated, Manus Bio, Südzucker AG, Tate & Lyle PLC, FrieslandCampina Ingredients, Arla Foods Ingredients, and Sigma Aldrich (Merck Group). These companies compete by advancing production technologies, improving fermentation efficiency, and expanding supply capabilities to meet rising demand for low-calorie sweeteners. Many players focus on scaling up cost-effective manufacturing to address high production barriers associated with tagatose. Strategic partnerships with food and beverage companies support broader adoption in confectionery, dairy, and functional food applications. Firms also invest in R&D to enhance purity, stability, and performance in various formulations. Expansion into nutraceuticals and clean-label product categories further strengthens competitive positioning. As health-conscious consumers seek natural sugar alternatives, companies emphasize sustainable production, regulatory compliance, and global distribution to capture growing market opportunities.
Key Player Analysis
- Bonumose Inc.
- CJ CheilJedang Corporation
- Nutrilab NV
- Ingredion Incorporated
- Manus Bio
- Südzucker AG
- Tate & Lyle PLC
- FrieslandCampina Ingredients
- Arla Foods Ingredients
- Sigma Aldrich (Merck Group)
Recent Developments
- In 2025, CJ CheilJedang remained a major industrial producer of D-tagatose with annual capacity exceeding 3000 tons.
- In August 2024, the U.S. District Court for the District of Columbia issued a significant preliminary court victory for Bonumose in its legal challenge against the FDA's tagatose labeling rules.
- In March 2024, Bonumose Inc. tagatose earned the NutraStrong™ Prebiotic Verified certification.
Report Coverage
The research report offers an in-depth analysis based on Type, Application, Form, Distribution Channel and Geography. It details leading market players, providing an overview of their business, product offerings, investments, revenue streams, and key applications. Additionally, the report includes insights into the competitive environment, SWOT analysis, current market trends, as well as the primary drivers and constraints. Furthermore, it discusses various factors that have driven market expansion in recent years. The report also explores market dynamics, regulatory scenarios, and technological advancements that are shaping the industry. It assesses the impact of external factors and global economic changes on market growth. Lastly, it provides strategic recommendations for new entrants and established companies to navigate the complexities of the market.
Future Outlook
- Demand for natural low-calorie sweeteners will rise as consumers reduce sugar intake.
- Food and beverage manufacturers will expand tagatose use in bakery, dairy, and confectionery products.
- Functional food brands will adopt tagatose for its prebiotic and gut-health benefits.
- Advances in fermentation and enzymatic production will lower manufacturing costs.
- Clean-label trends will strengthen adoption across premium and organic product categories.
- Pharmaceutical applications will grow as tagatose supports diabetic-friendly formulations.
- Personal care brands will use tagatose for moisturizing and skin-conditioning properties.
- Partnerships between ingredient suppliers and food producers will accelerate global availability.
- Regulatory approvals in additional countries will expand market reach.
- Rising interest in sugar-reduction strategies will drive new product innovation across sectors.
Request a Free Sample
Fill in your details and we'll send you a free sample report.
- Sample data tables & charts
- Research methodology
Need a Custom Version of This Report?
Tailor the scope, geography, or segments to your exact requirements.
- Custom geography or segment scope
- Direct access to our analyst team
Frequently Asked Questions
What is the current market size for the Tagatose market, and what is its projected size in 2032?
At what Compound Annual Growth Rate is the Tagatose market projected to grow between 2024 and 2032?
Which Tagatose market segment held the largest share in 2024?
What are the primary factors fueling the growth of the Tagatose market?
Who are the leading companies in the Tagatose market?
Table of Content
Chapter 1. Report Introduction
- 1.1 Report Description & Purpose
- 1.1.1 Report Title & Market Definition
- 1.1.2 Unique Selling Propositions (USP) & Key Differentiators
- 1.1.3 Value Proposition for Stakeholders
- 1.2 Research Objectives
- 1.2.1 Market Sizing Objectives (Volume & Revenue)
- 1.2.2 Segmentation Objectives
- 1.2.3 Competitive Intelligence Objectives
- 1.2.4 Forecast & Scenario Objectives
- 1.3 Report Scope
- 1.3.1 Tagatose Scope – Types & Subtypes Covered
- 1.3.2 Geographic Scope – Regions & Countries Covered
- 1.3.3 Historical Period, Base Year & Forecast Period (2024; forecast to 2032)
- 1.3.4 Inclusions & Exclusions
- 1.4 HS Code & Classification Framework
- 1.5 Currency, Units & Pricing Basis
- 1.6 Target Stakeholders
- 1.7 Limitations & Assumptions
Chapter 2. Executive Summary
- 2.1 Global Tagatose Market Snapshot
- 2.1.1 Market Size – Historical (2024) & Forecast (2024-2032) (2024: USD 159.92 million → 2032: USD 238.09 million)
- 2.1.2 Volume & Revenue – Global Totals
- 2.1.3 Key Market Highlights – Top Five Facts
- 2.2 Tagatose Market Segmentation Snapshot
- 2.2.1 Market Split by Region – 2024 vs. 2032
- 2.3 Competitive Snapshot
- 2.3.1 Top 10 Players by Revenue Share – 2024
- 2.3.2 Top 10 Players by Volume Share – 2024
- 2.3.3 Recent Strategic Developments (18-Month Summary)
- 2.4 Key Investment Highlights & Strategic Conclusions
Chapter 3. Tagatose Market Dynamics & Industry Analysis
- 3.1 Market Overview & Context
- 3.1.1 Tagatose Market Position in the Broader Automotive Value Chain
- 3.1.2 OEM vs. Replacement Market Dynamics
- 3.1.3 Market Maturity & Development Stage by Region
- 3.2 Tagatose Market Drivers
- 3.3 Tagatose Market Restraints & Challenges
- 3.4 Tagatose Market Opportunities
- 3.5 Porter's Five Forces Analysis
- 3.5.1 Threat of New Entrants
- 3.5.2 Bargaining Power of Suppliers
- 3.5.3 Bargaining Power of Buyers
- 3.5.4 Threat of Substitutes
- 3.5.5 Competitive Rivalry – Intensity Assessment
- 3.6 Tagatose Value Chain Analysis
- 3.6.1 Upstream – Raw Material/Input Suppliers
- 3.6.1.1 Raw Material/Input 1
- 3.6.1.2 Raw Material/Input 2
- 3.6.1.3 Raw Material/Input 3
- 3.6.2 Midstream – Production/Manufacturing/Service Delivery
- 3.6.2.1 Production/Process Overview
- 3.6.2.2 Key Facility Locations & Capacity by Manufacturer
- 3.6.3 Downstream – Distribution & End Consumer
- 3.6.3.1 Primary Channel – B2B/OEM
- 3.6.3.2 Secondary Channels – Dealer, Retail, Online, Direct
- 3.6.4 Value Chain Profitability Analysis
- 3.6.1 Upstream – Raw Material/Input Suppliers
- 3.7 PESTEL Analysis
- 3.7.1 Political Factors
- 3.7.2 Economic Factors
- 3.7.3 Social Factors
- 3.7.4 Technological Factors
- 3.7.5 Environmental Factors
- 3.7.6 Legal Factors
- 3.8 Tagatose Supply Chain Analysis
- 3.8.1 Raw Material/Input Supply Risk Assessment
- 3.8.2 Manufacturing Concentration Risk (Geographic Exposure)
- 3.8.3 Trade Disruption Impact Analysis
- 3.9 Regulatory & Policy Landscape
Note: The regulatory and policy landscape section covers regulations based on their applicability to the market, Tagatose category, geography, and scope of the study. Only regulatory frameworks with a material impact on operations, compliance, trade, sustainability, or market access are analyzed in detail.
Chapter 4. Key Investment Pockets & Opportunity Analysis
- 4.1 Tagatose Market Attractiveness Analysis
- 4.1.1 By Region – Investment Attractiveness Matrix (Volume × CAGR)
- 4.2 Absolute Revenue Growth Opportunity
- 4.2.1 By Region – Absolute USD Growth Through 2032
- 4.3 Incremental Volume Opportunity
- 4.3.1 By Region – Incremental Volume Through 2032
- 4.3.2 Segment – Incremental Volume
- 4.4 Emerging Submarket Opportunity Deep Dive (Subject to Applicability)
- 4.5 Emerging Market Opportunity Scorecards
- 4.5.1 United States
- 4.5.2 Europe
- 4.5.3 Asia
- 4.5.4 Middle East & Africa
Note: Emerging Market Opportunity Scorecards will be included based on relevance and strategic importance. Regions listed are indicative and may vary depending on data availability and market dynamics.
Chapter 5. Tagatose Import-Export Analysis & Trade Flows
- 5.1 Global Trade Overview
- 5.1.1 Global Export Value by Country (2024)
- 5.1.2 Global Export Volume by Country (2024)
- 5.1.3 Global Import Value by Country (2024)
- 5.1.4 Global Import Volume by Country (2024)
- 5.1.5 Net Trade Balance by Country (2024)
- 5.2 Export Analysis – Segment
- 5.2.1 Type 1 (HS Code)
- 5.2.2 Type 2 (HS Code)
- 5.2.3 Type 3 (HS Code)
- 5.2.4 Type 4 (HS Code)
- 5.2.5 Type 5 (HS Code)
- 5.3 Import Analysis – Segment
- 5.3.1 Type 1 (HS Code)
- 5.3.2 Type 2 (HS Code)
- 5.3.3 Type 3 (HS Code)
- 5.3.4 Type 4 (HS Code)
- 5.3.5 Type 5 (HS Code)
- 5.4 Average Unit Trade Prices
- 5.4.1 Average Export Price – Segment & Country
- 5.4.2 Average Import Price – Segment & Source Country
- 5.4.3 Price Trends (2024)
- 5.5 Key Trade Route Analysis
- 5.5.1 Trade Route 1
- 5.5.2 Trade Route 2
- 5.5.3 Trade Route 3
- 5.5.4 Trade Route 4
- 5.5.5 Trade Route 5
- 5.6 Trade Policy Impact Assessment
- 5.6.1 US Anti-Dumping & Section 301 Tariffs
- 5.6.2 EU Customs Union Impact
- 5.6.3 Major Free Trade Agreements
- 5.6.4 USMCA Rules of Origin
Note: Trade policy analysis will be included only where relevant to the Tagatose market.
Chapter 6. Competitive Landscape & Company Benchmarking
- 6.1 Tagatose Market Concentration & Structure
- 6.1.1 Herfindahl-Hirschman Index (HHI) – vs. 2024
- 6.1.2 Tier 1, Tier 2 & Tier 3 Market Structure
- 6.1.3 Global, Regional & Local Player Dynamics
- 6.2 Tagatose Market Share Analysis – 2024
- 6.2.1 Global Revenue Share by Company
- 6.2.2 Global Volume Share by Company
- 6.2.3 Regional Revenue Share
- 6.2.4 Market Share Evolution ( vs. 2024)
- 6.2.5 OEM Segment Share by Company
- 6.2.6 Replacement Segment Share by Company
- 6.3 Production/Delivery Capacity & Facility Analysis
- 6.3.1 Global Installed Capacity
- 6.3.2 Capacity Utilization Rates
- 6.3.3 Production/Output Volume
- 6.3.4 Facility Locations & Capacity Map
- 6.3.5 Planned Capacity Additions
- 6.4 Tagatose Competitive Benchmarking Matrix
- 6.4.1 Revenue, Volume, CAGR & Profitability Comparison
- 6.4.2 Channel Revenue Mix
- 6.4.3 Geographic Revenue Exposure
- 6.4.4 R&D Intensity
- 6.4.5 Sustainability Maturity
- 6.5 Strategic Developments in Tagatose (Last 24 Months)
- 6.5.1 Mergers, Acquisitions & Divestments
- 6.5.2 New Tagatose Launches
- 6.5.3 Facility Expansions
- 6.5.4 Strategic Alliances, Joint Ventures & Partnerships
- 6.5.5 Distribution Expansion & Market Entry
- 6.5.6 Sustainability & ESG Initiatives
- 6.6 Competitive Strategy Mapping
- 6.6.1 Leader, Challenger, Follower & Niche Classification
- 6.6.2 Pricing Strategy Comparison
- 6.6.3 Channel Strategy Matrix
Note: Strategic developments are included based on their materiality and the availability of reliable information.
Chapter 7. Global Tagatose Market – By Distribution Channel
- 7.1 Segment Overview
- 7.1.1 Volume & Revenue Split by Channel (2024 & 2032)
- 7.1.2 Channel Mix Evolution (2024-2032)
Chapter 8. Regional Market Analysis – Global Overview
- 8.1 Global Regional Overview
- 8.1.1 Regional Volume Share
- 8.1.2 Regional Revenue Share
- 8.1.3 Regional Volume by Region
- 8.1.4 Regional Revenue by Region
- 8.1.5 Regional Forecast Through 2032
- 8.2 Cross-Regional Segment Analysis
- 8.2.1 By Distribution Channel
- 8.2.2 By Brand/Price Tier
Chapter 9. North America Tagatose Market
- 9.1 United States
- 9.2 Canada
- 9.3 Mexico
Chapter 10. Europe Tagatose Market
- 10.1 Germany
- 10.2 France
- 10.3 Italy
- 10.4 United Kingdom
- 10.5 Spain
- 10.6 Poland
- 10.7 Russia
- 10.8 Netherlands
- 10.9 Belgium
- 10.10 Sweden
- 10.11 Denmark
- 10.12 Norway
- 10.13 Rest of Europe
Chapter 11. Asia Pacific Tagatose Market
- 11.1 China
- 11.2 India
- 11.3 Japan
- 11.4 South Korea
- 11.5 Thailand
- 11.6 Indonesia
- 11.7 Vietnam
- 11.8 Malaysia
- 11.9 Australia
- 11.10 Rest of Asia Pacific
Chapter 12. Latin America Tagatose Market
- 12.1 Brazil
- 12.2 Argentina
- 12.3 Colombia
- 12.4 Chile
- 12.5 Rest of Latin America
Chapter 13. Middle East Tagatose Market
- 13.1 Saudi Arabia
- 13.2 United Arab Emirates
- 13.3 Turkey
- 13.4 Israel
- 13.5 Iran
- 13.6 Rest of the Middle East
Chapter 14. Africa Tagatose Market
- 14.1 South Africa
- 14.2 Egypt
- 14.3 Nigeria
- 14.4 Morocco
- 14.5 Rest of Africa
Chapter 15. Tagatose Company Profiles
- 15.1 [Company 01]
- 15.1.1 Company Overview
- 15.1.2 Key Management Personnel
- 15.1.3 Products & Services Portfolio
- 15.1.4 Financial Performance
- 15.1.5 Key Market Focus & Geographic Presence
- 15.1.6 Recent Developments & Strategic Initiatives
Note: The company profile list is preliminary and may change based on research findings, market developments, data availability, and client requirements.
Chapter 16. Appendices
- Appendix A – List of Abbreviations & Acronyms
- Appendix B – Industry Classification Code Reference – Full Series
- Appendix C – Production & Capacity Data Tables
- Appendix D – End-Use & Demand Base Tables
- Appendix E – Consumption & Replacement Rate Assumptions
- Appendix F – ASP Reference Tables
- Appendix G – Manufacturing & Facility Database
- Appendix H – Import-Export Data Tables
- Appendix I – Regulatory Summary Tables
- Appendix J – Primary Research Participant List (Anonymized)
- Appendix K – Primary Research Questionnaire Framework
- Appendix L – Data Sources & Bibliography
- Appendix M – Market Size Divergence & Source Comparison
Chapter 17. Research Methodology
- 17.1 Research Framework & Philosophy
- 17.2 Secondary Research – Sources, Hierarchy & Data Extraction
- 17.3 Data Modeling – Bottom-Up & Top-Down Market Sizing
- 17.4 Primary Research – Stakeholder Framework, LOI & Sample Sizes
- 17.5 Forecast Methodology – Regression, Scenario & Sensitivity Analysis
- 17.6 Quality Control – Four-Layer Validation Framework
- 17.7 Limitations & Standard Assumptions
- 17.8 Disclaimer
