
Market Overview:
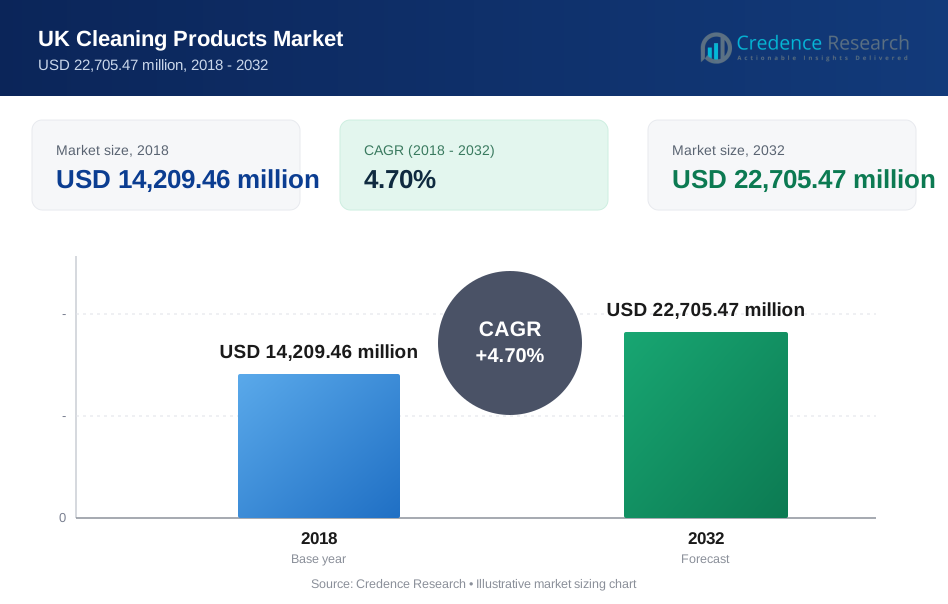
The UK Cleaning Products Market size was valued at USD 14,209.46 million in 2018 to USD 15,725.58 million in 2024 and is anticipated to reach USD 22,705.47 million by 2032, at a CAGR of 4.70% during the forecast period.
| REPORT ATTRIBUTE | DETAILS |
|---|---|
| Historical Period | 2020-2023 |
| Base Year | 2024 |
| Forecast Period | 2025-2032 |
| UK Cleaning Products Market Size 2024 | USD 15,725.58 Million |
| UK Cleaning Products Market, CAGR | 4.70% |
| UK Cleaning Products Market Size 2032 | USD 22,705.47 Million |
Stringent hygiene regulations, elevated sanitation standards, and heightened infection-prevention awareness across facilities drive demand for stronger, certified cleaning products. The push for sustainability, including biodegradable ingredients and reduced-packaging formats, is compelling product reformulation and innovation. Additionally, the adoption of digital technology, such as smart dispensers and IoT-enabled monitoring systems, is enabling efficiency in usage and cleaning operations, supporting the premiumization of the product base.
Within the UK, major demand centers include England’s densely populated regions (London, South East, Midlands), which drive volume. Scotland and Northern Ireland are seeing increased uptake of eco-certified and institutional solutions due to public-sector procurement policies. The UK cleaning-products industry is worth an estimated £4.5 billion, with approximately £800 million stemming from industrial and institutional use and the remainder from household and home-care applications. Urban concentrations, strong commercial infrastructure, and regulatory frameworks in the UK create a favorable environment compared to many other European markets.
Market Insights:
- The UK Cleaning Products Market was valued at USD 14,209.46 million in 2018, expected to reach USD 15,725.58 million in 2024, and is projected to grow to USD 22,705.47 million by 2032, with a CAGR of 4.70% from 2024 to 2032.
- The top three regional shares in the UK Cleaning Products Market are driven by England's large urban centres, including London, South East, and Midlands, which contribute the most to demand due to high population density and strong commercial infrastructure.
- Scotland and Northern Ireland are the fastest-growing regions, driven by increased adoption of eco-certified products and public-sector procurement policies promoting sustainability.
- The surface cleaners segment holds the largest market share, driven by their widespread use in both residential and commercial spaces, while the commercial segment is expected to experience the fastest growth due to increased demand for hygiene in businesses and institutions.
- The market's ingredient distribution shows a strong dominance of synthetic cleaning products, though organic alternatives are gaining share as sustainability concerns grow. The end-use segment distribution indicates that household cleaning products represent a significant share, followed by commercial and industrial applications.
Market Drivers:
Stringent Hygiene Regulations and Rising Infection Control Standards
In the UK Cleaning Products Market, increasing hygiene regulations and rising infection control standards are key drivers. The COVID-19 pandemic highlighted the need for enhanced sanitation, and the government has since implemented stricter regulations to ensure higher levels of cleanliness in public spaces, healthcare settings, and businesses. This shift has led to greater demand for effective cleaning products, particularly disinfectants and sanitizers. Institutions are required to meet higher sanitation benchmarks, pushing organizations to adopt advanced cleaning solutions.
- For Instance, Ecolab's OxyCide Daily Disinfectant Cleaner has been introduced in various healthcare facilities, primarily in the United States, as part of targeted infection control programs. Studies indicate its use, sometimes after trials in specific hospitals, has reduced Hospital-Onset C. diff infection rates and simplified hygiene protocols for staff due to its sporicidal action.
Growth in Commercial and Institutional Cleaning Applications
The growing emphasis on cleanliness in commercial and institutional spaces significantly fuels the UK Cleaning Products Market. Sectors such as hospitality, healthcare, and education are heavily investing in cleaning products to maintain safe, hygienic environments. With the rising focus on employee and customer safety, businesses are opting for high-performance cleaning solutions. The market's growth is primarily driven by institutional buyers who require consistent, large-scale cleaning products to meet the high standards set by regulatory bodies.
- For instance, UK universities collectively spend an estimated £300 million annually on cleaning academic and residential buildings, with institutions averaging £26.67 per square metre on academic facilities, demonstrating the substantial financial commitment by educational institutions to maintain high-standard sanitary conditions across campuses.
Sustainability and Eco-Friendly Product Demand
Sustainability is becoming an increasingly important factor for consumers and businesses in the UK Cleaning Products Market. There is a noticeable shift towards eco-friendly cleaning solutions, which are biodegradable, free from harmful chemicals, and packaged in recyclable materials. As environmental concerns grow, both individuals and corporations are seeking greener alternatives to traditional cleaning products. Manufacturers are responding by developing products that meet sustainability goals while maintaining effective cleaning power.
Technological Advancements and Smart Cleaning Solutions
The UK Cleaning Products Market is also driven by the adoption of advanced cleaning technologies. The integration of IoT-enabled devices, smart dispensers, and automated cleaning systems is changing the way cleaning operations are conducted. These innovations enable businesses to monitor product usage, reduce waste, and improve overall efficiency. Smart cleaning solutions are especially popular in large facilities where automation helps streamline cleaning processes, leading to cost savings and enhanced operational performance.
 Market Trends:
Increasing Demand for Green and Eco-Friendly Cleaning Products
One of the most prominent trends in the UK Cleaning Products Market is the growing preference for eco-friendly and sustainable products. Consumers and businesses are becoming more environmentally conscious, driving demand for cleaning solutions that are biodegradable, non-toxic, and free from harmful chemicals. There is a noticeable shift towards products with minimal packaging, often made from recycled or recyclable materials. As environmental regulations tighten and public awareness of sustainability issues increases, manufacturers are responding by developing green alternatives that maintain cleaning efficacy while reducing their environmental footprint. This trend is expected to continue gaining momentum as both consumers and businesses prioritize sustainability in their purchasing decisions.
- For instance, Ecover has made significant efforts to use recycled plastic in its packaging, with a goal to eliminate virgin plastic entirely. As early as 2017, Ecover introduced a limited edition 'Ocean Bottle' made with 50% ocean plastic and 50% post-consumer recycled (PCR) plastic in the UK.
Adoption of Technological Solutions in Cleaning Processes
The UK Cleaning Products Market is also witnessing an increasing integration of technology into cleaning processes. Advances in automation, such as robotic cleaning systems, are enhancing efficiency in both commercial and industrial cleaning operations. Smart dispensers and IoT-enabled cleaning products are gaining popularity as they help businesses optimize usage and reduce waste. These technological solutions not only improve cleaning efficiency but also provide real-time data for better monitoring and control. This trend reflects a broader move towards digitization in the cleaning industry, where businesses seek ways to improve operational efficiency while maintaining high cleaning standards. As technology continues to evolve, these innovations are expected to reshape the way cleaning tasks are performed across various sectors.
- For instance, Kärcher introduced its Robotic Cleaner KIRA B 50 prior to 2024 (it was already available by March 2024), and it is capable of autonomously cleaning up to 2,365 m² (or approximately 2,300 m²) per hour in commercial facilities.
Market Challenges Analysis:
Rising Raw Material Costs and Supply Chain Disruptions
The UK Cleaning Products Market faces challenges related to rising raw material costs and supply chain disruptions. Increased demand for cleaning products, coupled with supply chain issues, has caused prices of key ingredients to rise. The ongoing volatility in global supply chains, exacerbated by geopolitical tensions and the aftermath of the COVID-19 pandemic, affects the availability and cost of raw materials. These price fluctuations impact manufacturers, who must either absorb the additional costs or pass them on to consumers, potentially affecting market dynamics. As the cost of production increases, companies in the UK cleaning industry face pressure to maintain profitability while meeting the growing demand for cleaning products.
Stringent Regulatory Compliance and Sustainability Expectations
The UK Cleaning Products Market also grapples with the challenges of meeting stringent regulatory standards and increasing sustainability expectations. Manufacturers are under constant pressure to comply with evolving environmental regulations, which demand the reduction of harmful chemicals and packaging waste. This requires substantial investment in research and development to create safer and more sustainable cleaning products. Simultaneously, consumer demand for environmentally friendly products adds another layer of complexity, as businesses must balance performance, cost, and sustainability in their product offerings. These factors create a challenging environment for manufacturers to innovate while maintaining compliance with regulations.
Market Opportunities:
Expansion of Eco-Friendly Product Lines
The UK Cleaning Products Market presents significant opportunities for companies to expand their eco-friendly product lines. With growing consumer awareness of environmental issues, demand for biodegradable, non-toxic, and recyclable cleaning products is increasing. Manufacturers can capitalize on this trend by developing products that align with sustainability goals, offering a competitive edge in a crowded market. As businesses and consumers alike prioritize sustainability, companies that innovate with green products have the potential to capture a larger market share. This shift provides opportunities for brands to strengthen their position in both residential and institutional cleaning sectors.
Integration of Smart and Automated Cleaning Solutions
The rise of smart and automated cleaning technologies offers another key opportunity within the UK Cleaning Products Market. Robotic cleaning systems and IoT-enabled devices are gaining popularity in commercial and industrial cleaning applications. These solutions offer improved efficiency, real-time monitoring, and reduced labor costs, making them highly attractive to businesses looking to optimize operations. As technology continues to evolve, the integration of smart cleaning solutions will become more widespread. Companies that invest in these innovations have the opportunity to lead in the growing market for automated and smart cleaning systems, which aligns with the broader trends of digital transformation in various industries.
Market Segmentation Analysis:
By Product Type
The UK Cleaning Products Market is highly diverse, with several key product types driving growth. Surface cleaners hold the largest market share due to their widespread use in both residential and commercial spaces. Toilet cleaners and glass & metal cleaners follow closely, as they are essential for maintaining hygiene in high-traffic areas. Floor cleaners and fabric cleaners are also significant segments, particularly in the hospitality and healthcare industries. Dishwashing products remain a staple in households, while other product types like personal care cleaners and building cleaners contribute to the overall market as niche categories. The market is expected to see continued growth in all these segments, with surface and toilet cleaners leading in demand.
- For instance, Reckitt Benckiser's Dettol Surface Cleanser Refill technology represents a significant advancement in the sector, utilizing a concentrated 50ml refill format that kills 99.9% of bacteria while reducing plastic consumption by 75% compared to traditional 750ml trigger bottles, allowing consumers to refill their existing spray bottles and create 750ml of cleaning solution with minimal packaging waste.
By Ingredient
The UK Cleaning Products Market is divided into organic and synthetic ingredients, each catering to different consumer preferences. Synthetic ingredients dominate the market due to their effectiveness and lower cost. However, there is a growing shift towards organic ingredients as consumers become more environmentally conscious. Organic cleaning products are perceived as safer and more sustainable, aligning with the increasing demand for eco-friendly solutions. As sustainability trends continue to rise, the market share of organic products is expected to increase, though synthetic products will maintain a strong position in the market.
- For instance, Evans Vanodine, a leading UK-based synthetic cleaning product manufacturer with over 100 years of heritage, implements robust environmental policies and sustainable practices to minimize its environmental impact while maintaining superior cleaning performance.
By End-Use
The UK Cleaning Products Market is segmented by end-use into household, commercial, and industrial applications. Household cleaning products account for a significant portion of the market, driven by consumer demand for everyday cleaning solutions. Commercial and industrial cleaning products are also growing, fueled by the need for high-performance products in offices, healthcare facilities, and other businesses. Commercial spaces prioritize products that meet hygiene standards, while industrial applications focus on more specialized, heavy-duty cleaning products. This segmentation shows strong demand across all sectors, with commercial cleaning products expected to experience the fastest growth.
Segmentations:
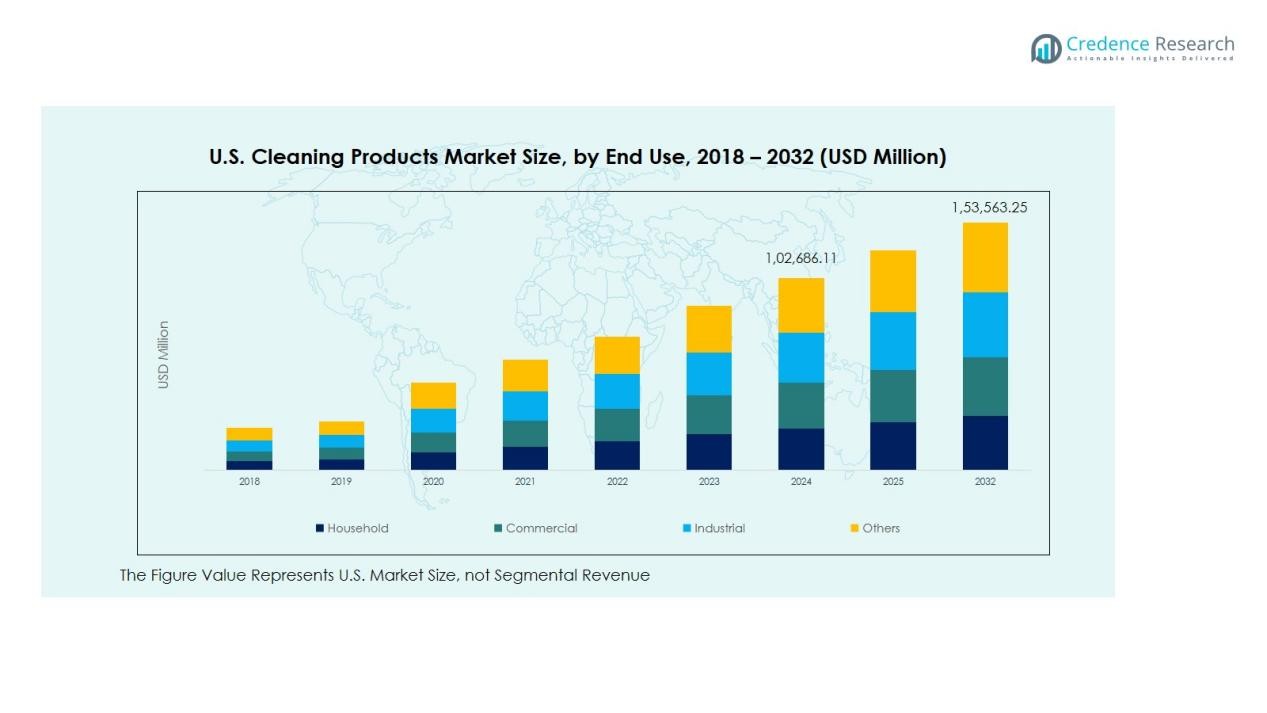
Product Type Segment Analysis
- Surface cleaners
- Toilet cleaners
- Glass & metal cleaners
- Floor cleaners
- Fabric cleaners
- Dishwashing products
- Others (personal care cleaners, building cleaner, etc.)
Ingredient Segment Analysis
- Organic
- Synthetic
End-Use Segment Analysis
- Household
- Commercial
- Industrial
- Others
Price Range Segment Analysis
- Economy
- Medium
- High
Regional Analysis:
Major Urban & Commercial Hubs Driving Demand
The UK Cleaning Products Market shows strong demand in England’s large urban centres such as London, South East and Midlands. These regions house dense populations of households and high concentrations of commercial spaces, which increase usage of cleaning products. It sees higher volumes in offices, retail and hospitality sectors where hygiene standards remain stringent. Manufacturers and distributors prioritise these regions to optimise logistics and supply chain efficiency. Commercial growth in these areas thus reinforces product penetration and market development.
Adoption of Eco‑Certified Solutions in Scotland and Northern Ireland
Scotland and Northern Ireland show increasing uptake of cleaning products certified for sustainability and environmental credentials. Public sector procurement policies in these regions favour solutions with reduced chemical footprints and recyclable packaging. It creates opportunities for manufacturers offering eco‑friendly lines or regional‑specific formulations. Growth in service contracts in hospitals, schools and government facilities drives volume in these markets. Expansion efforts here complement broader national sales strategies.
Regional Supply Chain and Manufacturing Concentration Impact
Manufacturing and chemical processing clusters in regions like the North East and East of England influence the UK Cleaning Products Market’s regional dynamics. These regions benefit from access to raw materials and logistics infrastructure, reducing cost pressures for local manufacturers. It enables faster product roll‑out and regional diversification of supply chains. Lower transport distances and regional plant presence support responsiveness to demand shifts and regulatory changes. Consequently, these regional advantages help firms strengthen competitive positioning and regional market resilience.
Key Player Analysis:
- Reckitt Benckiser Group plc
- McBride plc
- Evans Vanodine International plc
- Cleenol Group Ltd
- Talbot Chemicals Ltd
- Procter & Gamble Co.
- Unilever plc
- Henkel AG & Co. KGaA
- C. Johnson & Son, Inc.
- Astonish Cleaners
- Delphis Eco
- Robert McBride Ltd
- Jeyes Group Ltd
Competitive Analysis:
The competitive landscape of the UK Cleaning Products Market features a mix of global giants and specialised domestic manufacturers. Reckitt Benckiser Group plc leads with its strong hygiene and home-care brands, leveraging scale, brand equity, and broad distribution. McBride plc serves the market primarily through private label and contract manufacturing, aiming for cost-leadership and value offerings. Evans Vanodine International plc specializes in professional hygiene, catering to commercial and industrial clients with a wide application range from washrooms to food-processing environments. Cleenol Group Ltd focuses on niche high-quality and eco-certified products, distinguishing itself via family ownership and sustainability credentials. Talbot Chemicals Ltd offers a wide chemical cleaning materials portfolio, including large-format and custom-label supply, targeting industrial and bespoke users. Procter & Gamble Co. remains a relevant competitor through its global consumer-care infrastructure and premium cleaning solutions. This varied competitive mix means companies must continuously differentiate on brand strength, cost efficiency, innovation, or sustainability to maintain or grow share in the market.
Recent Developments:
- In March 2025, Procter & Gamble launched the Always Pocket Flexfoam and became the first-ever period care partner at Coachella.
- In October 2025, Henkel announced an expansion of its strategic partnership with Dow to decarbonize its adhesives portfolio by integrating low-carbon feedstocks and renewable electricity.
Report Coverage:
The research report offers an in-depth analysis based on Product Type, Ingredient, End-Use and Price Range. It details leading market players, providing an overview of their business, product offerings, investments, revenue streams, and key applications. Additionally, the report includes insights into the competitive environment, SWOT analysis, current market trends, as well as the primary drivers and constraints. Furthermore, it discusses various factors that have driven market expansion in recent years. The report also explores market dynamics, regulatory scenarios, and technological advancements that are shaping the industry. It assesses the impact of external factors and global economic changes on market growth. Lastly, it provides strategic recommendations for new entrants and established companies to navigate the complexities of the market.
Future Outlook:
- The UK Cleaning Products Market is expected to see sustained demand, driven by both consumer and commercial needs.
- Eco-friendly products will continue to gain traction as consumers and businesses prioritize sustainability in their purchasing decisions.
- The shift towards organic and biodegradable cleaning solutions will influence product innovation and market growth.
- Technological advancements, such as smart dispensers and IoT-enabled cleaning systems, will become increasingly prevalent in commercial applications.
- The commercial segment will expand as businesses across sectors such as hospitality, healthcare, and retail increase their focus on cleanliness and hygiene standards.
- Demand for household cleaning products will remain strong, supported by growing consumer awareness of hygiene practices post-pandemic.
- Public sector procurement policies in Scotland and Northern Ireland will favor eco-certified products, providing growth opportunities in these regions.
- The continued development of efficient and cost-effective cleaning solutions will shape competitive strategies in the market.
- Local and regional supply chains will become more important as businesses focus on reducing costs and improving operational efficiency.
- As urbanization continues, particularly in England's major cities, the demand for cleaning products in both residential and commercial spaces will remain robust.
Request a Free Sample
Fill in your details and we'll send you a free sample report.
- Sample data tables & charts
- Research methodology
Need a Custom Version of This Report?
Tailor the scope, geography, or segments to your exact requirements.
- Custom geography or segment scope
- Direct access to our analyst team
Frequently Asked Questions
What is the current market size for the UK Cleaning Products Market, and what is its projected size in 2032?
At what Compound Annual Growth Rate is the UK Cleaning Products Market projected to grow between 2024 and 2032?
Which UK Cleaning Products Market segment held the largest share in 2024?
What are the primary factors fueling the growth of the UK Cleaning Products Market?
Who are the leading companies in the UK Cleaning Products Market?
Which region commanded the largest share of the UK Cleaning Products Market in 2024?
Table of Content
Chapter 1. Report Introduction
- 1.1 Report Description & Purpose
- 1.1.1 Report Title & Market Definition
- 1.1.2 Unique Selling Propositions (USP) & Key Differentiators
- 1.1.3 Value Proposition for Stakeholders
- 1.2 Research Objectives
- 1.2.1 Market Sizing Objectives (Volume & Revenue) (Volume Where Applicable)
- 1.2.2 Segmentation Objectives
- 1.2.3 Competitive Intelligence Objectives
- 1.2.4 Forecast & Scenario Objectives
- 1.3 Report Scope
- 1.3.1 UK Cleaning Products Scope – Segments & Subsegments Covered
- 1.3.2 Geographic Scope – Selected Country & Subnational Markets Covered
- 1.3.3 Historical Period, Base Year & Forecast Period (2018; forecast to 2032)
- 1.3.4 Inclusions & Exclusions
- 1.4 Industry Classification & Applicable Codes
- 1.5 Currency, Measurement Units & Valuation Basis
- 1.6 Target Stakeholders
- 1.7 Limitations & Assumptions
Chapter 2. Executive Summary
- 2.1 UK Cleaning Products Snapshot
- 2.1.1 Market Size – Historical (2018) & Forecast (2018-2032) (2018: USD 14,209.46 million → 2032: USD 22,705.47 million)
- 2.1.2 Volume & Revenue – National Totals (Volume Where Applicable)
- 2.1.3 Key Market Highlights – Top Five Facts
- 2.2 UK Cleaning Products Segmentation Snapshot
- 2.2.1 Market Split by Subnational Area – 2018 vs. 2032
- 2.3 Competitive Snapshot
- 2.3.1 Top 10 Players by Revenue Share – 2018
- 2.3.2 Top 10 Players by Volume Share – 2018 (Volume Where Applicable)
- 2.3.3 Recent Strategic Developments (18-Month Summary)
- 2.4 Key Investment Highlights & Strategic Conclusions
Chapter 3. UK Cleaning Products Dynamics & Industry Analysis
- 3.1 Market Overview & Context
- 3.1.1 UK Cleaning Products Position in the Broader Industry Value Chain
- 3.1.2 Demand Structure & Purchasing Dynamics
- 3.1.3 Market Maturity & Development Stage Across Domestic Markets
- 3.2 UK Cleaning Products Drivers
- 3.3 UK Cleaning Products Restraints & Challenges
- 3.4 UK Cleaning Products Opportunities
- 3.5 Porter's Five Forces Analysis
- 3.5.1 Threat of New Entrants
- 3.5.2 Bargaining Power of Suppliers
- 3.5.3 Bargaining Power of Buyers
- 3.5.4 Threat of Substitutes
- 3.5.5 Competitive Rivalry – Intensity Assessment
- 3.6 UK Cleaning Products Value Chain Analysis
- 3.6.1 Upstream – Key Inputs, Resources & Suppliers
- 3.6.1.1 Key Input/Resource 1
- 3.6.1.2 Key Input/Resource 2
- 3.6.1.3 Key Input/Resource 3
- 3.6.2 Midstream – Core Operations & Value Creation
- 3.6.2.1 Operating Model & Process Overview
- 3.6.2.2 Key Operating Locations & Capabilities by Company
- 3.6.3 Downstream – Market Channels & End Users
- 3.6.3.1 Direct Sales & Customer Engagement Channels
- 3.6.3.2 Indirect Sales, Intermediaries & Partner Channels
- 3.6.4 Value Chain Profitability Analysis
- 3.6.1 Upstream – Key Inputs, Resources & Suppliers
- 3.7 PESTEL Analysis
- 3.7.1 Political Factors
- 3.7.2 Economic Factors
- 3.7.3 Social Factors
- 3.7.4 Technological Factors
- 3.7.5 Environmental Factors
- 3.7.6 Legal Factors
- 3.8 UK Cleaning Products Supply Chain Analysis
- 3.8.1 Critical Input & Resource Availability Risk Assessment
- 3.8.2 Supplier & Operational Concentration Risk (Geographic Exposure)
- 3.8.3 Supply & Service Disruption Impact Analysis
- 3.9 National & Subnational Regulatory Landscape
Note: The regulatory and policy landscape section covers regulations based on their applicability to the market, UK Cleaning Products category, geography, and scope of the study. Only regulatory frameworks with a material impact on operations, compliance, trade, sustainability, or market access are analyzed in detail.
Chapter 4. Key Investment Pockets & Opportunity Analysis
- 4.1 UK Cleaning Products Attractiveness Analysis
- 4.1.1 By Subnational Area – Investment Attractiveness Matrix (Market Size × CAGR)
- 4.2 Absolute Revenue Growth Opportunity
- 4.2.1 By Subnational Area – Absolute Revenue Growth Through 2032
- 4.3 Incremental Demand Opportunity
- 4.3.1 By Subnational Area – Incremental Demand Through 2032
- 4.3.2 Segment – Incremental Demand
- 4.4 Emerging Submarket Opportunity Deep Dive (Subject to Applicability)
- 4.5 Priority Domestic Market Opportunity Scorecards
- 4.5.1 Priority Domestic Market 1
- 4.5.2 Priority Domestic Market 2
- 4.5.3 Priority Domestic Market 3
- 4.5.4 Priority Domestic Market 4
Note: Domestic market scorecards cover relevant states, provinces, territories, cities, or economic zones within the selected country. Numbered entries are populated with market names suited to the national administrative structure and research scope. Geographic share tables use one consistent, nonoverlapping set of areas.
Chapter 5. UK Cleaning Products Cross-Border Trade & Market Access Analysis
- 5.1 National Trade & International Partner Overview
- 5.1.1 Export Value by Destination Country (2018)
- 5.1.2 Export Volume by Destination Country (2018) (Where Applicable)
- 5.1.3 Import Value by Source Country (2018)
- 5.1.4 Import Volume by Source Country (2018) (Where Applicable)
- 5.1.5 National & Partner-Country Trade Balances (2018)
- 5.2 Export Analysis – Segment
- 5.2.1 Category 1 (Applicable Classification Code)
- 5.2.2 Category 2 (Applicable Classification Code)
- 5.2.3 Category 3 (Applicable Classification Code)
- 5.2.4 Category 4 (Applicable Classification Code)
- 5.2.5 Category 5 (Applicable Classification Code)
- 5.3 Import Analysis – Segment
- 5.3.1 Category 1 (Applicable Classification Code)
- 5.3.2 Category 2 (Applicable Classification Code)
- 5.3.3 Category 3 (Applicable Classification Code)
- 5.3.4 Category 4 (Applicable Classification Code)
- 5.3.5 Category 5 (Applicable Classification Code)
- 5.4 Cross-Border Pricing & Transaction Benchmarks
- 5.4.1 Export Pricing – Segment & Destination Country
- 5.4.2 Import Pricing – Segment & Source Country
- 5.4.3 Price Trends (2018)
- 5.5 Key Cross-Border Trade & Delivery Routes
- 5.5.1 Cross-Border Trade/Delivery Route 1
- 5.5.2 Cross-Border Trade/Delivery Route 2
- 5.5.3 Cross-Border Trade/Delivery Route 3
- 5.5.4 Cross-Border Trade/Delivery Route 4
- 5.5.5 Cross-Border Trade/Delivery Route 5
- 5.6 Trade Policy & Market Access Impact Assessment
- 5.6.1 Tariff & Non-Tariff Barriers
- 5.6.2 National Participation in Regional Trade & Economic Frameworks
- 5.6.3 Bilateral & Multilateral Trade Agreements
- 5.6.4 Cross-Border Operating, Licensing & Localization Requirements
Note: This chapter covers international trade relevant to UK Cleaning Products in the selected country. Exports are analyzed by destination and imports by source. Domestic interregional flows are excluded from international trade totals. Goods, services, and digital offerings use applicable classifications; volume and route analyses apply only where meaningful.
Chapter 6. Competitive Landscape & Company Benchmarking
- 6.1 UK Cleaning Products Concentration & Structure
- 6.1.1 Herfindahl-Hirschman Index (HHI) – the historical period vs. 2018
- 6.1.2 Leading, Mid-Sized & Emerging Player Structure
- 6.1.3 Multinational, National & Local Player Dynamics
- 6.2 UK Cleaning Products Share Analysis – 2018
- 6.2.1 National Revenue Share by Company
- 6.2.2 National Volume Share by Company (Volume Where Applicable)
- 6.2.3 Company Revenue Share by Subnational Area
- 6.2.4 Market Share Evolution (the historical period vs. 2018)
- 6.2.5 Company Market Share by Key Segment
- 6.2.6 Company Market Share by Customer Group
- 6.3 Operating Scale, Capacity & Infrastructure Analysis
- 6.3.1 National Operating Scale & Supply Capacity
- 6.3.2 Resource Utilization & Operating Efficiency
- 6.3.3 Output, Service Delivery & Activity Metrics
- 6.3.4 Operating Footprint & Infrastructure Map
- 6.3.5 Planned Operational & Capacity Expansion
- 6.4 UK Cleaning Products Competitive Benchmarking Matrix
- 6.4.1 Revenue, Growth, Profitability & Operating Metric Comparison
- 6.4.2 Channel Revenue Mix
- 6.4.3 Revenue Exposure Across Domestic Markets
- 6.4.4 R&D Intensity
- 6.4.5 Sustainability Maturity
- 6.5 Strategic Developments in UK Cleaning Products (Last 24 Months)
- 6.5.1 Mergers, Acquisitions & Divestments
- 6.5.2 New Products, Services & Solutions in UK Cleaning Products
- 6.5.3 Operational & Infrastructure Expansions
- 6.5.4 Strategic Alliances, Joint Ventures & Partnerships
- 6.5.5 Distribution Expansion & Market Entry
- 6.5.6 Sustainability & ESG Initiatives
- 6.6 Competitive Strategy Mapping
- 6.6.1 Leader, Challenger, Follower & Niche Classification
- 6.6.2 Pricing Strategy Comparison
- 6.6.3 Channel Strategy Matrix
Note: Strategic developments are included based on their materiality and the availability of reliable information.
Chapter 7. UK Cleaning Products – By Sales & Delivery Channel
- 7.1 Segment Overview
- 7.1.1 Volume & Revenue Split by Channel (2018 & 2032) (Volume Where Applicable)
- 7.1.2 Channel Mix Evolution (2018-2032)
Chapter 8. Subnational Market Analysis – Country Overview
- 8.1 Domestic Geographic Market Overview
- 8.1.1 Subnational Volume Share (Where Applicable)
- 8.1.2 Subnational Revenue Share
- 8.1.3 Market Volume by Subnational Area (Where Applicable)
- 8.1.4 Market Revenue by Subnational Area
- 8.1.5 Subnational Forecasts Through 2032
- 8.2 Cross-Area Segment Analysis Within the Country
- 8.2.1 By Sales & Delivery Channel
- 8.2.2 By Competitive Positioning & Price Tier
Chapter 9. UK Cleaning Products – Priority Domestic Market 1
Chapter 10. UK Cleaning Products – Priority Domestic Market 2
Chapter 11. UK Cleaning Products – Priority Domestic Market 3
Chapter 12. UK Cleaning Products – Priority Domestic Market 4
Chapter 13. UK Cleaning Products Company Profiles
- 13.1 [Company 01]
- 13.1.1 Company Overview
- 13.1.2 Key Management Personnel
- 13.1.3 Products & Services Portfolio
- 13.1.4 Financial Performance
- 13.1.5 Domestic Market Focus & Local Operating Presence
- 13.1.6 Recent Developments & Strategic Initiatives
Note: The company profile list is preliminary and may change based on research findings, market developments, data availability, and client requirements.
Chapter 14. Appendices
- Appendix A – List of Abbreviations & Acronyms
- Appendix B – Industry Classification Code Reference – Full Series
- Appendix C – Supply, Output & Operating Capacity Data Tables
- Appendix D – End-Use & Demand Base Tables
- Appendix E – Demand, Adoption & Usage Assumptions
- Appendix F – Pricing & Revenue Metric Reference Tables
- Appendix G – Company Operations & Infrastructure Database
- Appendix H – Cross-Border Trade & Activity Data Tables (Where Applicable)
- Appendix I – Regulatory Summary Tables
- Appendix J – Primary Research Participant List (Anonymized)
- Appendix K – Primary Research Questionnaire Framework
- Appendix L – Data Sources & Bibliography
- Appendix M – Market Size Divergence & Source Comparison
Chapter 15. Research Methodology
- 15.1 Research Framework & Philosophy
- 15.2 Secondary Research – Sources, Hierarchy & Data Extraction
- 15.3 Data Modeling – National Market Sizing & Subnational Allocation
- 15.4 Primary Research – Stakeholder Framework, LOI & Sample Sizes
- 15.5 Forecast Methodology – Regression, Scenario & Sensitivity Analysis
- 15.6 Quality Control – Four-Layer Validation Framework
- 15.7 Limitations & Standard Assumptions
- 15.8 Disclaimer
