
Market Overview
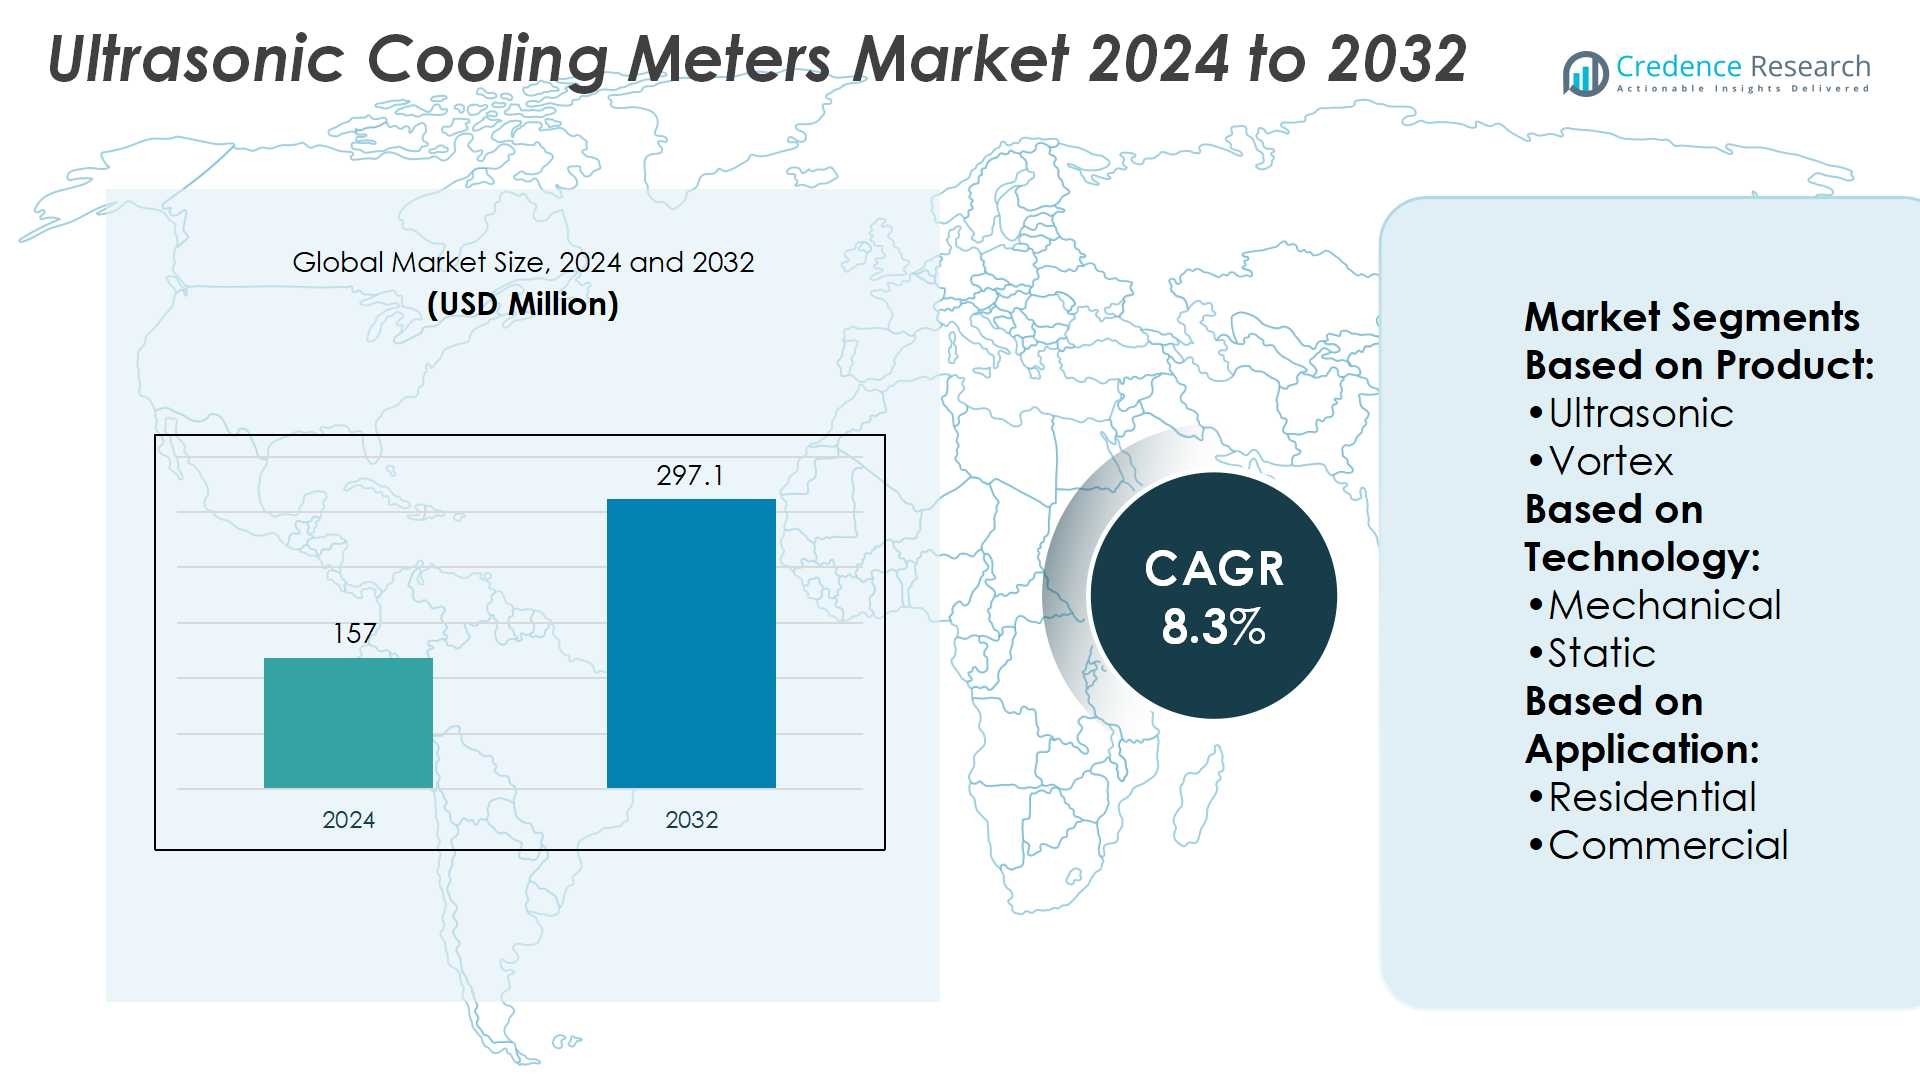
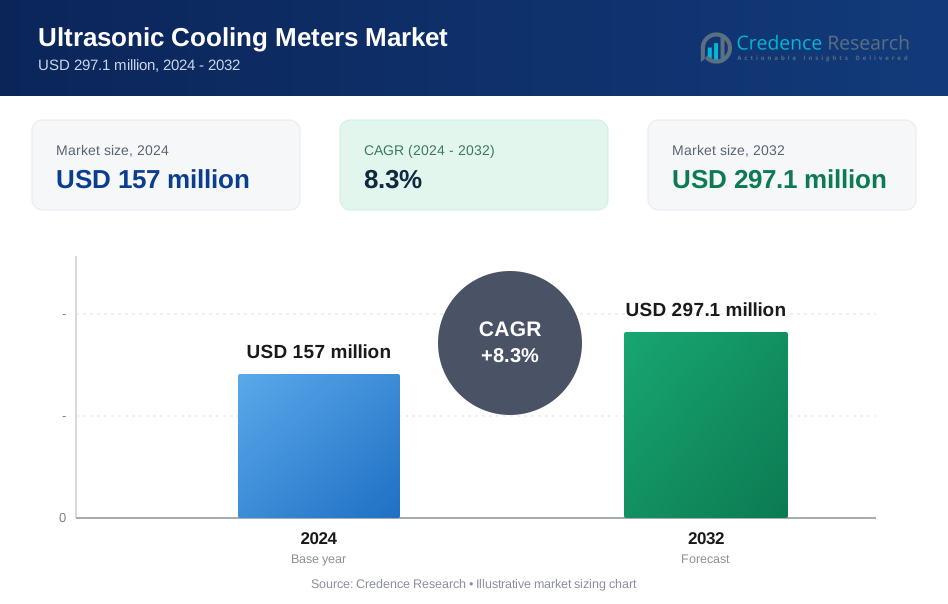
Ultrasonic Cooling Meters Market size was valued at USD 157 million in 2024 and is anticipated to reach USD 297.1 million by 2032, at a CAGR of 8.3% during the forecast period.
| REPORT ATTRIBUTE | DETAILS |
|---|---|
| Historical Period | 2020-2023 |
| Base Year | 2024 |
| Forecast Period | 2025-2032 |
| Ultrasonic Cooling Meters Market Size 2024 | USD 157 Million |
| Ultrasonic Cooling Meters Market, CAGR | 8.3% |
| Ultrasonic Cooling Meters Market Size 2032 | USD 297.1 Million |
The Ultrasonic Cooling Meters Market grows through rising demand for accurate energy measurement, smart infrastructure, and sustainability compliance. Governments and utilities focus on efficiency, driving adoption of advanced metering technologies. It delivers precise data for billing, energy optimization, and real-time monitoring, making it suitable for residential, commercial, and institutional use. The market benefits from expansion of district heating and cooling systems, particularly in urban areas. Integration with IoT platforms, predictive analytics, and cloud-based solutions strengthens its role in modern energy management. Growing emphasis on carbon reduction and regulatory mandates further accelerates adoption across developed and emerging regions.
North America leads the Ultrasonic Cooling Meters Market with strong adoption in smart city projects, while Europe follows with strict efficiency regulations and widespread district heating networks. Asia-Pacific records the fastest growth, driven by urbanization and large-scale infrastructure expansion. Latin America and the Middle East & Africa show steady progress through commercial and institutional demand. Key players such as Kamstrup, Landis+Gyr, BMETERS Srl, Sontex SA, Diehl Stiftung & Co. KG, Itron Inc., Schneider Electric, ista Energy Solutions Limited, Danfoss, and Integra strengthen competition.
Market Insights
- Ultrasonic Cooling Meters Market size was valued at USD 157 million in 2024 and is anticipated to reach USD 297.1 million by 2032, at a CAGR of 8.3%.
- Rising demand for accurate energy measurement and smart infrastructure drives adoption across sectors.
- Growing trend of IoT integration, predictive analytics, and cloud platforms strengthens market growth.
- Competition intensifies with global players focusing on innovation, digital solutions, and partnerships with utilities.
- High installation costs and technical complexity remain restraints for wider adoption in cost-sensitive regions.
- North America leads with strong smart city initiatives, Europe follows with strict energy efficiency mandates, and Asia-Pacific records fastest growth from urbanization.
- Latin America and the Middle East & Africa show steady expansion supported by commercial and institutional demand.
Market Drivers
Growing Demand for Accurate Energy Measurement
The Ultrasonic Cooling Meters Market experiences strong growth due to rising demand for accurate energy measurement. Governments and utilities emphasize fair billing and transparent consumption tracking. It helps ensure precise measurement in residential, commercial, and industrial facilities. Traditional mechanical meters often face wear issues, while ultrasonic models provide longer service life. The push toward efficiency in energy distribution increases reliance on these devices. Expanding urban infrastructure projects further boost adoption in high-density environments.
- For instance, Kamstrup’s MULTICAL® 603 calculator, when paired with a custom-adjusted ULTRAFLOW® 44 ultrasonic flow sensor, can deliver a measurement accuracy of ±0.5% at its nominal flow rate. The ULTRAFLOW® 44 sensors are available for nominal flow ranges starting from 1.5 m³/h, up to 100 m³/h.
Transition Toward Smart and Connected Infrastructure
Smart grid initiatives strengthen the role of ultrasonic cooling meters. Governments and utilities invest in digital platforms to enhance real-time monitoring. It integrates seamlessly with IoT systems, enabling predictive maintenance and remote diagnostics. Demand rises in both developed and emerging economies with smart city projects. The ability to provide accurate data for energy optimization increases its value. Rising adoption of cloud-based platforms accelerates demand for advanced meters.
- For instance, BMETERS Srl operates three production plants in Italy that collectively cover 12,000 m². The company manufactures over 2.2 million heat and water metering units annually. It exports its products to more than 90 countries and offers advanced ultrasonic meters with a high degree of accuracy, such as R400.
Regulatory Policies and Efficiency Standards
Energy efficiency directives drive adoption of ultrasonic cooling meters across regions. Regulators mandate the use of precise metering solutions in district heating and cooling networks. It supports compliance with international environmental standards while lowering carbon emissions. Growing awareness among end users about energy conservation strengthens deployment. Countries across Europe and Asia-Pacific adopt strict building efficiency norms. The meters meet these requirements and align with long-term sustainability goals.
Rising Demand in District Heating and Cooling Networks
The expansion of district heating and cooling infrastructure directly supports market growth. Large-scale urban projects require efficient and accurate metering solutions. It provides real-time consumption insights to both utilities and consumers. The ability to operate reliably under varying flow conditions makes it suitable for dense networks. Growing investment in sustainable energy systems accelerates adoption. The technology plays a key role in optimizing operational efficiency in urban energy management.
Market Trends
Adoption of Smart and IoT-Enabled Solutions
The Ultrasonic Cooling Meters Market shows strong growth through integration with smart and IoT technologies. Utilities and building operators adopt these meters to enable real-time data monitoring and predictive maintenance. It connects with cloud-based systems, offering advanced analytics for energy optimization. Smart features help in detecting anomalies and reducing operational costs. The trend aligns with global investment in smart city development. It supports both residential and large-scale commercial infrastructures.
- For instance, Sontex SA's Superstatic 449 cooling meter is designed for flows ranging from 0.6 to 2.5 m³/h. Its Supercal 531 integrator logs supply and return temperatures every 30 seconds on battery power (Type C), every 20 seconds (Type D battery), and every 3 seconds when mains-powered.
Shift Toward Sustainability and Energy Efficiency
Growing focus on sustainability fuels demand for ultrasonic cooling meters. Governments enforce stricter energy efficiency regulations across urban infrastructure. It provides accurate readings, reducing losses in district heating and cooling networks. The meters play a role in supporting climate goals by lowering energy wastage. End users increasingly value devices that help cut emissions and optimize usage. The shift builds strong momentum in both developed and emerging economies.
- For instance, Diehl Metering’s SHARKY series—specifically the SHARKY 775 ultrasonic cooling meter—achieved a perfect 5-star rating in independent AGFW tests for measurement stability and accuracy for five consecutive rounds.
Increased Adoption in District Heating and Cooling Networks
Expansion of district energy systems creates significant opportunities for ultrasonic cooling meters. Urbanization and infrastructure modernization push demand for efficient monitoring tools. It ensures reliable measurement in large, complex energy networks. Rising investments in sustainable district projects across Europe and Asia-Pacific accelerate adoption. These systems require precise metering for fair billing and effective load management. Utilities prioritize ultrasonic meters for their durability and low maintenance needs.
Technological Advancements Enhancing Accuracy and Reliability
Continuous innovation shapes the future of ultrasonic cooling meters. Manufacturers invest in advanced flow measurement technologies to improve accuracy. It withstands varying flow conditions better than mechanical meters. Enhanced durability extends operational life, making the devices cost-effective over time. Integration of digital platforms further strengthens their role in energy management. The focus on innovation ensures consistent improvement in performance and efficiency across global markets.
Market Challenges Analysis
High Installation Costs and Technical Complexity
The Ultrasonic Cooling Meters Market faces barriers due to high initial installation costs and technical challenges. Utilities and building operators often hesitate to replace mechanical meters with advanced alternatives because of budget constraints. It requires skilled personnel for calibration, integration, and maintenance, which adds further expenses. Smaller facilities find adoption difficult when compared with large-scale projects. The high upfront investment slows penetration in cost-sensitive regions. It creates a gap between demand potential and actual deployment across emerging markets.
Interoperability and Data Security Concerns
Growing reliance on digital platforms highlights interoperability and cybersecurity as critical challenges. The meters must integrate seamlessly with diverse IoT systems and utility networks. It often encounters compatibility issues, delaying full-scale adoption in complex infrastructure environments. Concerns about unauthorized access and data breaches also impact trust among end users. Utilities and regulators demand strict compliance with cybersecurity standards, adding complexity for manufacturers. It requires continuous innovation and investment to address these evolving risks effectively.
Market Opportunities
Expansion of Smart Cities and District Energy Systems
The Ultrasonic Cooling Meters Market benefits from rising investments in smart city projects and district energy networks. Governments and utilities emphasize advanced metering to support efficient energy use and sustainability goals. It delivers precise data that helps optimize consumption across residential, commercial, and industrial facilities. Expanding district heating and cooling systems in Europe, Asia-Pacific, and the Middle East create strong opportunities. The technology’s reliability and low maintenance appeal to large-scale infrastructure operators. It positions ultrasonic meters as essential components in next-generation urban energy frameworks.
Integration with Digital Platforms and Emerging Technologies
The growing trend of digital transformation provides significant opportunities for ultrasonic cooling meters. Utilities demand solutions that connect with IoT platforms, predictive analytics, and cloud-based systems. It supports real-time monitoring, enabling better load management and consumer transparency. Rising adoption of AI-driven energy optimization tools enhances the value of advanced meters. Emerging markets with rapid infrastructure growth present untapped potential for adoption. It drives expansion into new regions while strengthening the role of ultrasonic meters in global energy efficiency strategies.
Market Segmentation Analysis:
By Product
The Ultrasonic Cooling Meters Market is segmented into ultrasonic, vortex, and others. Ultrasonic meters dominate adoption due to their high accuracy, durability, and low maintenance needs. It delivers precise measurement even under variable flow conditions, making it suitable for district heating and cooling systems. Vortex meters hold steady demand, especially in industrial and large-scale commercial projects requiring robust operation. The others category, including hybrid solutions, finds niche adoption where specialized applications are required. Growth in this segment remains moderate compared to ultrasonic products.
- For instance, Itron’s CF Echo II ultrasonic meter handles nominal flows from 0.6 m³/h up to 15 m³/h (standard sizes DN15 to DN50) with stable accuracy across its full range. For larger applications, the Axonic static ultrasonic meter serves flows up to 50 m³/h (in 65 mm size), with a minimum flow down to 100 L/h (for a dynamic range of R250).
By Technology
Market segmentation by technology includes mechanical and static systems. Mechanical variants continue to serve budget-sensitive projects but face limitations in accuracy and lifespan. It requires more frequent maintenance, which increases operational costs over time. Static technology gains strong traction due to its advanced design and digital integration capabilities. These meters provide real-time data and work effectively with smart grid and IoT systems. The static category reflects the shift toward modernized infrastructure and long-term efficiency in energy monitoring.
- For instance, Schneider Electric’s K Series Ultrasonic Heat-Cool Meter (KD model) covers nominal flows from 1.5 m³/h (pipe size G¾B) up to 250 m³/h (DN150 flange). The meter’s battery operates up to 16 years, and its calculator is rated IP65 for durability.
By Application
Applications cover residential, commercial, and college/university segments. The residential segment records strong growth driven by urbanization and rising demand for accurate billing. It appeals to consumers seeking transparency and energy efficiency in household consumption. The commercial segment secures significant share due to large facilities, shopping complexes, and office buildings requiring reliable monitoring. College and university campuses adopt ultrasonic meters to manage extensive heating and cooling networks efficiently. It enables institutions to reduce energy costs while aligning with sustainability goals. Each application segment highlights distinct adoption drivers, strengthening overall market expansion.
Segments:
Based on Product:
- Ultrasonic
- Vortex
Based on Technology:
- Mechanical
- Static
Based on Application:
- Residential
- Commercial
Based on the Geography:
- North America
- U.S.
- Canada
- Mexico
- Europe
- Germany
- France
- U.K.
- Italy
- Spain
- Rest of Europe
- Asia Pacific
- China
- Japan
- India
- South Korea
- South-east Asia
- Rest of Asia Pacific
- Latin America
- Brazil
- Argentina
- Rest of Latin America
- Middle East & Africa
- GCC Countries
- South Africa
- Rest of the Middle East and Africa
Regional Analysis
North America
North America holds a market share of 32% in the Ultrasonic Cooling Meters Market, supported by advanced infrastructure and early adoption of smart technologies. The United States leads the region with strong deployment across residential and commercial sectors. It benefits from government-backed energy efficiency programs and utility-driven modernization projects. Canada follows closely, focusing on sustainable district heating and cooling systems in urban areas. The integration of IoT-enabled meters aligns with regional priorities for transparent billing and advanced energy monitoring. Demand is further fueled by rising emphasis on reducing carbon emissions in large commercial complexes. Continuous investments in smart city frameworks keep the region a strong contributor to global growth.
Europe
Europe accounts for a market share of 28%, driven by regulatory mandates and widespread adoption of district energy systems. Germany, Denmark, and Sweden lead in deploying ultrasonic meters within district heating networks. It supports strict energy efficiency targets under European Union policies and sustainability frameworks. The growing preference for static and digital solutions enhances adoption in both residential and institutional projects. Universities and healthcare facilities adopt these systems to manage energy use efficiently. Rising investments in green infrastructure and low-carbon technologies expand the role of ultrasonic meters. The strong alignment with regulatory compliance continues to shape steady growth across the region.
Asia-Pacific
Asia-Pacific secures a market share of 25%, reflecting rapid urbanization and infrastructure development. China dominates with extensive deployment of smart meters in residential and commercial sectors. It benefits from large-scale smart city initiatives and strong government backing for digital transformation in utilities. Japan and South Korea adopt ultrasonic meters to strengthen energy conservation in advanced infrastructure systems. India shows fast growth as expanding cities adopt efficient energy monitoring solutions. The region’s demand is further reinforced by rising investments in district cooling projects in Southeast Asia. It positions Asia-Pacific as the fastest-growing regional market with strong future potential.
Latin America
Latin America holds a market share of 8%, supported by gradual adoption across commercial and institutional segments. Brazil leads the region with increasing demand in urban districts and large building complexes. It benefits from growing focus on energy conservation in high-density metropolitan areas. Mexico follows with adoption driven by commercial facilities and government sustainability programs. Limited awareness and budget constraints slow residential adoption, but commercial use provides stable demand. The integration of advanced technologies remains in early stages, yet opportunities continue to expand. Rising regional investments in urban modernization projects strengthen the role of ultrasonic meters in Latin America.
Middle East & Africa
The Middle East & Africa captures a market share of 7%, with demand concentrated in district cooling networks. Gulf countries such as the UAE, Saudi Arabia, and Qatar invest heavily in sustainable infrastructure and smart city projects. It plays a vital role in enabling accurate monitoring for large-scale district cooling plants. Africa records slower growth due to limited infrastructure but shows potential in urban centers like South Africa. Rising demand for efficient energy management in commercial and institutional buildings supports regional adoption. Government initiatives for sustainable energy solutions further enhance growth opportunities. The region continues to expand steadily, supported by infrastructure upgrades and smart city investments.
Key Player Analysis
- Kamstrup
- Landis+Gyr
- BMETERS Srl
- Sontex SA
- Diehl Stiftung & Co. KG
- Itron Inc.
- Schneider Electric
- ista Energy Solutions Limited
- Danfoss
- Integra
Competitive Analysis
The Ultrasonic Cooling Meters Market players such as Kamstrup, Landis+Gyr, BMETERS Srl, Sontex SA, Diehl Stiftung & Co. KG, Itron Inc., Schneider Electric, ista Energy Solutions Limited, Danfoss, and Integra. The Ultrasonic Cooling Meters Market demonstrates strong competition, driven by continuous innovation and digital transformation. Companies emphasize advanced technologies that improve accuracy, reliability, and integration with smart energy platforms. The market favors solutions that align with sustainability goals and regulatory frameworks, especially in district heating and cooling systems. Firms invest heavily in research and development to introduce products with longer lifespan, reduced maintenance, and seamless connectivity with IoT platforms. Competitive strategies often include partnerships with utilities, expansion into emerging markets, and development of cloud-based analytics for real-time monitoring. The focus remains on delivering precise energy measurement while meeting growing demand for efficiency and transparency across residential, commercial, and institutional applications.
Recent Developments
- In March 2025, Itron and CHINT Global launched the first residential electric smart meter based on the DLMS Generic Companion Profile standard, boosting interoperability and cutting deployment cost.
- In November 2024, Kamstrup introduced its first heating meter equipped with built-in LoRaWAN communication module. The LoRa communication modules can be ordered as a factory mounted, built-in version across its MULTICAL 403, 603 and 803 thermal energy meters.
- In February 2024, Panasonic corporation made an announcement confirming the news that its electric works company will be ready to accept orders for the ultrasonic flow and concentration meter for hydrogen.
- In September 2023, ZENNER International GmbH & Co. KG and Minol ZENNER Connect, entered in a partnership agreement with given municipal utilities, energy suppliers, municipalities, and the housing industry with an all-inclusive infrastructure to digitalize the energy conversion.
Report Coverage
The research report offers an in-depth analysis based on Product, Technology, Application and Geography. It details leading market players, providing an overview of their business, product offerings, investments, revenue streams, and key applications. Additionally, the report includes insights into the competitive environment, SWOT analysis, current market trends, as well as the primary drivers and constraints. Furthermore, it discusses various factors that have driven market expansion in recent years. The report also explores market dynamics, regulatory scenarios, and technological advancements that are shaping the industry. It assesses the impact of external factors and global economic changes on market growth. Lastly, it provides strategic recommendations for new entrants and established companies to navigate the complexities of the market.
Future Outlook
- The market will expand with rising adoption of smart city infrastructure.
- Demand will grow as governments enforce stricter energy efficiency regulations.
- Digital integration with IoT and cloud platforms will drive wider usage.
- District heating and cooling projects will remain a major growth driver.
- Static technology will gain higher preference over mechanical variants.
- Residential adoption will rise with growing urbanization and accurate billing needs.
- Commercial and institutional sectors will adopt meters for sustainability compliance.
- Continuous R&D will improve accuracy, durability, and interoperability of devices.
- Emerging economies will create new opportunities through rapid infrastructure growth.
- Focus on carbon reduction and sustainability will strengthen global market penetration.
Request a Free Sample
Fill in your details and we'll send you a free sample report.
- Sample data tables & charts
- Research methodology
Need a Custom Version of This Report?
Tailor the scope, geography, or segments to your exact requirements.
- Custom geography or segment scope
- Direct access to our analyst team
Frequently Asked Questions
What is the current market size for Ultrasonic Cooling Meters Market, and what is its projected size in 2032?
At what Compound Annual Growth Rate is the Ultrasonic Cooling Meters Market projected to grow between 2025 and 2032?
Which Ultrasonic Cooling Meters Market segment held the largest share in 2024?
What are the primary factors fueling the growth of the Ultrasonic Cooling Meters Market?
Who are the leading companies in the Ultrasonic Cooling Meters Market?
Which region commanded the largest share of the Ultrasonic Cooling Meters Market in 2024?
Table of Content
Chapter 1. Report Introduction
- 1.1 Report Description & Purpose
- 1.1.1 Report Title & Market Definition
- 1.1.2 Unique Selling Propositions (USP) & Key Differentiators
- 1.1.3 Value Proposition for Stakeholders
- 1.2 Research Objectives
- 1.2.1 Market Sizing Objectives (Volume & Revenue)
- 1.2.2 Segmentation Objectives
- 1.2.3 Competitive Intelligence Objectives
- 1.2.4 Forecast & Scenario Objectives
- 1.3 Report Scope
- 1.3.1 Ultrasonic Cooling Meters Scope – Types & Subtypes Covered
- 1.3.2 Geographic Scope – Regions & Countries Covered
- 1.3.3 Historical Period, Base Year & Forecast Period (2024; forecast to 2032)
- 1.3.4 Inclusions & Exclusions
- 1.4 HS Code & Classification Framework
- 1.5 Currency, Units & Pricing Basis
- 1.6 Target Stakeholders
- 1.7 Limitations & Assumptions
Chapter 2. Executive Summary
- 2.1 Global Ultrasonic Cooling Meters Market Snapshot
- 2.1.1 Market Size – Historical (2024) & Forecast (2024-2032) (2024: USD 157 million → 2032: USD 297.1 million)
- 2.1.2 Volume & Revenue – Global Totals
- 2.1.3 Key Market Highlights – Top Five Facts
- 2.2 Ultrasonic Cooling Meters Market Segmentation Snapshot
- 2.2.1 Market Split by Region – 2024 vs. 2032
- 2.3 Competitive Snapshot
- 2.3.1 Top 10 Players by Revenue Share – 2024
- 2.3.2 Top 10 Players by Volume Share – 2024
- 2.3.3 Recent Strategic Developments (18-Month Summary)
- 2.4 Key Investment Highlights & Strategic Conclusions
Chapter 3. Ultrasonic Cooling Meters Market Dynamics & Industry Analysis
- 3.1 Market Overview & Context
- 3.1.1 Ultrasonic Cooling Meters Market Position in the Broader Automotive Value Chain
- 3.1.2 OEM vs. Replacement Market Dynamics
- 3.1.3 Market Maturity & Development Stage by Region
- 3.2 Ultrasonic Cooling Meters Market Drivers
- 3.3 Ultrasonic Cooling Meters Market Restraints & Challenges
- 3.4 Ultrasonic Cooling Meters Market Opportunities
- 3.5 Porter's Five Forces Analysis
- 3.5.1 Threat of New Entrants
- 3.5.2 Bargaining Power of Suppliers
- 3.5.3 Bargaining Power of Buyers
- 3.5.4 Threat of Substitutes
- 3.5.5 Competitive Rivalry – Intensity Assessment
- 3.6 Ultrasonic Cooling Meters Value Chain Analysis
- 3.6.1 Upstream – Raw Material/Input Suppliers
- 3.6.1.1 Raw Material/Input 1
- 3.6.1.2 Raw Material/Input 2
- 3.6.1.3 Raw Material/Input 3
- 3.6.2 Midstream – Production/Manufacturing/Service Delivery
- 3.6.2.1 Production/Process Overview
- 3.6.2.2 Key Facility Locations & Capacity by Manufacturer
- 3.6.3 Downstream – Distribution & End Consumer
- 3.6.3.1 Primary Channel – B2B/OEM
- 3.6.3.2 Secondary Channels – Dealer, Retail, Online, Direct
- 3.6.4 Value Chain Profitability Analysis
- 3.6.1 Upstream – Raw Material/Input Suppliers
- 3.7 PESTEL Analysis
- 3.7.1 Political Factors
- 3.7.2 Economic Factors
- 3.7.3 Social Factors
- 3.7.4 Technological Factors
- 3.7.5 Environmental Factors
- 3.7.6 Legal Factors
- 3.8 Ultrasonic Cooling Meters Supply Chain Analysis
- 3.8.1 Raw Material/Input Supply Risk Assessment
- 3.8.2 Manufacturing Concentration Risk (Geographic Exposure)
- 3.8.3 Trade Disruption Impact Analysis
- 3.9 Regulatory & Policy Landscape
Note: The regulatory and policy landscape section covers regulations based on their applicability to the market, Ultrasonic Cooling Meters category, geography, and scope of the study. Only regulatory frameworks with a material impact on operations, compliance, trade, sustainability, or market access are analyzed in detail.
Chapter 4. Key Investment Pockets & Opportunity Analysis
- 4.1 Ultrasonic Cooling Meters Market Attractiveness Analysis
- 4.1.1 By Region – Investment Attractiveness Matrix (Volume × CAGR)
- 4.2 Absolute Revenue Growth Opportunity
- 4.2.1 By Region – Absolute USD Growth Through 2032
- 4.3 Incremental Volume Opportunity
- 4.3.1 By Region – Incremental Volume Through 2032
- 4.3.2 Segment – Incremental Volume
- 4.4 Emerging Submarket Opportunity Deep Dive (Subject to Applicability)
- 4.5 Emerging Market Opportunity Scorecards
- 4.5.1 United States
- 4.5.2 Europe
- 4.5.3 Asia
- 4.5.4 Middle East & Africa
Note: Emerging Market Opportunity Scorecards will be included based on relevance and strategic importance. Regions listed are indicative and may vary depending on data availability and market dynamics.
Chapter 5. Ultrasonic Cooling Meters Import-Export Analysis & Trade Flows
- 5.1 Global Trade Overview
- 5.1.1 Global Export Value by Country (2024)
- 5.1.2 Global Export Volume by Country (2024)
- 5.1.3 Global Import Value by Country (2024)
- 5.1.4 Global Import Volume by Country (2024)
- 5.1.5 Net Trade Balance by Country (2024)
- 5.2 Export Analysis – Segment
- 5.2.1 Type 1 (HS Code)
- 5.2.2 Type 2 (HS Code)
- 5.2.3 Type 3 (HS Code)
- 5.2.4 Type 4 (HS Code)
- 5.2.5 Type 5 (HS Code)
- 5.3 Import Analysis – Segment
- 5.3.1 Type 1 (HS Code)
- 5.3.2 Type 2 (HS Code)
- 5.3.3 Type 3 (HS Code)
- 5.3.4 Type 4 (HS Code)
- 5.3.5 Type 5 (HS Code)
- 5.4 Average Unit Trade Prices
- 5.4.1 Average Export Price – Segment & Country
- 5.4.2 Average Import Price – Segment & Source Country
- 5.4.3 Price Trends (2024)
- 5.5 Key Trade Route Analysis
- 5.5.1 Trade Route 1
- 5.5.2 Trade Route 2
- 5.5.3 Trade Route 3
- 5.5.4 Trade Route 4
- 5.5.5 Trade Route 5
- 5.6 Trade Policy Impact Assessment
- 5.6.1 US Anti-Dumping & Section 301 Tariffs
- 5.6.2 EU Customs Union Impact
- 5.6.3 Major Free Trade Agreements
- 5.6.4 USMCA Rules of Origin
Note: Trade policy analysis will be included only where relevant to the Ultrasonic Cooling Meters market.
Chapter 6. Competitive Landscape & Company Benchmarking
- 6.1 Ultrasonic Cooling Meters Market Concentration & Structure
- 6.1.1 Herfindahl-Hirschman Index (HHI) – vs. 2024
- 6.1.2 Tier 1, Tier 2 & Tier 3 Market Structure
- 6.1.3 Global, Regional & Local Player Dynamics
- 6.2 Ultrasonic Cooling Meters Market Share Analysis – 2024
- 6.2.1 Global Revenue Share by Company
- 6.2.2 Global Volume Share by Company
- 6.2.3 Regional Revenue Share
- 6.2.4 Market Share Evolution ( vs. 2024)
- 6.2.5 OEM Segment Share by Company
- 6.2.6 Replacement Segment Share by Company
- 6.3 Production/Delivery Capacity & Facility Analysis
- 6.3.1 Global Installed Capacity
- 6.3.2 Capacity Utilization Rates
- 6.3.3 Production/Output Volume
- 6.3.4 Facility Locations & Capacity Map
- 6.3.5 Planned Capacity Additions
- 6.4 Ultrasonic Cooling Meters Competitive Benchmarking Matrix
- 6.4.1 Revenue, Volume, CAGR & Profitability Comparison
- 6.4.2 Channel Revenue Mix
- 6.4.3 Geographic Revenue Exposure
- 6.4.4 R&D Intensity
- 6.4.5 Sustainability Maturity
- 6.5 Strategic Developments in Ultrasonic Cooling Meters (Last 24 Months)
- 6.5.1 Mergers, Acquisitions & Divestments
- 6.5.2 New Ultrasonic Cooling Meters Launches
- 6.5.3 Facility Expansions
- 6.5.4 Strategic Alliances, Joint Ventures & Partnerships
- 6.5.5 Distribution Expansion & Market Entry
- 6.5.6 Sustainability & ESG Initiatives
- 6.6 Competitive Strategy Mapping
- 6.6.1 Leader, Challenger, Follower & Niche Classification
- 6.6.2 Pricing Strategy Comparison
- 6.6.3 Channel Strategy Matrix
Note: Strategic developments are included based on their materiality and the availability of reliable information.
Chapter 7. Global Ultrasonic Cooling Meters Market – By Distribution Channel
- 7.1 Segment Overview
- 7.1.1 Volume & Revenue Split by Channel (2024 & 2032)
- 7.1.2 Channel Mix Evolution (2024-2032)
Chapter 8. Regional Market Analysis – Global Overview
- 8.1 Global Regional Overview
- 8.1.1 Regional Volume Share
- 8.1.2 Regional Revenue Share
- 8.1.3 Regional Volume by Region
- 8.1.4 Regional Revenue by Region
- 8.1.5 Regional Forecast Through 2032
- 8.2 Cross-Regional Segment Analysis
- 8.2.1 By Distribution Channel
- 8.2.2 By Brand/Price Tier
Chapter 9. North America Ultrasonic Cooling Meters Market
- 9.1 United States
- 9.2 Canada
- 9.3 Mexico
Chapter 10. Europe Ultrasonic Cooling Meters Market
- 10.1 Germany
- 10.2 France
- 10.3 Italy
- 10.4 United Kingdom
- 10.5 Spain
- 10.6 Poland
- 10.7 Russia
- 10.8 Netherlands
- 10.9 Belgium
- 10.10 Sweden
- 10.11 Denmark
- 10.12 Norway
- 10.13 Rest of Europe
Chapter 11. Asia Pacific Ultrasonic Cooling Meters Market
- 11.1 China
- 11.2 India
- 11.3 Japan
- 11.4 South Korea
- 11.5 Thailand
- 11.6 Indonesia
- 11.7 Vietnam
- 11.8 Malaysia
- 11.9 Australia
- 11.10 Rest of Asia Pacific
Chapter 12. Latin America Ultrasonic Cooling Meters Market
- 12.1 Brazil
- 12.2 Argentina
- 12.3 Colombia
- 12.4 Chile
- 12.5 Rest of Latin America
Chapter 13. Middle East Ultrasonic Cooling Meters Market
- 13.1 Saudi Arabia
- 13.2 United Arab Emirates
- 13.3 Turkey
- 13.4 Israel
- 13.5 Iran
- 13.6 Rest of the Middle East
Chapter 14. Africa Ultrasonic Cooling Meters Market
- 14.1 South Africa
- 14.2 Egypt
- 14.3 Nigeria
- 14.4 Morocco
- 14.5 Rest of Africa
Chapter 15. Ultrasonic Cooling Meters Company Profiles
- 15.1 [Company 01]
- 15.1.1 Company Overview
- 15.1.2 Key Management Personnel
- 15.1.3 Products & Services Portfolio
- 15.1.4 Financial Performance
- 15.1.5 Key Market Focus & Geographic Presence
- 15.1.6 Recent Developments & Strategic Initiatives
Note: The company profile list is preliminary and may change based on research findings, market developments, data availability, and client requirements.
Chapter 16. Appendices
- Appendix A – List of Abbreviations & Acronyms
- Appendix B – Industry Classification Code Reference – Full Series
- Appendix C – Production & Capacity Data Tables
- Appendix D – End-Use & Demand Base Tables
- Appendix E – Consumption & Replacement Rate Assumptions
- Appendix F – ASP Reference Tables
- Appendix G – Manufacturing & Facility Database
- Appendix H – Import-Export Data Tables
- Appendix I – Regulatory Summary Tables
- Appendix J – Primary Research Participant List (Anonymized)
- Appendix K – Primary Research Questionnaire Framework
- Appendix L – Data Sources & Bibliography
- Appendix M – Market Size Divergence & Source Comparison
Chapter 17. Research Methodology
- 17.1 Research Framework & Philosophy
- 17.2 Secondary Research – Sources, Hierarchy & Data Extraction
- 17.3 Data Modeling – Bottom-Up & Top-Down Market Sizing
- 17.4 Primary Research – Stakeholder Framework, LOI & Sample Sizes
- 17.5 Forecast Methodology – Regression, Scenario & Sensitivity Analysis
- 17.6 Quality Control – Four-Layer Validation Framework
- 17.7 Limitations & Standard Assumptions
- 17.8 Disclaimer
