
Market Overview:
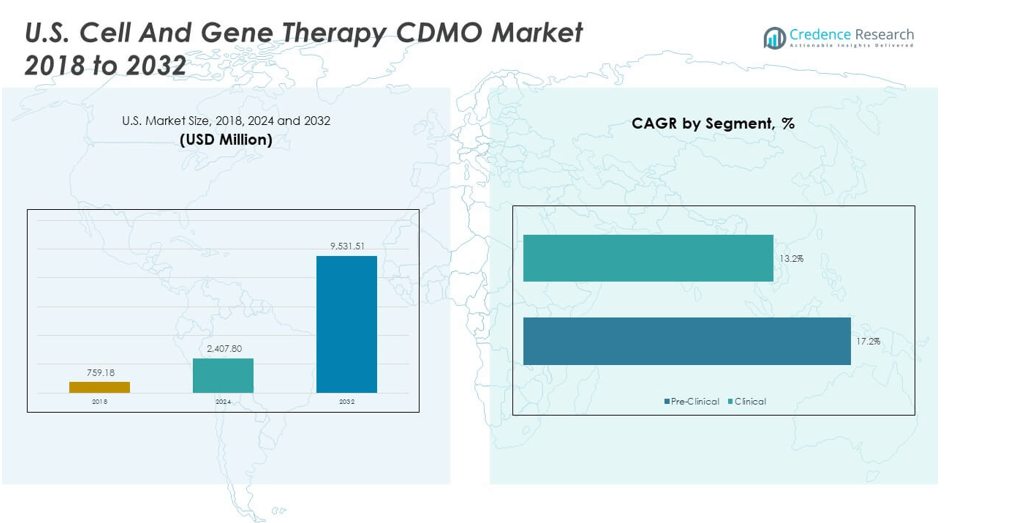
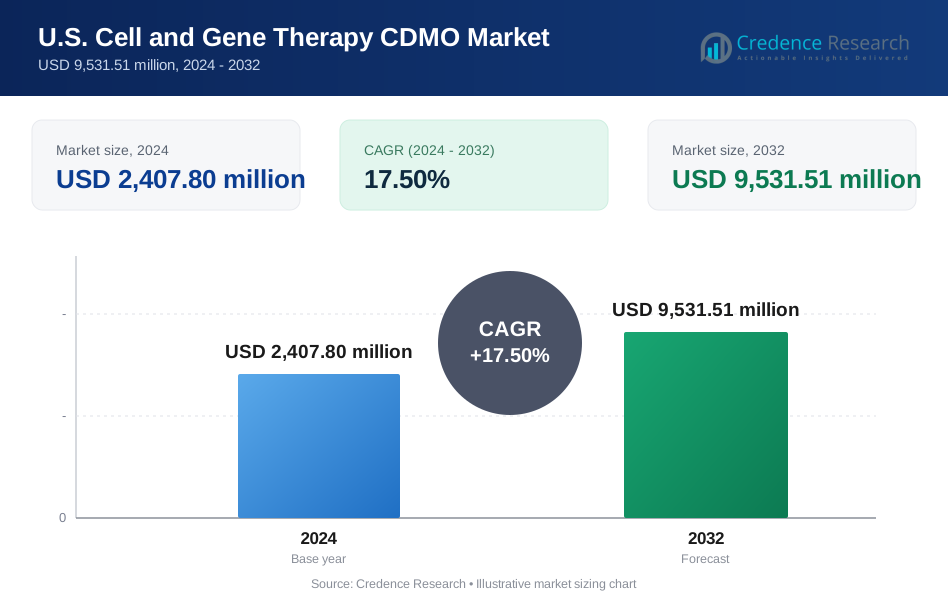
The U.S. Cell and Gene Therapy CDMO Market size was valued at USD 759.18 million in 2018 to USD 2,407.80 million in 2024 and is anticipated to reach USD 9,531.51 million by 2032, at a CAGR of 17.50% during the forecast period.
| REPORT ATTRIBUTE | DETAILS |
|---|---|
| Historical Period | 2020-2023 |
| Base Year | 2024 |
| Forecast Period | 2025-2032 |
| U.S. Cell and Gene Therapy CDMO Market Size 2024 | USD 2,407.80 million |
| U.S. Cell and Gene Therapy CDMO Market, CAGR | 17.50% |
| U.S. Cell and Gene Therapy CDMO Market Size 2032 | USD 9,531.51 million |
The market is driven by increasing demand for advanced therapeutic solutions, with biopharmaceutical companies focusing on cell and gene therapies as breakthrough treatments. Rising prevalence of chronic and genetic disorders has accelerated the need for CDMO services that provide specialized expertise in development and manufacturing. The surge in clinical trials, along with regulatory support for innovative therapies, further strengthens growth. Outsourcing to CDMOs helps reduce development timelines, optimize manufacturing costs, and ensure compliance with evolving quality standards, making these partnerships essential for both large pharmaceutical firms and emerging biotech players.
Geographically, the U.S. remains a leading market due to its strong biotechnology ecosystem, presence of established CDMOs, and favorable regulatory framework that supports therapy commercialization. Europe shows steady adoption, driven by investments in research infrastructure and collaborative networks. Meanwhile, Asia-Pacific is emerging rapidly, fueled by government initiatives, growing clinical research activities, and rising healthcare investments. Countries like China, South Korea, and Japan are becoming vital hubs for therapy development, creating new opportunities for CDMOs to expand their global reach and capabilities.
Market Insights:
- The U.S. Cell And Gene Therapy CDMO Market was valued at USD 759.18 million in 2018, reached USD 2,407.80 million in 2024, and is projected to attain USD 9,531.51 million by 2032, advancing at a CAGR of 17.50%.
- The Northeast (38%), Midwest (27%), and West (22%) hold the top shares, driven by strong biotech clusters, research hubs, and capital investment that secure their leadership.
- The South (13%) emerges as the fastest-growing region, supported by infrastructure expansion, clinical trial networks, and rising investments in states like Texas and North Carolina.
- By phase, the clinical segment dominates with 76% share, reflecting extensive late-stage trials and commercial-scale activity across oncology and rare diseases.
- The pre-clinical segment accounts for 24%, emphasizing the critical role of CDMOs in early-stage development, research, and process optimization.
Market Drivers:
Rising Adoption of Outsourced Expertise to Accelerate Biopharma Development
The U.S. Cell and Gene Therapy CDMO Market benefits from strong reliance on outsourcing models where pharmaceutical and biotech companies seek specialized partners to manage development and production. Rising costs and long timelines for internal infrastructure push firms to depend on CDMOs with advanced capabilities. It provides access to technical know-how, regulatory compliance, and state-of-the-art facilities without heavy upfront investment. The demand for complex processes involving viral vectors and cell lines strengthens the outsourcing framework. Biopharma firms prioritize CDMOs to scale operations quickly while maintaining high quality. Growing pipelines of cell and gene therapies create urgency for scalable solutions. Regulatory bodies encourage partnerships that improve efficiency. This driver places CDMOs at the center of innovation and commercialization.
Expansion of Clinical Trials and Rapid Growth in Innovative Therapies
The U.S. Cell and Gene Therapy CDMO Market experiences robust growth due to the rising number of clinical trials targeting rare diseases and cancers. Increasing demand for novel therapies requires specialized manufacturing services across different trial phases. It creates strong opportunities for CDMOs to support early-stage development and late-phase commercial supply. Firms engage CDMOs for their proven ability to deliver GMP-compliant products for regulatory approval. Growing investments in clinical research emphasize reliable manufacturing capacity. Expansion of investigational therapies highlights the importance of end-to-end services from development through commercialization. Outsourcing strengthens timelines and provides scalability for unpredictable clinical outcomes. These dynamics firmly drive the reliance on CDMOs in this sector.
- For instance, Lonza serves over 500 active licensing customers and supports more than 200 research evaluation agreements as of 2024. The company’s mammalian gene expression technology underpins over 85 approved therapeutics reaching millions of patients worldwide each year.
Regulatory Support and Evolving Quality Standards Supporting Growth
The U.S. Cell and Gene Therapy CDMO Market gains momentum from favorable regulatory frameworks designed to fast-track innovative therapies. Agencies like the FDA provide accelerated pathways for advanced treatments addressing unmet medical needs. It encourages pharmaceutical firms to partner with CDMOs capable of ensuring compliance under evolving guidelines. Heightened emphasis on patient safety pushes CDMOs to maintain rigorous standards and validated processes. This ensures therapies progress smoothly through approvals without delays. Constant updates in global compliance norms increase the demand for experienced manufacturing partners. Stronger oversight creates opportunities for CDMOs with established track records. Regulatory clarity directly strengthens growth and enhances investor confidence in this market.
- For example, WuXi Advanced Therapies’ Philadelphia site spans over 400,000 square feet and in February 2024 became the first U.S. third-party CTDMO approved by the FDA to manufacture and test AMTAGVI, the first individualized T-cell therapy for solid tumors. The facility is designed to support treatment capacity for several thousand patients annually.
Rising Incidence of Genetic Disorders and Chronic Diseases Fueling Demand
The U.S. Cell and Gene Therapy CDMO Market witnesses expanding demand due to increasing cases of rare genetic conditions and chronic diseases. High disease burden requires new treatment approaches beyond traditional pharmaceuticals. It positions cell and gene therapies as transformative solutions with high success potential. This surge in patient needs aligns with CDMOs offering scalable production for diverse therapeutic modalities. Rising awareness and patient advocacy groups strengthen market confidence in advanced treatments. Continuous innovation ensures therapies address broader indications beyond rare disorders. Demand for high-quality manufacturing increases with each approved therapy. This dynamic ensures CDMOs remain vital contributors to healthcare advancements.
Market Trends:
Growing Use of Automation and Digital Technologies in Manufacturing Processes
The U.S. Cell and Gene Therapy CDMO Market is witnessing adoption of automation and digital systems to enhance productivity. CDMOs deploy robotics, AI-driven analytics, and digital twins to streamline production. It reduces errors, minimizes downtime, and ensures higher reproducibility in complex processes. Growing focus on data integrity strengthens reliance on advanced digital platforms. Digital systems help predict equipment failures and improve process monitoring. This shift reduces human error in sensitive cell-based workflows. Companies invest in integrated platforms for secure data handling. These advancements redefine operational models in modern biomanufacturing.
Rising Investments in Specialized Facilities and Advanced Infrastructure
The U.S. Cell and Gene Therapy CDMO Market sees continuous expansion of facilities designed for complex therapy production. CDMOs build modular cleanrooms, high-capacity viral vector suites, and flexible bioreactor systems. It allows quick adaptation to varied client requirements. Growing demand for commercial-scale supply pushes firms to invest heavily in infrastructure. Expansion strategies target both small-scale pilot projects and large-scale production. Flexible design helps CDMOs manage diverse pipelines efficiently. Investment in advanced containment systems ensures compliance with biosafety regulations. These trends highlight the focus on readiness for next-generation therapies.
- For example, Catalent invested USD 230 million in 2021 to expand its Harmans, Maryland gene therapy campus, adding three commercial-scale viral vector suites and enhanced infrastructure. The redesigned facility will total 18 CGMP suites with capacity for multiple 2,000 L bioreactors, enabling end-to-end commercial manufacturing.
Emergence of Strategic Partnerships and Industry Collaborations
The U.S. Cell and Gene Therapy CDMO Market benefits from rising partnerships between CDMOs, biotech firms, and research organizations. Collaborations accelerate innovation while sharing risks and resources. It creates a network of expertise driving faster development. Companies join forces to co-develop technologies and expand service portfolios. Collaborative models strengthen capacity for clinical and commercial requirements. Partnerships also improve global supply chain reliability. Joint ventures allow smaller biotechs to access advanced capabilities. These relationships enhance CDMO competitiveness and market positioning.
Increasing Focus on Personalized and Patient-Centric Therapies
The U.S. Cell and Gene Therapy CDMO Market experiences a shift toward personalized medicines tailored for individual patients. CDMOs adapt workflows to accommodate small-batch and highly specific therapies. It requires flexible systems to handle customized formulations and delivery models. Growing interest in autologous therapies amplifies the need for precision-based manufacturing. Personalized approaches strengthen outcomes and patient satisfaction. CDMOs respond by developing platforms that reduce turnaround times. Regulatory focus supports scalable personalized solutions. These advancements highlight the industry’s move toward patient-centric innovation.
- For instance, WuXi Advanced Therapies introduced a fully integrated closed-process CAR-T manufacturing platform that standardizes key steps such as cell isolation, transduction, expansion, and fill/finish, enabling more predictable workflows and supporting accelerated development and GMP manufacturing timelines.
Market Challenges Analysis:
High Manufacturing Complexity and Capital-Intensive Infrastructure
The U.S. Cell and Gene Therapy CDMO Market faces challenges tied to the intricate nature of therapy production. Viral vector manufacturing, cell line development, and quality testing demand highly specialized knowledge. It requires advanced facilities with stringent biosafety standards, making infrastructure investment extremely costly. Smaller firms often struggle to fund such projects, leading to limited access. Complexity in scaling processes adds further risk to production timelines. Uncertainty in therapy outcomes increases operational challenges for CDMOs. Securing skilled labor with niche expertise remains difficult. These barriers hinder seamless growth despite strong demand.
Supply Chain Constraints and Stringent Compliance Requirements
The U.S. Cell and Gene Therapy CDMO Market also contends with supply chain inefficiencies and material shortages. Limited global availability of high-quality raw materials creates bottlenecks. It affects lead times for critical production runs. Regulatory compliance requires consistent documentation and validation, adding administrative burden. Constant updates in guidelines force CDMOs to revise processes quickly. Balancing scalability while maintaining strict quality assurance presents ongoing difficulties. Shortages of skilled personnel for regulatory and operational roles amplify challenges. These issues restrict the speed of therapy commercialization and service expansion
Market Opportunities:
Growing Demand for Commercial-Scale Manufacturing and End-to-End Services
The U.S. Cell and Gene Therapy CDMO Market holds significant opportunity as demand shifts from clinical-scale to commercial-scale production. Expanding approvals for therapies require large-batch, GMP-compliant capabilities. It encourages CDMOs to position themselves as full-service partners providing development through commercial supply. Firms offering integrated services gain competitive advantage by reducing client dependency on multiple vendors. Expanding pipelines strengthen demand for scalable, flexible, and efficient facilities. This opportunity drives consolidation and strategic expansions in the market.
Expansion into Emerging Global Markets for Advanced Therapeutics
The U.S. Cell and Gene Therapy CDMO Market also finds opportunity in expanding into global markets where advanced therapies gain traction. Asia-Pacific and Latin America show growing healthcare investments and supportive policies. It enables CDMOs to extend services beyond domestic clients. Strategic entry into these regions strengthens long-term growth potential. Rising partnerships with local players create reliable entry channels. Firms tapping into emerging markets gain visibility, diversify risks, and expand client portfolios. These opportunities solidify the market’s global positioning.
Market Segmentation Analysis:
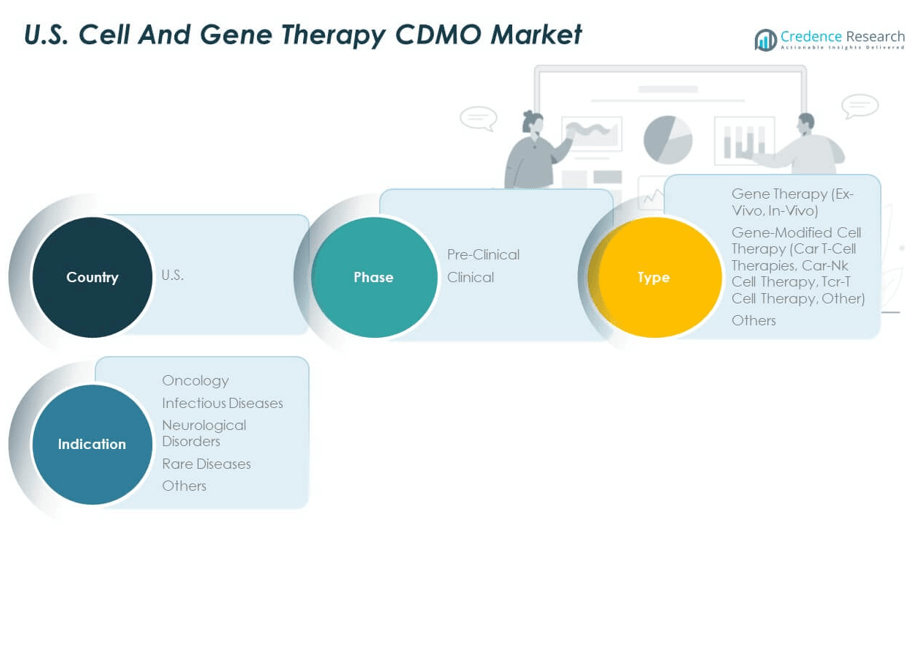
The U.S. Cell and Gene Therapy CDMO Market demonstrates significant growth across phase, type, and indication categories.
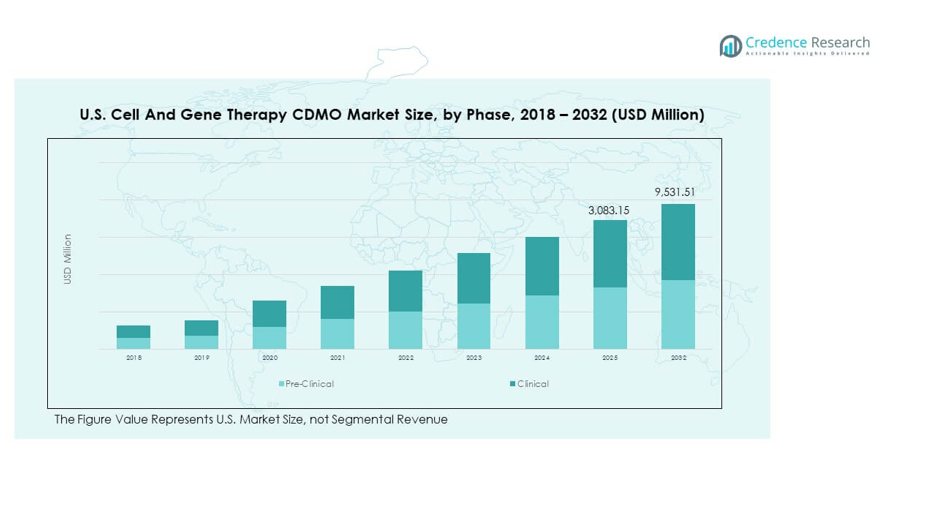
By phase, the clinical segment dominates due to the increasing number of therapies advancing into mid- and late-stage trials. Pre-clinical services remain critical, supporting early research and process development for a growing pipeline of innovative therapies. It reflects the sector’s reliance on CDMOs to accelerate the transition from discovery to commercial readiness.
- For example, as of Q2 2024, the gene therapy pipeline remained active, with a strong concentration of candidates in preclinical stages and an increase in Phase I trials. While the number of Phase II and III candidates declined, early-stage development sustained momentum. Industry reports confirm these trends as credible references for tracking cell and gene therapy progress.
By type, gene therapy continues to expand, with ex-vivo approaches gaining prominence for precision in targeted diseases and in-vivo therapies addressing broader patient populations. Gene-modified cell therapy leads with CAR T-cell therapies, widely adopted for hematological cancers, while CAR-NK and TCR-T cell therapies show strong future potential. It highlights the diversification of treatment modalities that require advanced and flexible CDMO capabilities.
- For instance, As of December 2024, the U.S. FDA had approved six CAR T-cell therapies, which predominantly target the CD19 and BCMA antigens for treating hematologic cancers. Additionally, by the same period, ten CAR T-cell products were commercially available globally, with more than 600 CAR-T clinical trials ongoing worldwide.
By indication, oncology holds the largest share due to strong demand for advanced therapies treating various cancers. Infectious diseases represent a rising segment with CDMOs supporting vaccine-related development. Neurological disorders and rare diseases are growing areas, driven by unmet medical needs and supportive regulatory pathways. It reflects a broad therapeutic landscape where CDMOs play a central role in scaling, manufacturing, and ensuring compliance across highly specialized treatment categories.
Segmentation:
By Phase
- Pre-Clinical
- Clinical
By Type
- Gene Therapy
- Ex-Vivo
- In-Vivo
- Gene-Modified Cell Therapy
- CAR T-Cell Therapies
- CAR-NK Cell Therapy
- TCR-T Cell Therapy
- Others
- Others
By Indication
- Oncology
- Infectious Diseases
- Neurological Disorders
- Rare Diseases
- Others
Regional Analysis:
The U.S. Cell and Gene Therapy CDMO Market is shaped by distinct subregional dynamics across the country. The Northeast holds the largest share at 38%, supported by strong clusters of biotechnology companies, academic institutions, and regulatory bodies. Boston and Cambridge serve as key hubs for cell and gene therapy innovation, driving heavy reliance on CDMOs for research and commercial production. It benefits from a highly skilled workforce and advanced infrastructure that supports both early-stage trials and large-scale manufacturing. Strategic collaborations between biopharma firms and CDMOs further strengthen the Northeast’s leadership position. This region continues to dominate investments, partnerships, and approvals within the market.
The Midwest accounts for 27% of the market, driven by its expanding biomanufacturing base and supportive healthcare ecosystem. States like Illinois and Michigan are building advanced facilities that strengthen the region’s competitiveness. It benefits from relatively lower operating costs, making the Midwest attractive for scaling clinical and commercial production. Collaborations with local research institutions enhance the region’s ability to serve diverse therapeutic pipelines. The presence of established CDMOs fosters a stable environment for both domestic and international partnerships. This share reflects the region’s growing role in advancing the country’s biomanufacturing capacity.
The West represents 22% of the market, supported by innovation hubs in California that contribute heavily to the biotech ecosystem. Strong venture capital activity and a focus on next-generation therapies drive consistent growth. It provides CDMOs with opportunities to expand into specialized capabilities, particularly in cell-based therapies. Partnerships between academic centers and industry players accelerate pipeline development and commercialization. The South contributes the remaining 13%, supported by rising investments in emerging hubs like Texas and North Carolina. This region benefits from a strategic focus on infrastructure expansion and clinical trial networks. Together, these subregions highlight the distributed strengths that sustain growth across the U.S. Cell and Gene Therapy CDMO Market.
Key Player Analysis:
- Lonza Group AG
- Catalent, Inc.
- Thermo Fisher Scientific
- Charles River Laboratories
- Cytiva
- Cellares
- FUJIFILM Diosynth Biotechnologies
- Minaris Regenerative Medicine
- Resilience
- Lykan Bioscience
Competitive Analysis:
The U.S. Cell and Gene Therapy CDMO Market is highly competitive, with both global leaders and specialized domestic firms establishing strong positions. Lonza Group, Catalent, and Thermo Fisher Scientific dominate through extensive service portfolios covering development, clinical supply, and commercial manufacturing. It leverages scale, global infrastructure, and advanced technologies to serve a wide range of clients. Companies such as Charles River Laboratories, Cytiva, and FUJIFILM Diosynth Biotechnologies enhance competitiveness through focused expertise in process development and viral vector manufacturing. Emerging firms like Cellares and Lykan Bioscience expand market presence with automated platforms and flexible manufacturing solutions that cater to personalized therapies. The market is defined by strategic collaborations, acquisitions, and geographic expansion aimed at strengthening capabilities and client networks. It reflects a trend where established players invest in scaling facilities while smaller CDMOs emphasize niche expertise. Competitive dynamics are shaped by the growing need for compliance, speed to market, and integrated service offerings. Companies that demonstrate reliability in regulatory approvals, flexible platforms, and end-to-end solutions secure long-term partnerships. This evolving landscape underscores the importance of innovation, strategic alliances, and sustained investment, keeping competition intense across the U.S. Cell and Gene Therapy CDMO Market.
Recent Developments:
- In June 2025, ProBio, a global CDMO specializing in cell and gene therapy, announced the opening of its flagship U.S. plasmid and viral vector manufacturing facility in Hopewell, New Jersey. The newly launched site is intended to enhance ProBio’s capacity to support advanced cell and gene therapy development, highlighting ongoing investments in next-generation manufacturing infrastructure within the United States.
- In May 2025, Minaris Advanced Therapies was officially launched as a leading global cell therapy CDMO and testing partner. This event marked the combination of Minaris Regenerative Medicine, along with the U.S. and U.K. operations of WuXi Advanced Therapies, under strategic acquisitions by the investment firm Altaris.
- In April 2025, Artis BioSolutions, a newly launched cell and gene therapy CDMO, made headlines with the acquisition of Landmark Bio. This deal strengthens Artis BioSolutions’ presence in the cell and gene therapy manufacturing sector by leveraging Landmark Bio’s expertise and infrastructure.
Report Coverage:
The research report offers an in-depth analysis based on Phase, Type and Indication. It details leading market players, providing an overview of their business, product offerings, investments, revenue streams, and key applications. Additionally, the report includes insights into the competitive environment, SWOT analysis, current market trends, as well as the primary drivers and constraints. Furthermore, it discusses various factors that have driven market expansion in recent years. The report also explores market dynamics, regulatory scenarios, and technological advancements that are shaping the industry. It assesses the impact of external factors and global economic changes on market growth. Lastly, it provides strategic recommendations for new entrants and established companies to navigate the complexities of the market.
Future Outlook:
- The U.S. Cell and Gene Therapy CDMO Market will expand as more therapies move from clinical to commercial scale.
- Increasing partnerships between biopharma firms and CDMOs will create stronger networks for innovation.
- Digital technologies and automation will transform manufacturing efficiency and reduce operational risks.
- Personalized therapies will drive demand for flexible, small-batch production capabilities across CDMOs.
- Regulatory clarity will accelerate adoption of advanced therapies while pushing CDMOs to strengthen compliance.
- Investment in specialized facilities will enhance capacity for complex viral vector and cell-based platforms.
- Expansion into new indications will broaden the scope of therapies supported by CDMOs.
- Supply chain resilience will become a key priority to address raw material shortages.
- Strategic mergers and acquisitions will continue to consolidate the market and expand service portfolios.
- Strong demand for integrated end-to-end solutions will shape the competitive positioning of CDMOs.
Request a Free Sample
Fill in your details and we'll send you a free sample report.
- Sample data tables & charts
- Research methodology
Need a Custom Version of This Report?
Tailor the scope, geography, or segments to your exact requirements.
- Custom geography or segment scope
- Direct access to our analyst team
Frequently Asked Questions
What is the current market size for U.S. Cell And Gene Therapy CDMO Market, and what is its projected size in 2032?
At what Compound Annual Growth Rate is the U.S. Cell And Gene Therapy CDMO Market projected to grow between 2024 and 2032?
What are the primary factors fueling the growth of the U.S. Cell And Gene Therapy CDMO Market?
Who are the leading companies in the U.S. Cell And Gene Therapy CDMO Market?
Table of Content
Chapter 1. Report Introduction
- 1.1 Report Description & Purpose
- 1.1.1 Report Title & Market Definition
- 1.1.2 Unique Selling Propositions (USP) & Key Differentiators
- 1.1.3 Value Proposition for Stakeholders
- 1.2 Research Objectives
- 1.2.1 Market Sizing Objectives (Volume & Revenue)
- 1.2.2 Segmentation Objectives
- 1.2.3 Competitive Intelligence Objectives
- 1.2.4 Forecast & Scenario Objectives
- 1.3 Report Scope
- 1.3.1 U.S. Cell and Gene Therapy CDMO Scope – Types & Subtypes Covered
- 1.3.2 Geographic Scope – Regions & Countries Covered
- 1.3.3 Historical Period, Base Year & Forecast Period (2024; forecast to 2032)
- 1.3.4 Inclusions & Exclusions
- 1.4 HS Code & Classification Framework
- 1.5 Currency, Units & Pricing Basis
- 1.6 Target Stakeholders
- 1.7 Limitations & Assumptions
Chapter 2. Executive Summary
- 2.1 Global U.S. Cell and Gene Therapy CDMO Market Snapshot
- 2.1.1 Market Size – Historical (2024) & Forecast (2024-2032) (2024: USD 2,407.80 million → 2032: USD 9,531.51 million)
- 2.1.2 Volume & Revenue – Global Totals
- 2.1.3 Key Market Highlights – Top Five Facts
- 2.2 U.S. Cell and Gene Therapy CDMO Market Segmentation Snapshot
- 2.2.1 Market Split by Region – 2024 vs. 2032
- 2.3 Competitive Snapshot
- 2.3.1 Top 10 Players by Revenue Share – 2024
- 2.3.2 Top 10 Players by Volume Share – 2024
- 2.3.3 Recent Strategic Developments (18-Month Summary)
- 2.4 Key Investment Highlights & Strategic Conclusions
Chapter 3. U.S. Cell and Gene Therapy CDMO Market Dynamics & Industry Analysis
- 3.1 Market Overview & Context
- 3.1.1 U.S. Cell and Gene Therapy CDMO Market Position in the Broader Automotive Value Chain
- 3.1.2 OEM vs. Replacement Market Dynamics
- 3.1.3 Market Maturity & Development Stage by Region
- 3.2 U.S. Cell and Gene Therapy CDMO Market Drivers
- 3.3 U.S. Cell and Gene Therapy CDMO Market Restraints & Challenges
- 3.4 U.S. Cell and Gene Therapy CDMO Market Opportunities
- 3.5 Porter's Five Forces Analysis
- 3.5.1 Threat of New Entrants
- 3.5.2 Bargaining Power of Suppliers
- 3.5.3 Bargaining Power of Buyers
- 3.5.4 Threat of Substitutes
- 3.5.5 Competitive Rivalry – Intensity Assessment
- 3.6 U.S. Cell and Gene Therapy CDMO Value Chain Analysis
- 3.6.1 Upstream – Raw Material/Input Suppliers
- 3.6.1.1 Raw Material/Input 1
- 3.6.1.2 Raw Material/Input 2
- 3.6.1.3 Raw Material/Input 3
- 3.6.2 Midstream – Production/Manufacturing/Service Delivery
- 3.6.2.1 Production/Process Overview
- 3.6.2.2 Key Facility Locations & Capacity by Manufacturer
- 3.6.3 Downstream – Distribution & End Consumer
- 3.6.3.1 Primary Channel – B2B/OEM
- 3.6.3.2 Secondary Channels – Dealer, Retail, Online, Direct
- 3.6.4 Value Chain Profitability Analysis
- 3.6.1 Upstream – Raw Material/Input Suppliers
- 3.7 PESTEL Analysis
- 3.7.1 Political Factors
- 3.7.2 Economic Factors
- 3.7.3 Social Factors
- 3.7.4 Technological Factors
- 3.7.5 Environmental Factors
- 3.7.6 Legal Factors
- 3.8 U.S. Cell and Gene Therapy CDMO Supply Chain Analysis
- 3.8.1 Raw Material/Input Supply Risk Assessment
- 3.8.2 Manufacturing Concentration Risk (Geographic Exposure)
- 3.8.3 Trade Disruption Impact Analysis
- 3.9 Regulatory & Policy Landscape
Note: The regulatory and policy landscape section covers regulations based on their applicability to the market, U.S. Cell and Gene Therapy CDMO category, geography, and scope of the study. Only regulatory frameworks with a material impact on operations, compliance, trade, sustainability, or market access are analyzed in detail.
Chapter 4. Key Investment Pockets & Opportunity Analysis
- 4.1 U.S. Cell and Gene Therapy CDMO Market Attractiveness Analysis
- 4.1.1 By Region – Investment Attractiveness Matrix (Volume × CAGR)
- 4.2 Absolute Revenue Growth Opportunity
- 4.2.1 By Region – Absolute USD Growth Through 2032
- 4.3 Incremental Volume Opportunity
- 4.3.1 By Region – Incremental Volume Through 2032
- 4.3.2 Segment – Incremental Volume
- 4.4 Emerging Submarket Opportunity Deep Dive (Subject to Applicability)
- 4.5 Emerging Market Opportunity Scorecards
- 4.5.1 United States
- 4.5.2 Europe
- 4.5.3 Asia
- 4.5.4 Middle East & Africa
Note: Emerging Market Opportunity Scorecards will be included based on relevance and strategic importance. Regions listed are indicative and may vary depending on data availability and market dynamics.
Chapter 5. U.S. Cell and Gene Therapy CDMO Import-Export Analysis & Trade Flows
- 5.1 Global Trade Overview
- 5.1.1 Global Export Value by Country (2024)
- 5.1.2 Global Export Volume by Country (2024)
- 5.1.3 Global Import Value by Country (2024)
- 5.1.4 Global Import Volume by Country (2024)
- 5.1.5 Net Trade Balance by Country (2024)
- 5.2 Export Analysis – Segment
- 5.2.1 Type 1 (HS Code)
- 5.2.2 Type 2 (HS Code)
- 5.2.3 Type 3 (HS Code)
- 5.2.4 Type 4 (HS Code)
- 5.2.5 Type 5 (HS Code)
- 5.3 Import Analysis – Segment
- 5.3.1 Type 1 (HS Code)
- 5.3.2 Type 2 (HS Code)
- 5.3.3 Type 3 (HS Code)
- 5.3.4 Type 4 (HS Code)
- 5.3.5 Type 5 (HS Code)
- 5.4 Average Unit Trade Prices
- 5.4.1 Average Export Price – Segment & Country
- 5.4.2 Average Import Price – Segment & Source Country
- 5.4.3 Price Trends (2024)
- 5.5 Key Trade Route Analysis
- 5.5.1 Trade Route 1
- 5.5.2 Trade Route 2
- 5.5.3 Trade Route 3
- 5.5.4 Trade Route 4
- 5.5.5 Trade Route 5
- 5.6 Trade Policy Impact Assessment
- 5.6.1 US Anti-Dumping & Section 301 Tariffs
- 5.6.2 EU Customs Union Impact
- 5.6.3 Major Free Trade Agreements
- 5.6.4 USMCA Rules of Origin
Note: Trade policy analysis will be included only where relevant to the U.S. Cell and Gene Therapy CDMO market.
Chapter 6. Competitive Landscape & Company Benchmarking
- 6.1 U.S. Cell and Gene Therapy CDMO Market Concentration & Structure
- 6.1.1 Herfindahl-Hirschman Index (HHI) – vs. 2024
- 6.1.2 Tier 1, Tier 2 & Tier 3 Market Structure
- 6.1.3 Global, Regional & Local Player Dynamics
- 6.2 U.S. Cell and Gene Therapy CDMO Market Share Analysis – 2024
- 6.2.1 Global Revenue Share by Company
- 6.2.2 Global Volume Share by Company
- 6.2.3 Regional Revenue Share
- 6.2.4 Market Share Evolution ( vs. 2024)
- 6.2.5 OEM Segment Share by Company
- 6.2.6 Replacement Segment Share by Company
- 6.3 Production/Delivery Capacity & Facility Analysis
- 6.3.1 Global Installed Capacity
- 6.3.2 Capacity Utilization Rates
- 6.3.3 Production/Output Volume
- 6.3.4 Facility Locations & Capacity Map
- 6.3.5 Planned Capacity Additions
- 6.4 U.S. Cell and Gene Therapy CDMO Competitive Benchmarking Matrix
- 6.4.1 Revenue, Volume, CAGR & Profitability Comparison
- 6.4.2 Channel Revenue Mix
- 6.4.3 Geographic Revenue Exposure
- 6.4.4 R&D Intensity
- 6.4.5 Sustainability Maturity
- 6.5 Strategic Developments in U.S. Cell and Gene Therapy CDMO (Last 24 Months)
- 6.5.1 Mergers, Acquisitions & Divestments
- 6.5.2 New U.S. Cell and Gene Therapy CDMO Launches
- 6.5.3 Facility Expansions
- 6.5.4 Strategic Alliances, Joint Ventures & Partnerships
- 6.5.5 Distribution Expansion & Market Entry
- 6.5.6 Sustainability & ESG Initiatives
- 6.6 Competitive Strategy Mapping
- 6.6.1 Leader, Challenger, Follower & Niche Classification
- 6.6.2 Pricing Strategy Comparison
- 6.6.3 Channel Strategy Matrix
Note: Strategic developments are included based on their materiality and the availability of reliable information.
Chapter 7. Global U.S. Cell and Gene Therapy CDMO Market – By Distribution Channel
- 7.1 Segment Overview
- 7.1.1 Volume & Revenue Split by Channel (2024 & 2032)
- 7.1.2 Channel Mix Evolution (2024-2032)
Chapter 8. Regional Market Analysis – Global Overview
- 8.1 Global Regional Overview
- 8.1.1 Regional Volume Share
- 8.1.2 Regional Revenue Share
- 8.1.3 Regional Volume by Region
- 8.1.4 Regional Revenue by Region
- 8.1.5 Regional Forecast Through 2032
- 8.2 Cross-Regional Segment Analysis
- 8.2.1 By Distribution Channel
- 8.2.2 By Brand/Price Tier
Chapter 9. North America U.S. Cell and Gene Therapy CDMO Market
- 9.1 United States
- 9.2 Canada
- 9.3 Mexico
Chapter 10. Europe U.S. Cell and Gene Therapy CDMO Market
- 10.1 Germany
- 10.2 France
- 10.3 Italy
- 10.4 United Kingdom
- 10.5 Spain
- 10.6 Poland
- 10.7 Russia
- 10.8 Netherlands
- 10.9 Belgium
- 10.10 Sweden
- 10.11 Denmark
- 10.12 Norway
- 10.13 Rest of Europe
Chapter 11. Asia Pacific U.S. Cell and Gene Therapy CDMO Market
- 11.1 China
- 11.2 India
- 11.3 Japan
- 11.4 South Korea
- 11.5 Thailand
- 11.6 Indonesia
- 11.7 Vietnam
- 11.8 Malaysia
- 11.9 Australia
- 11.10 Rest of Asia Pacific
Chapter 12. Latin America U.S. Cell and Gene Therapy CDMO Market
- 12.1 Brazil
- 12.2 Argentina
- 12.3 Colombia
- 12.4 Chile
- 12.5 Rest of Latin America
Chapter 13. Middle East U.S. Cell and Gene Therapy CDMO Market
- 13.1 Saudi Arabia
- 13.2 United Arab Emirates
- 13.3 Turkey
- 13.4 Israel
- 13.5 Iran
- 13.6 Rest of the Middle East
Chapter 14. Africa U.S. Cell and Gene Therapy CDMO Market
- 14.1 South Africa
- 14.2 Egypt
- 14.3 Nigeria
- 14.4 Morocco
- 14.5 Rest of Africa
Chapter 15. U.S. Cell and Gene Therapy CDMO Company Profiles
- 15.1 [Company 01]
- 15.1.1 Company Overview
- 15.1.2 Key Management Personnel
- 15.1.3 Products & Services Portfolio
- 15.1.4 Financial Performance
- 15.1.5 Key Market Focus & Geographic Presence
- 15.1.6 Recent Developments & Strategic Initiatives
Note: The company profile list is preliminary and may change based on research findings, market developments, data availability, and client requirements.
Chapter 16. Appendices
- Appendix A – List of Abbreviations & Acronyms
- Appendix B – Industry Classification Code Reference – Full Series
- Appendix C – Production & Capacity Data Tables
- Appendix D – End-Use & Demand Base Tables
- Appendix E – Consumption & Replacement Rate Assumptions
- Appendix F – ASP Reference Tables
- Appendix G – Manufacturing & Facility Database
- Appendix H – Import-Export Data Tables
- Appendix I – Regulatory Summary Tables
- Appendix J – Primary Research Participant List (Anonymized)
- Appendix K – Primary Research Questionnaire Framework
- Appendix L – Data Sources & Bibliography
- Appendix M – Market Size Divergence & Source Comparison
Chapter 17. Research Methodology
- 17.1 Research Framework & Philosophy
- 17.2 Secondary Research – Sources, Hierarchy & Data Extraction
- 17.3 Data Modeling – Bottom-Up & Top-Down Market Sizing
- 17.4 Primary Research – Stakeholder Framework, LOI & Sample Sizes
- 17.5 Forecast Methodology – Regression, Scenario & Sensitivity Analysis
- 17.6 Quality Control – Four-Layer Validation Framework
- 17.7 Limitations & Standard Assumptions
- 17.8 Disclaimer
