
Market Overview:
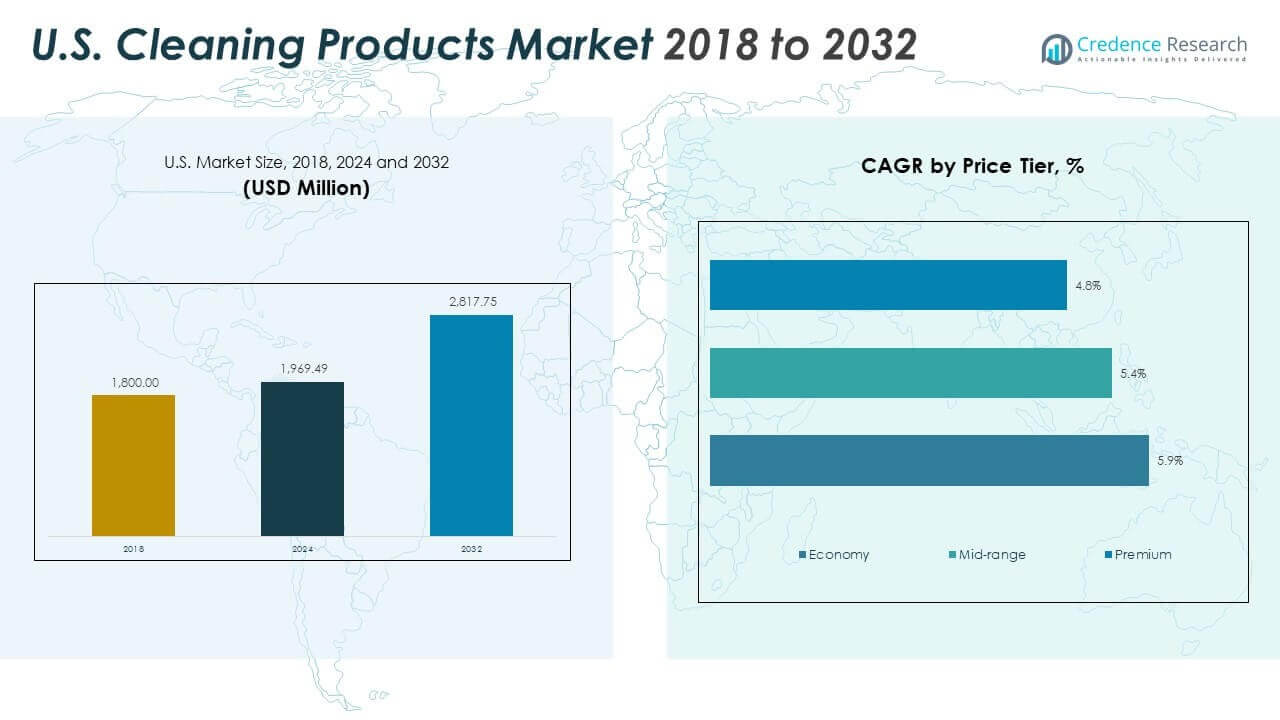
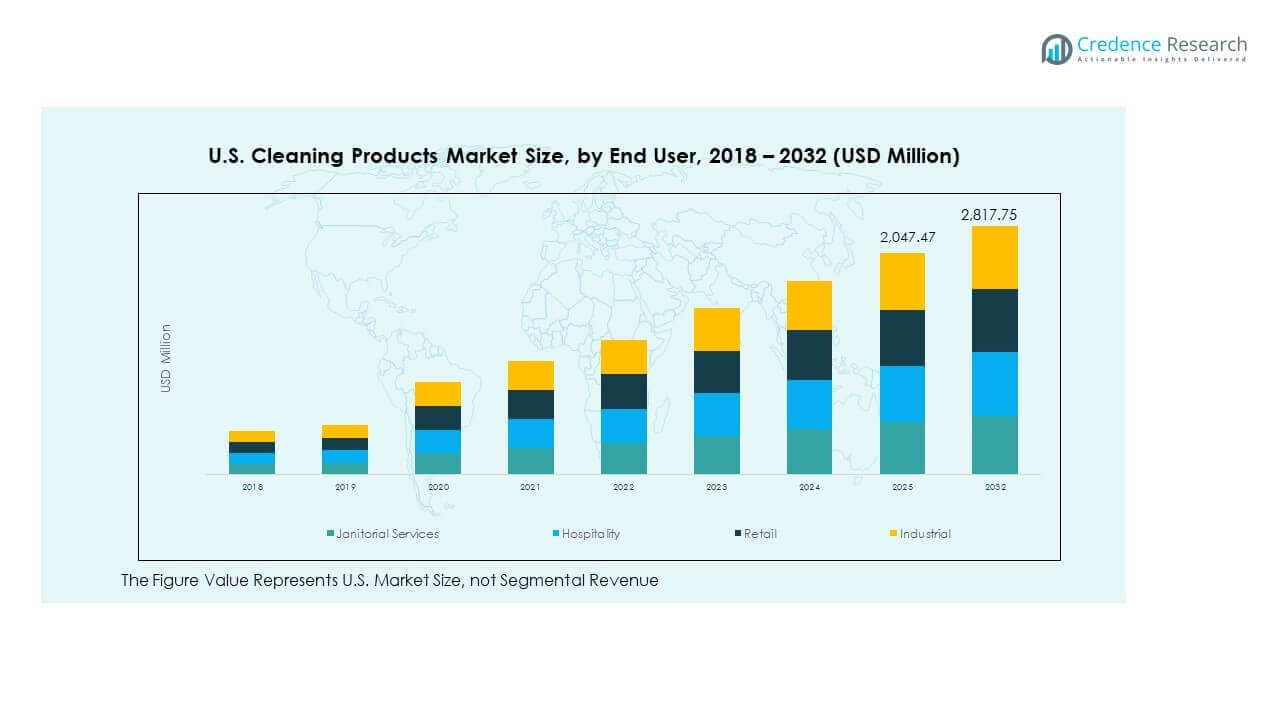
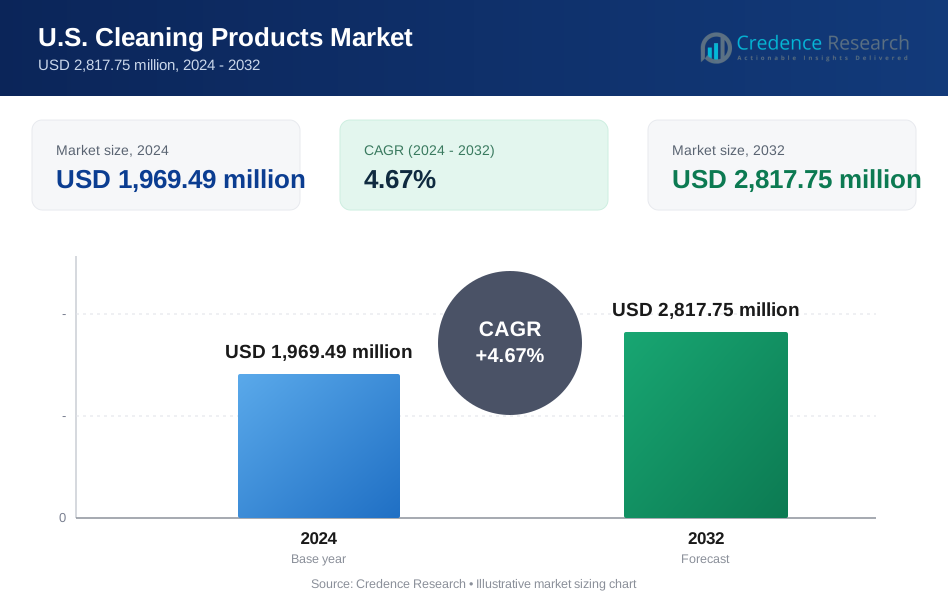
The U.S. Cleaning Products Market size was valued at USD 1,800.00 million in 2018 to USD 1,969.49 million in 2024 and is anticipated to reach USD 2,817.75 million by 2032, at a CAGR of 4.67% during the forecast period.
| REPORT ATTRIBUTE | DETAILS |
|---|---|
| Historical Period | 2020-2023 |
| Base Year | 2024 |
| Forecast Period | 2025-2032 |
| U.S. Cleaning Products Market Size 2024 | USD 1,969.49 Million |
| U.S. Cleaning Products Market, CAGR | 4.67% |
| U.S. Cleaning Products Market Size 2032 | USD 2,817.75 Million |
Rising hygiene awareness, especially after recent health emergencies, continues to influence consumer habits. The market sees ongoing demand for surface disinfectants, multi-surface sprays, and eco-friendly solutions. Dual-income households seek time-saving formats, including ready-to-use sprays and wipes. Institutions like schools, offices, and hospitals maintain frequent cleaning schedules, driving volume stability. Product innovation, including scent variation, ergonomic packaging, and safer formulas, contributes to higher brand loyalty and repeat purchases.
The Northeast leads the market due to urban density, institutional concentration, and stronger green product adoption. The South is rapidly expanding, supported by retail development, housing growth, and high product usage. The West, especially California, emphasizes sustainable and refillable formats. The Midwest holds a stable share with institutional and industrial demand across public and private facilities. Balanced consumption across regions reflects both residential and commercial alignment with cleaning standards.
Market Insights
- The U.S. Cleaning Products Market was valued at USD 1,800.00 million in 2018, reached USD 1,969.49 million in 2024, and is projected to hit USD 2,817.75 million by 2032, growing at a CAGR of 4.67%.
- The Northeast led the market with a 28% share due to urban density and institutional cleaning demand, followed by the South at 27% driven by retail expansion and housing growth, and the West at 24% supported by sustainability trends and innovation.
- The South emerged as the fastest-growing region, driven by population influx, commercial expansion, and frequent cleaning routines due to climate.
- Among price tiers, the premium segment is growing fastest with a 5.9% CAGR, reflecting strong demand for eco-labeled, pet-safe, and surface-specific cleaning solutions.
- The mid-range tier follows closely with a 5.4% CAGR, capturing value-conscious consumers who seek branded reliability without premium pricing.
Market Drivers
Post-Pandemic Hygiene Prioritization and Sustained Cleaning Behaviors Across Households and Institutions
Health crises triggered permanent behavioral shifts, with consumers prioritizing hygiene in personal and shared spaces. Routine surface disinfection became common in kitchens, bathrooms, and high-touch zones. The U.S. Cleaning Products Market benefits from this shift, as frequent cleaning routines persist. Schools, hospitals, offices, and gyms maintain strict sanitation to avoid outbreaks. This consistent demand across sectors keeps product volumes steady year-round. Consumer education about germs and contact transmission drives greater product use per session. Disinfectant sprays and wipes have become daily essentials. Companies now promote germ-kill claims and EPA-registered formulations. Institutional contracts continue fueling steady B2B product flows.
- For instance, Clorox’s Disinfecting Wipes are EPA-registered to kill 99.9% of viruses and bacteria, including SARS-CoV-2, on hard non-porous surfaces when used as directed. The product remains widely used in households and institutions for surface-level disinfection.
Rise in Urban Dual-Income Households Supporting Demand for Time-Saving Cleaning Formats
Urban living and full-time work schedules drive demand for efficient cleaning products. Consumers seek quick-action sprays, disposable wipes, and multi-surface solutions. The U.S. Cleaning Products Market leverages this trend through ready-to-use and all-in-one formats. Brands invest in ergonomic designs and fast-drying technology. Time-saving attributes remain key purchase factors for busy families. Spray bottles with mist settings or foaming heads offer cleaning control. Product convenience influences shelf placement in supermarkets. Dual-working families drive up repeat purchases for kitchen and bathroom products. Retailers adjust shelf space to prioritize compact, efficient packs.
- For instance, Lysol’s Multi‑Surface Cleaner spray is formulated to kill 99.9% of viruses and bacteria on hard surfaces when used as directed, and it dries streak‑free for everyday cleaning. The product suits quick kitchen and bathroom use by busy households seeking reliable sanitation.
Shift Toward Natural, Non-Toxic, and Biodegradable Ingredients Amid Environmental Awareness
Sustainability influences product development and consumer choice alike. Buyers prefer cleaners with plant-based or biodegradable formulations. The U.S. Cleaning Products Market responds with greener lines certified by eco-labels. Demand rises for products free from bleach, ammonia, or synthetic dyes. Consumers expect transparency in labeling, including allergen-free and hypoallergenic claims. Brands now promote refillable packaging and recyclable bottles. Natural fragrances such as citrus or lavender replace harsh chemical odors. Retailers dedicate aisles to eco-conscious brands. This segment sees higher loyalty and online engagement from health-focused buyers.
Stable Institutional Demand from Healthcare, Education, and Food Service Sectors
Institutions with hygiene mandates represent a stable buyer segment. The U.S. Cleaning Products Market serves hospitals, clinics, schools, and food outlets with strict safety needs. Product demand remains high due to regular disinfection cycles. Cleaning schedules in healthcare settings follow regulated frequencies. Food service providers use certified degreasers and surface cleaners. Long-term service contracts drive bulk purchasing and steady supplier partnerships. Specialized cleaning products target infection-prone zones and food-contact surfaces. Compliance with OSHA and CDC cleaning guidelines increases institutional trust in major brands. Demand for heavy-duty and non-residue formulas remains high in this vertical.
Market Trends
Growing Penetration of Smart Cleaning Devices and Chemical-Compatible Consumables
Smart homes drive the adoption of automated cleaning devices. Robot vacuums and mop-sprayers are now bundled with compatible cleaning solutions. The U.S. Cleaning Products Market aligns with this by offering branded liquids and pads optimized for devices. These solutions feature low-residue, sensor-safe chemicals. Growth in smart home adoption expands sales channels for device-ready refills. Subscription-based restocking models gain traction. Consumers value auto-dispensing and consistent performance. Product bundles with smart appliances boost cross-category loyalty. Retailers highlight compatible cleaner-device combos on shelves and online.
- For instance, iRobot’s Braava jet m6 is compatible with iRobot’s official Hard Floor Cleaning Solution, which is designed for use in its precision jet spray system. The manufacturer recommends using the solution as directed, with dilution varying based on model-specific tank sizes.
Increased Customization in Scent, Use-Case, and Surface-Specific Formulas
Consumers expect cleaners to match specific needs, from glass and wood to fabric and tile. The U.S. Cleaning Products Market evolves with more targeted product lines. Brands now offer fragrance variants, child-safe versions, and kitchen-only sprays. Consumers choose scents like vanilla, eucalyptus, or ocean breeze for mood or seasonal themes. Specialized formulas reduce streaks, eliminate grease, or protect finishes. Targeted cleaning lines perform better in reviews and repeat purchases. Companies promote side-by-side comparisons with traditional all-purpose products. This trend leads to deeper shelf segmentation and premium SKUs. Retailers feature top variants under sub-brand banners.
Growing Role of Online Retail and DTC Channels in Product Discovery and Loyalty Building
Online platforms play a key role in discovery, reviews, and subscriptions. The U.S. Cleaning Products Market benefits from digital-first brands with strong DTC models. E-commerce enables bundling, auto-refill, and trial-size packs. Brands engage buyers with sustainability stories and DIY cleaning tips. Ratings and influencer videos shape buying decisions. Digital channels reduce reliance on in-store samples. Subscription models offer convenience and ensure brand stickiness. Smaller brands compete with legacy players through creative online campaigns. Social media challenges and demos fuel trial among younger consumers.
Emergence of Refill Stations and Concentrate Formats in Retail and Institutional Channels
Retailers introduce refill stations for liquids and concentrate pouches to reduce waste. The U.S. Cleaning Products Market adapts with concentrates that dilute into full-strength cleaners. Concentrate pods and dissolvable tablets cut packaging volume. Commercial buyers also shift to bulk formats and dispensers. Concentrate trends reduce shipping weight and storage costs. Brands educate users on correct dilution ratios to ensure effectiveness. Refill packs cost less and attract sustainability-focused shoppers. Institutional buyers value refillable canister systems for janitorial operations. Concentrates support corporate ESG goals and reduce plastic waste metrics.
- For instance, Seventh Generation’s Free & Clear Laundry Concentrate comes in a concentrated formula designed to reduce packaging waste and offer more loads per bottle. The product’s larger bottle yields twice the number of laundry cycles compared with its non‑concentrated equivalent, supporting sustainable use without compromising cleaning performance.
Market Challenges Analysis
Supply Chain Volatility and Raw Material Price Fluctuations Affect Profit Margins and Inventory Stability
Global supply chains face regular disruptions due to logistics, raw material pricing, and energy costs. The U.S. Cleaning Products Market remains exposed to fluctuations in ethanol, surfactants, and packaging inputs. Sudden spikes in oil prices affect plastic bottle costs and label materials. Chemical input delays cause production backlogs or formulation changes. Import bottlenecks at ports slow product deliveries and limit stock availability. Inventory planning becomes more complex due to demand unpredictability. Companies hedge risk through dual sourcing or local procurement. Smaller players face more difficulty absorbing price shocks or securing key materials. These disruptions delay launches and hurt retail availability.
Consumer Skepticism Around Product Claims and Regulatory Scrutiny on Labeling and Safety
Consumers increasingly question the accuracy of cleaning product claims. The U.S. Cleaning Products Market faces challenges from stricter oversight by regulatory bodies. Greenwashing accusations affect consumer trust, especially in eco-labeled lines. Misleading “natural” or “safe” tags prompt backlash and brand damage. Laws now mandate disclosure of fragrance allergens and full ingredient lists. Failure to comply risks fines and product recalls. Sensitive buyers push for hypoallergenic and toxin-free transparency. Independent review platforms expose inconsistent performance results. Brands must balance efficacy, compliance, and clarity. Growing scrutiny requires continuous reformulation and certification efforts.
Market Opportunities
Expansion into High-Growth Segments Like Pet-Safe and Baby-Safe Cleaning Products
Parents and pet owners actively seek cleaning products that are non-toxic and gentle. The U.S. Cleaning Products Market has room to grow in these safety-driven segments. Specialized formulations meet rising demand for residue-free and allergy-friendly cleaning. Brands offer certifications from pediatric or veterinary bodies to build credibility. These segments command premium pricing and build loyalty through trust.
Increased Commercial Demand from Hospitality, Retail, and Transportation Sectors
Post-pandemic rebound in hospitality and air travel boosts demand for high-volume cleaning supplies. The U.S. Cleaning Products Market stands to benefit from cleaning contracts with airports, hotels, and stores. These clients seek consistent supply, branded performance, and compliance certifications. Growth in tourism and public mobility drives demand for janitorial-grade and scent-neutral formulas.
Market Segmentation Analysis
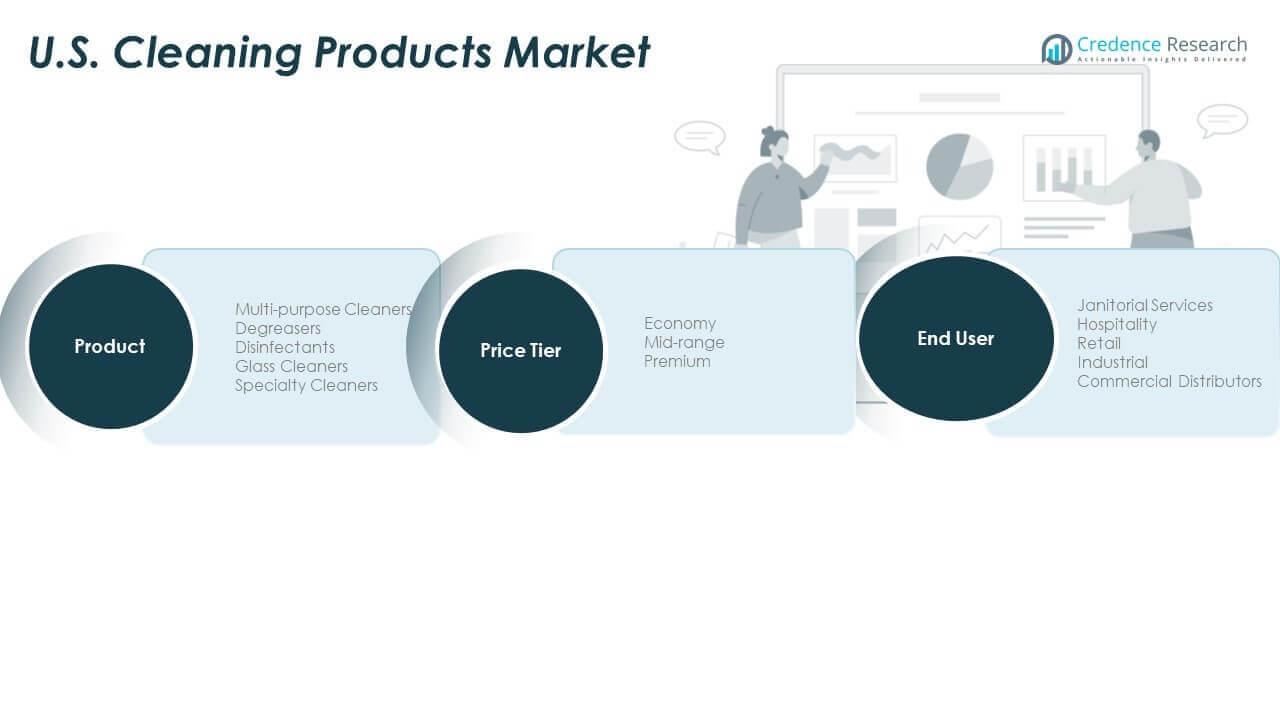
By Product Segmentation
Multi-purpose cleaners dominate demand due to their wide application in residential and commercial use. Degreasers are gaining traction in foodservice and industrial settings for removing heavy oil buildup. Disinfectants remain essential in healthcare, education, and public facilities, driven by infection control needs. Glass cleaners hold steady demand in office spaces, hospitality, and retail outlets. Specialty cleaners serve niche applications like metal, fabric, and electronics, showing consistent uptake across technical environments. The U.S. Cleaning Products Market benefits from diversified product needs across sectors.
- For instance, SC Johnson’s Fantastik Disinfectant Cleaner kills 99.9% of bacteria on hard non‑porous surfaces when used as directed. Degreasers play a key role in foodservice and industrial settings by tackling heavy oil and grime on work surfaces and equipment.
By Price Tier Segmentation
Economy-tier products maintain strong volume share in janitorial and bulk-use scenarios. Mid-range offerings attract mainstream residential buyers looking for balanced performance and cost. Premium cleaners gain traction among eco-conscious and brand-loyal consumers who seek advanced formulations or green certifications. The U.S. Cleaning Products Market supports all tiers through tailored packaging, brand positioning, and targeted promotions. Premium growth is higher in urban zones, while economy products remain dominant in institutional procurement.
By End User Segmentation
Janitorial services represent the largest end-user group, driven by recurring bulk orders and contract cleaning services. Hospitality follows closely, demanding high-performance cleaners for guest-facing hygiene. Retail chains use standardized products across branches to maintain consistency. Industrial users rely on high-strength degreasers and specialty cleaners for heavy-duty applications. Commercial distributors act as key intermediaries across all sectors, ensuring timely delivery and volume-based pricing. The U.S. Cleaning Products Market sees balanced demand across these segments, sustaining steady growth.
- For instance, Diversey’s Neutral Cleaner is formulated for daily maintenance and can cover large floor areas per gallon under typical usage conditions. Retail chains often use standardized cleaning products across branches to ensure consistent cleaning performance and operational efficiency.
Segmentation
By Product Segmentation:
- Multi-purpose Cleaners
- Degreasers
- Disinfectants
- Glass Cleaners
- Specialty Cleaners
By Price Tier Segmentation:
- Economy
- Mid-range
- Premium
By End User Segmentation:
- Janitorial Services
- Hospitality
- Retail
- Industrial
- Commercial Distributors
Regional Analysis
Northeast Holds Strong Market Presence Due to Dense Urbanization and Institutional Demand
The Northeast region accounts for approximately 28% of the U.S. Cleaning Products Market. States like New York, Massachusetts, and Pennsylvania drive this share through high urban density and large institutional presence. Healthcare networks, universities, and transit systems generate consistent product consumption. The region also shows early adoption of eco-labeled and premium products due to stronger regulatory awareness. Consumer spending on cleaning supplies remains high in metro zones with smaller living spaces and higher per capita usage. Product availability through regional distributors and retail chains supports continuous market flow.
South Emerges as a Key Growth Region Backed by Population Expansion and Retail Penetration
The South represents around 27% of the market share and is expanding due to new residential construction, population growth, and higher retail footprint. States like Texas, Florida, and Georgia lead regional sales driven by urban sprawl and rising hospitality demand. Commercial cleaning services grow rapidly in cities with large hospitality, logistics, and healthcare sectors. Warmer climates lead to frequent cleaning cycles and higher volume consumption. The region also shows rising adoption of mid-range and value-tier cleaning products. Strong distribution networks and demand from retail giants support market acceleration.
West and Midwest Support Balanced Demand Across Commercial and Residential Applications
The West holds 24% share of the U.S. Cleaning Products Market, led by California’s focus on green products and institutional contracts. Environmental policies encourage plant-based cleaners and refill systems. The Midwest captures about 21% share with consistent demand from food processing, education, and healthcare institutions. Janitorial contractors and commercial distributors play a major role in both regions. While the West drives premium and innovation-led consumption, the Midwest leans toward volume-based institutional procurement. These two regions collectively support product diversity and regional resilience across economic cycles.
Key Player Analysis
- Procter & Gamble
- The Clorox Company
- Reckitt
- C. Johnson
- Unilever
Competitive Analysis
The U.S. Cleaning Products Market features a mix of multinational corporations and regional players competing on performance, pricing, and sustainability. Leading companies like Procter & Gamble, The Clorox Company, SC Johnson, Reckitt Benckiser, and Ecolab maintain strong brand visibility and nationwide distribution. These firms invest heavily in R&D to offer advanced formulations and eco-friendly alternatives. Product lines cater to multiple end-user segments with tailored packaging and functionalities. It remains highly competitive in the disinfectant and multi-purpose cleaner categories, where consumer loyalty is influenced by efficacy, fragrance, and safety claims. Private-label brands offered by retailers continue gaining traction, especially in the economy and mid-range tiers. Manufacturers expand their footprint through partnerships with e-commerce platforms and direct-to-consumer models. Strategic pricing, product bundling, and sustainability certifications are key differentiation tools. The U.S. Cleaning Products Market sees growing consolidation through M&A activities, enabling larger firms to gain access to niche innovations and regional markets.
Recent Developments
- In September 2025, Reckitt launched its Catalyst social impact investment program in the U.S., committing up to £10 million over five years to fund health and hygiene startups, with Serena Williams as Entrepreneur-in-Residence.
- In August 2025, Unilever introduced Cif Infinite Clean, a probiotic cleaning spray designed to continue cleaning surfaces for several days after application. This innovation, safe for pets and children, supports Unilever's strategy in the global homecare market.
- In July 2025, Advent International agreed to acquire a majority stake in Reckitt's Essential Home portfolio including cleaning brands like Cillit Bang for up to $4.8 billion, creating a standalone home care business.
- In May 2025, The Clorox Company, through its CloroxPro division, announced a new agreement with Vizient to supply a broad range of cleaning and disinfecting solutions, including Clorox Healthcare and Pine-Sol products, effective May 1, 2025.
Report Coverage
The research report offers an in-depth analysis based on Product Segmentation, Price Tier Segmentation and End User Segmentation. It details leading market players, providing an overview of their business, product offerings, investments, revenue streams, and key applications. Additionally, the report includes insights into the competitive environment, SWOT analysis, current market trends, as well as the primary drivers and constraints. Furthermore, it discusses various factors that have driven market expansion in recent years. The report also explores market dynamics, regulatory scenarios, and technological advancements that are shaping the industry. It assesses the impact of external factors and global economic changes on market growth. Lastly, it provides strategic recommendations for new entrants and established companies to navigate the complexities of the market.
Future Outlook
- Product innovation will focus on safer formulations that balance cleaning strength with reduced chemical exposure.
- Demand will stay stable across households due to ingrained daily hygiene routines.
- Commercial buyers will drive volume through long-term contracts and standardized cleaning protocols.
- Sustainability will shape packaging choices, with refills and concentrates gaining acceptance.
- Digital retail will influence discovery, subscriptions, and brand loyalty across age groups.
- Premium segments will expand through eco-certified and surface-specific product lines.
- Private labels will increase pressure on pricing within economy and mid-range tiers.
- Institutional demand from healthcare and education will ensure recurring baseline consumption.
- Regional growth will stay balanced, supported by population shifts and retail expansion.
- The U.S. Cleaning Products Market will remain resilient due to diversified end-user demand.
Request a Free Sample
Fill in your details and we'll send you a free sample report.
- Sample data tables & charts
- Research methodology
Need a Custom Version of This Report?
Tailor the scope, geography, or segments to your exact requirements.
- Custom geography or segment scope
- Direct access to our analyst team
Frequently Asked Questions
What is the current market size for U.S. Cleaning Products Market, and what is its projected size in 2032?
At what Compound Annual Growth Rate is the U.S. Cleaning Products Market projected to grow between 2024 and 2032?
Which U.S. Cleaning Products Market segment held the largest share in 2024?
What are the primary factors fueling the growth of the U.S. Cleaning Products Market?
Who are the leading companies in the U.S. Cleaning Products Market?
Which region commanded the largest share of the U.S. Cleaning Products Market in 2024?
Table of Content
Chapter 1 Market Segmentation
- 1.1 Segmentation Framework
- 1.1.1 Product and Service Classification
- 1.1.2 Application and End-Use Classification
- 1.1.3 Technology and Solution Classification
- 1.1.4 Customer and Distribution Channel Classification
- 1.1.5 Geographic Segmentation
- 1.1.6 Market Segment Definitions and Boundaries
Chapter 2 Introduction
- 2.1 Report Objectives and Scope
- 2.2 Product Definition and Industry Terminology
- 2.3 Market Inclusions and Exclusions
- 2.4 Research Process
- 2.4.1 Primary Research and Expert Interviews
- 2.4.2 Secondary Research and Source Review
- 2.4.3 Top-Down and Bottom-Up Estimation
- 2.4.4 Data Triangulation and Verification
- 2.5 Market Size Measurement Basis
- 2.5.1 2024: USD 1,969.49 million → 2032: USD 2,817.75 million
- 2.6 Historical and Forecast Reference Periods
- 2.6.1 Base Year: 2024
- 2.6.2 Forecast Period: 2024-2032
- 2.7 Research Assumptions and Limitations
Chapter 3 Executive Summary
- 3.1 Market Snapshot and Key Findings
- 3.2 Base-Year Market Size, 2024
- 3.3 Forecast Market Size, 2032
- 3.4 Revenue and Volume Growth Outlook
- 3.5 Key Demand and Supply Indicators
- 3.6 Leading Market Segments
- 3.7 Fastest-Growing Market Opportunities
- 3.8 Regional Performance Highlights
- 3.9 Technology and Industry Transformation
- 3.10 Competitive Landscape Summary
- 3.11 Analyst View and Strategic Implications
Chapter 4 U.S. Cleaning Products Market Trends and Developments
- 4.1 Historical Industry Development
- 4.2 Recent Market Trends and Developments
- 4.3 Demand and Customer Behavior Trends
- 4.4 Technology and Product Innovation
- 4.5 Artificial Intelligence, Automation and Digitalization
- 4.6 Local Manufacturing and Supply Chain Realignment
- 4.7 Industry Partnerships, Mergers and Acquisitions
- 4.8 Sustainability and Circular Economy Developments
- 4.9 Government and Private Sector Investment Trends
- 4.10 Emerging Business Models and Commercialization
- 4.11 Industry Developments and Announcements
Chapter 5 U.S. Cleaning Products Market Production, Supply and Demand Analysis
- 5.1 Demand Trend and Consumption Analysis
- 5.2 Demand Forecast, 2024-2032
- 5.3 Production and Output Trend
- 5.4 Production and Output Forecast, 2024-2032
- 5.5 Installed Capacity and Capacity Utilization
- 5.6 Company-Wise Production Plants and Statistics
- 5.6.1 Installed Production Capacity
- 5.6.2 Actual Production
- 5.6.3 Planned Capacity and Expansion Targets
- 5.7 Supply Chain Structure and Procurement Trends
- 5.8 Supply-Demand Gap and Bottlenecks
- 5.9 Import Dependence and Sourcing Structure
- 5.10 Contract Manufacturing and Outsourcing
- 5.11 Regional Supply and Demand Concentration
Chapter 6 U.S. Cleaning Products Market Pricing Analysis
- 6.1 Pricing Structure and Measurement
- 6.2 Historical Pricing Trends
- 6.3 Pricing Outlook, 2024-2032
- 6.4 Average Selling Price and Unit Economics
- 6.5 Pricing by Product and Market Segment
- 6.6 Geographic Pricing Differences
- 6.7 Key Input, Energy, Labor and Logistics Costs
- 6.8 Contract Pricing and Purchasing Models
- 6.9 Pricing Sensitivity and Competitive Positioning
- 6.10 Price, Margin and Profitability Implications
Chapter 7 U.S. Cleaning Products Market Dynamics
- 7.1 Market Growth Drivers
- 7.1.1 Demand-Side Drivers
- 7.1.2 Technology and Innovation Drivers
- 7.1.3 Infrastructure and Investment Drivers
- 7.1.4 Regulatory and Policy Drivers
- 7.2 Market Restraints
- 7.2.1 Cost and Affordability Constraints
- 7.2.2 Technology and Adoption Barriers
- 7.2.3 Supply Chain and Operational Constraints
- 7.3 Market Challenges
- 7.3.1 Competitive Pressure and Margin Erosion
- 7.3.2 Skills, Infrastructure and Implementation Gaps
- 7.4 Emerging Market Opportunities
- 7.5 Market Dynamics Impact and Time-Horizon Assessment
Chapter 8 U.S. Cleaning Products Value Chain Analysis
- 8.1 Industry Value Chain Overview
- 8.2 Upstream Suppliers and Critical Inputs
- 8.3 Technology and Component Providers
- 8.4 Manufacturing or Service Delivery
- 8.5 Distribution, Channel Partners and Integrators
- 8.6 Downstream Applications and End Users
- 8.7 Value Addition and Profit Pools
- 8.8 Vertical Integration and Outsourcing
- 8.9 Supplier Concentration and Risk
- 8.10 Supply Chain Localization and Resilience
Chapter 9 U.S. Cleaning Products Market Regulations and Policies
- 9.1 Relevant Laws, Standards and Compliance Frameworks
- 9.2 Product, Service, Safety and Quality Requirements
- 9.3 Government Policies, Incentives and Subsidies
- 9.4 Imports, Exports and Trade Barriers
- 9.5 Public Procurement and Local Content Requirements
- 9.6 Environmental and Sustainability Compliance
- 9.7 Upcoming Policy Changes and Market Implications
Chapter 10 U.S. Cleaning Products Market Hotspots and Opportunities
- 10.1 Market Opportunity Mapping and Growth Hotspots
- 10.2 High-Growth Applications and Customer Groups
- 10.3 Underserved Markets and White-Space Opportunities
- 10.4 Emerging Technology and Product Opportunities
- 10.5 New Capacity and Investment Hotspots
- 10.6 Market Entry and Expansion Opportunities
- 10.7 Distribution and Partnership Opportunities
- 10.8 Near-Term and Long-Term Commercial Potential
- 10.9 Opportunity Attractiveness and Execution Risks
Chapter 11 U.S. Cleaning Products Market Outlook, 2024-2032
- 11.1 Market Size and Analysis
- 11.1.1 Revenue (Market Measurement: 2024: USD 1,969.49 million → 2032: USD 2,817.75 million)
- 11.1.2 Market Volume and Quantity Sold
- 11.1.3 Historical Market Size
- 11.1.4 Base-Year Market Size, 2024
- 11.2 Market Forecast, 2024-2032
- 11.2.1 Revenue Forecast to 2032
- 11.2.2 Volume Forecast to 2032
- 11.2.3 CAGR and Year-on-Year Growth
- 11.2.4 Incremental Revenue Opportunity
- 11.3 Forecast Assumptions and Scenario Analysis
- 11.3.1 Base-Case Forecast
- 11.3.2 Optimistic and Conservative Scenarios
- 11.3.3 Technology, Pricing and Policy Sensitivities
- 11.4 Market Attractiveness and Growth Outlook
Chapter 12 U.S. Cleaning Products Market Segmentation and Outlook
- 12.1 Segmentation Summary and Market Shares, 2024
- 12.2 Largest and Fastest-Growing Segments
- 12.3 Segment Growth Comparison
- 12.4 Segment Attractiveness and Priority Matrix
Chapter 13 U.S. Cleaning Products Geographic Market Outlook, 2024-2032
- 13.1 Domestic Market Distribution and Demand Clusters
- 13.2 State- or Province-Wise Market Size and Forecast, 2024-2032
- 13.3 City and Metropolitan Market Outlook
- 13.4 Industrial, Manufacturing and Commercial Clusters
- 13.5 Geographic Concentration of Key End Users
- 13.6 Local Pricing and Purchasing Differences
- 13.7 Domestic Production Facilities and Capacity Map
- 13.8 Local Infrastructure and Project Pipeline
- 13.9 State-Level Policy and Incentive Differences
- 13.10 Subnational Investment Hotspots and Opportunities
- 13.11 Distribution and Logistics Networks
- 13.12 Domestic Competitive Footprint
Chapter 14 U.S. Cleaning Products Technology, Innovation and Sustainability Outlook
- 14.1 Technology Landscape and Maturity
- 14.2 Product, Process and Service Innovation
- 14.3 AI, Automation and Digital Tools in the Industry
- 14.4 Technology Adoption and Performance Benchmarking
- 14.5 Innovation Pipeline and R&D Investment
- 14.6 Patent and Intellectual Property Trends
- 14.7 Energy Efficiency and Resource Management
- 14.8 Sustainability, Recycling and Circularity
- 14.9 Technology Roadmap, 2024-2032
- 14.10 Risks of Obsolescence and Technology Substitution
Chapter 15 U.S. Cleaning Products Market Key Strategic Imperatives
- 15.1 Growth and Market Entry Priorities
- 15.2 High-Return Products and Segments
- 15.3 Pricing, Profitability and Cost Optimization
- 15.4 Technology Investment and Product Differentiation
- 15.5 Supply Chain Localization and Resilience
- 15.6 Distribution and Customer Acquisition
- 15.7 Partnership, Acquisition and Capacity Strategy
- 15.8 Regional Expansion Priorities
- 15.9 Short-, Medium- and Long-Term Actions
Chapter 16 Competition Outlook
- 16.1 Industry Competition Characteristics
- 16.2 Market Structure and Concentration
- 16.3 Market Share and Competitive Positioning, 2024
- 16.4 Company-Wise Revenue and Product Benchmarking
- 16.5 Production and Service Capacity Benchmarking
- 16.6 Technology, Pricing and Differentiation
- 16.7 Regional Footprint and Distribution Strength
- 16.8 Mergers, Acquisitions and Strategic Alliances
- 16.9 New Entrants and Competitive Threats
- 16.10 Porter's Five Forces and Industry Attractiveness
- 16.11 Competitive Outlook, 2024-2032
Chapter 17 Company Profiles
- 17.1 Company Coverage and Selection Criteria
- 17.2 Leading Market Participants – Standard Profile Structure
- 17.2.1 Business Description
- 17.2.2 Company Ownership and Geographic Presence
- 17.2.3 Product and Service Portfolio
- 17.2.4 Manufacturing and Operating Footprint
- 17.2.5 Production Capacity and Expansion Plans
- 17.2.6 Financial Performance and Investment
- 17.2.7 Market Share and Competitive Position
- 17.2.8 Technology and Innovation Capabilities
- 17.2.9 Strategic Alliances or Partnerships
- 17.2.10 Recent Developments
- 17.2.11 Growth Strategy and Outlook
- 17.3 Other Relevant Market Participants
Note: Every listed company is profiled on the structure shown under the first company. The company list is preliminary and may change based on research findings, market developments, data availability and client requirements.
Chapter 18 Disclaimer
- 18.1 Research and Forecast Disclaimer
- 18.2 Data Source and Estimation Limitations
Note: The depth of individual sections depends on data availability for this market. Volume, capacity, trade and other unit-based metrics are included where applicable.

