
Market Overview:
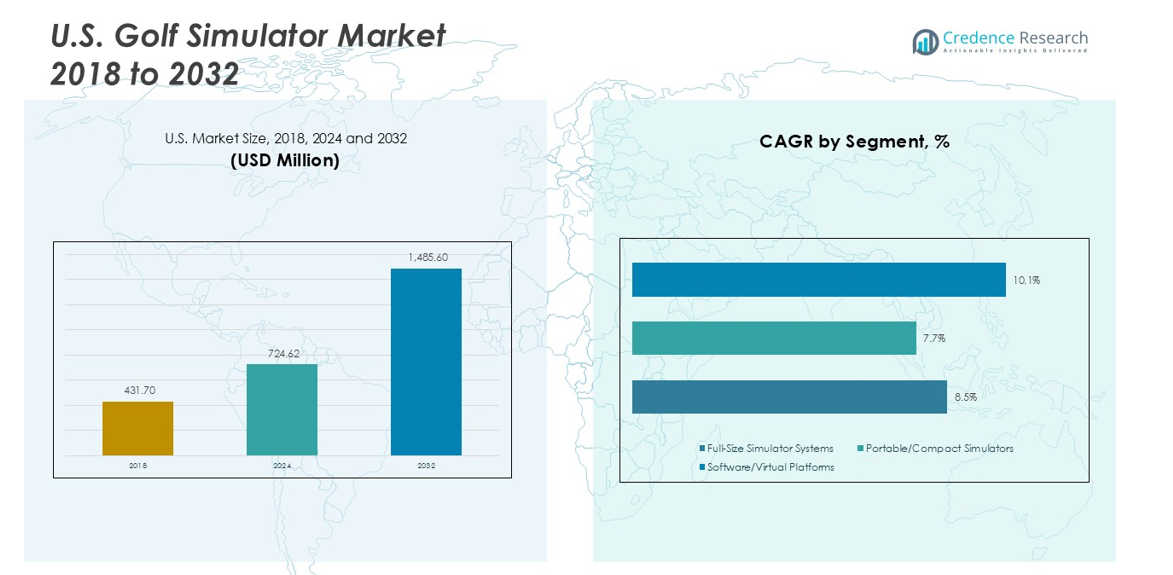
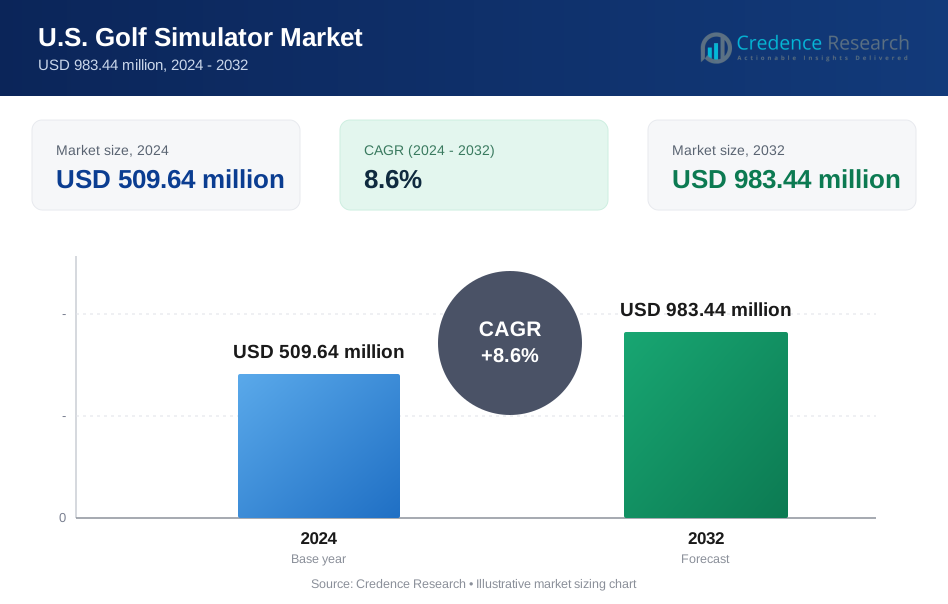
The U.S. golf simulator market was valued at USD 315.03 million in 2018 and grew to USD 509.64 million in 2024. It is projected to reach USD 983.44 million by 2032, registering a CAGR of 8.6% during 2025–2032.
| REPORT ATTRIBUTE | DETAILS |
|---|---|
| Historical Period | 2020-2023 |
| Base Year | 2024 |
| Forecast Period | 2025-2032 |
| U.S. Golf Simulator Market Size 2024 | USD 509.64 million |
| U.S. Golf Simulator Market, CAGR | 8.6% |
| U.S. Golf Simulator Market Size 2032 | USD 983.44 million |
The U.S. golf simulator market is led by key players such as Foresight Sports, Full Swing Golf, TruGolf, SkyTrak, OptiShot Golf, Ernest Sports, HD Golf, AboutGolf, GolfIn, X-Golf America, and Rapsodo, who collectively account for a significant share of overall revenue. Foresight Sports dominates with advanced photometric technology and strong adoption across commercial and residential segments, while Full Swing Golf leverages professional golfer endorsements to strengthen its premium positioning. The South leads regionally with a 34% share, driven by rising installations in corporate venues and resorts, followed by the West with 28%, Midwest with 20%, and Northeast with 18%. These regions benefit from growing demand for indoor practice, connected training platforms, and entertainment-driven simulator setups.
Market Insights
- The U.S. golf simulator market was valued at USD 509.64 million in 2024 and is projected to reach USD 983.44 million by 2032, growing at a CAGR of 8.6% from 2025 to 2032.
- Growth is driven by technological advancements in camera- and radar-based systems, rising demand for indoor entertainment, and the increasing popularity of home golf setups among affluent households.
- Key trends include the adoption of connected and subscription-based virtual course libraries, growth of portable and compact simulators for home use, and integration of simulators in entertainment venues and corporate facilities.
- The competitive landscape is led by Foresight Sports, Full Swing Golf, TruGolf, SkyTrak, OptiShot Golf, and others focusing on product innovation, partnerships, and cloud-based platforms to enhance user experience and recurring revenue.
- Regionally, the South leads with 34% share, followed by the West at 28%, Midwest at 20%, and Northeast at 18%; full-size simulator systems dominate product share.
Market Segmentation Analysis:
By Product Type
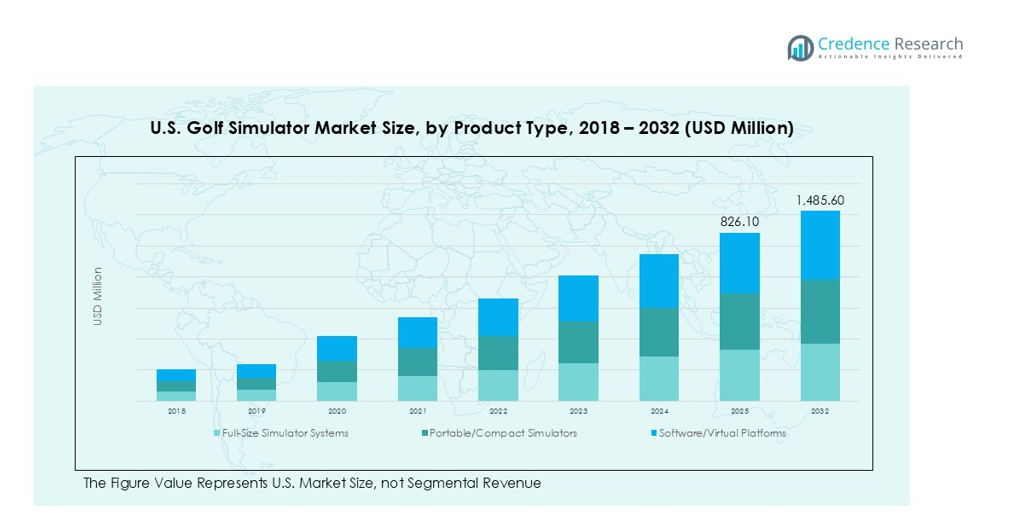
The Full-Size Simulator Systems sub-segment currently dominates U.S. product type, capturing the majority share (≈ 70–80 %) due to its appeal in commercial venues, golf clubs, and high-end residential settings. Its large physical footprint, realistic simulation of swing dynamics and environments, and higher precision in launch monitors drive this dominance. Meanwhile, Portable/Compact Simulators are growing fast (double-digit CAGR) as cost-effective entry points for home users, thanks to their lower price, ease of setup, and improved sensor tech. Software/Virtual Platforms play supporting roles; they gain traction via subscription content, virtual courses and augmented reality features, but still trail hardware in revenue.
- For instance, SkyTrak's compact launch monitor captures ball speed, spin rate, and launch angle with a high degree of accuracy for a consumer-grade device, particularly with ball speed.
By Installation Type
The Indoor Simulators segment holds the dominant market share in the U.S., accounting for roughly 75-80 % of installations. Favorable climate-control, year-round use, stable lighting and fewer weather constraints make indoor setups preferred among commercial and residential users. Growth is driven by rising demand for indoor entertainment facilities, winter usage, and urban centers where outdoor space is limited. Outdoor Simulators remain niche; they are used in driving ranges, resort settings, or where weather is mild. Their growth is constrained by environmental conditions, higher maintenance costs, and weaker adoption in regions with long winters.
- For instance, Five Iron Golf operates indoor simulator venues across major U.S. cities and internationally, featuring high-speed cameras and data-tracking systems. The company has expanded to 32 venues across 13 U.S. states and 5 countries.
By Technology
The Camera-based systems represent the dominant technology sub-segment, with share exceeding 50-60 %, particularly in full-swing simulators used by professionals and serious amateurs. High-speed photometric cameras deliver precise data on ball spin, launch angles, club-face contact, making them preferred for training and performance analysis. Radar-based (Doppler) systems are growing rapidly, valued for long-iron ball flight tracking and robustness in various lighting conditions; they appeal to both commercial and mid-tier users. Infrared sensor-based systems tend to serve entry-level and portable systems due to lower cost, though with limited precision compared to camera or radar. Hybrid technologies combining two or more sensor types are emerging, offering richer data and better reliability, especially in premium systems, and are expected to expand significantly over coming years.
Market Overview
Technological Improvement & Innovation
Advancements in sensor accuracy, graphics realism, AI swing analysis, and hybrid systems drive the U.S. golf simulator market. Better camera-based and radar-based technologies reduce error rates and improve user trust in simulators. Manufacturers also combine sensor types to benefit from each technology’s strengths. Such technical improvements attract both high-end commercial buyers and discerning home users. These innovations increase perceived value, enabling manufacturers to charge premium prices and expanding market for mid-tier and premium segments.
- For instance, Foresight Sports’ GCQuad launch monitor uses four high-speed cameras capturing 10,000 frames per second, providing sub-1° clubface angle accuracy and ±0.5 mph ball speed precision.
Rising Demand for Indoor & Home Use
Consumers seek golf playing and practicing alternatives that avoid weather, travel, and scheduling constraints. Indoor simulators serve users in urban and cold-climate regions especially well. Home systems and compact setups growth reflect this demand. Additionally, commercial venues (bars, entertainment centers, golf clubs) use simulators to offer year-round services. The post-pandemic preference for safer, home-based activities boosted this trend. The driver also includes rising disposable incomes that allow more households to afford mid-to-high-end systems.
- For instance, Uneekor’s EyeXO2 overhead launch monitor allows permanent indoor installation with dual high-speed cameras tracking ball spin up to 9,000 rpm, supporting realistic practice environments.
Commercialization & Venue Integration
Golf entertainment centers, indoor golf bars, and mixed-use hospitality venues are integrating simulators to expand revenue streams. These venues combine food, socializing, and sport, making simulator setups appealing. Operators view install cost as investment: simulators attract non-golfers and serious players alike. They enable “off-course participation,” boosting usage outside traditional golf courses. High foot traffic, memberships, events, and corporate packages further improve revenue. This commercial push also drives demand for robust, durable systems and flexible technologies that support frequent use.
Key Trends & Opportunities
Immersive & Connected Experiences
The U.S. market is seeing growth in virtual reality (VR), augmented reality (AR), and cloud-connected software platforms that allow shared leaderboards, online challenge modes, and remote coaching. These features make simulators more engaging for users beyond basic play. Consumers increasingly expect subscription content, course libraries, and real-time feedback. Such connected experiences also create recurring revenue streams. Companies offering these extras can differentiate and capture higher customer loyalty.
- For instance, Golfzon’s Vision Premium simulators support over 200 online tournaments annually with real-time global leaderboards connecting players from more than 40 countries.
Portable & Affordable Systems for Home Users
Smaller, lower-cost simulators that use infrared or simplified sensor systems are expanding accessibility. As the cost of components drops and manufacturers scale, more home users buy compact or portable units. This trend opens new market segments in suburban and rural areas, for garages or smaller indoor spaces. Affordable systems help convert casual golf enthusiasts or newcomers. Opportunity exists for bundling software, virtual memberships, and low-cost hardware to drive mass adoption.
- For instance, OptiShot 2 provides a compact infrared-based simulator with 32 sensors that can be set up in under 10 minutes, supporting play on 15 virtual courses out of the box.
Multi-Use & Non-Traditional Venue Expansion
Golf simulators are moving beyond golf courses into entertainment complexes, corporate event spaces, hotels, and even retail spaces. Venues offering food, social events, or multi-sport simulation alongside golf can attract a broader audience. Furthermore, corporate wellness programs or team-building events provide new demand. There is also opportunity in educational programs and youth training through schools or academies. Leveraging non-traditional venues helps expand utilization and markets outside core golfing consumers.
Key Challenges
High Initial Cost & Space Requirements
Premium full-size and hybrid simulation systems demand high capital investment. Costs include hardware (sensors, cameras, projectors), installation (screen, enclosure), and space. For both commercial venues and residential users, suitable indoor space and ceiling height impose limitations. Those costs deter smaller businesses and middle-income households. Return on investment may be long, especially in low utilization environments. Without cost reductions or financing options, growth may slow in price-sensitive segments.
Lack of Awareness & Perceived Value Gap
Many potential users misunderstand what golf simulators can do. Some assume simulators are only for entertainment, not for skill development. Others view cheaper models as low quality. This perception limits willingness to pay for more capable systems. Marketing, user education, and demonstration remain under-harnessed. Also, some buyers downplay recurring costs: maintenance, software updates, subscription fees. Overcoming this challenge requires clear messaging, user trials, and showcasing performance benefits.
Regional Analysis
Northeast
The Northeast holds an 18% share in 2024. Dense urban hubs drive high indoor adoption. Golf bars and simulator lounges see steady weekday traffic. Cold winters extend practice seasons and bookings. Universities and academies add training bays for teams. Affluent suburbs invest in home simulators and compact setups. Limited real estate favors premium, small-footprint enclosures. Technology upgrades focus on photometric cameras for accuracy. Content libraries with famous courses boost engagement. Facility operators bundle memberships and coaching packages. Growth remains healthy in metro corridors and college towns.
Midwest
The Midwest accounts for a 20% share in 2024. Long winters and variable weather support indoor demand. Community leagues and high-school programs add simulator time. Family entertainment centers integrate multi-sport modes alongside golf. Value-priced radar units appeal to budget-sensitive buyers. Big garages enable home installations with higher ceilings. Municipal recreation centers add bays to widen access. Colleges adopt simulators for analytics-driven training. Course closures in rural areas shift play indoors. Subscription software expands recurring revenue for venues. Growth benefits from strong grassroots golf participation.
South
The South leads with a 34% share in 2024. Large metros and suburban growth expand venue footprints. Corporate events and hospitality drive weekday utilization. Resorts add simulators for rainy-day experiences and nightlife. Home installs rise in master-planned communities. Hybrid camera-radar systems support coaching and fittings. Year-round play sustains steady revenue cycles. Retail golf chains build fitting bays across growth markets. College programs and youth academies deepen usage. Content featuring championship courses elevates appeal. Financing plans and builder partnerships accelerate residential adoption.
West
The West holds a 28% share in 2024. Tech-savvy consumers value connected analytics and coaching. Urban density favors boutique indoor studios. Affluent households add premium enclosures in renovations. Entertainment districts integrate simulators with food and music. Portable units suit renters and condos with limited space. Camera systems dominate due to lighting control indoors. Resorts and ski towns add simulators for off-season traffic. Esports-style leagues build community engagement. Sustainability features, like LED projectors, gain attention. Recurring subscriptions and remote lessons lift lifetime value.
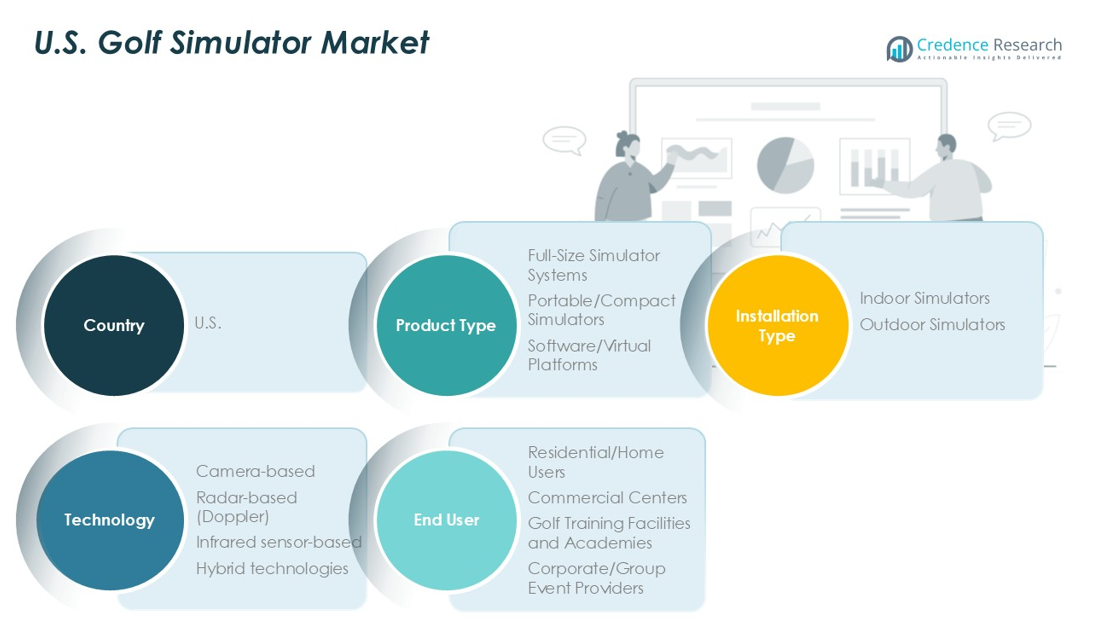
Market Segmentations:
By Product Type
- Full-Size Simulator Systems
- Portable/Compact Simulators
- Software/Virtual Platforms
By Installation Type
- Indoor Simulators
- Outdoor Simulators
By Technology
- Camera-based
- Radar-based (Doppler)
- Infrared sensor-based
- Hybrid technologies
By End User
- Residential/Home Users
- Commercial Centers
- Golf Training Facilities and Academies
- Corporate/Group Event Providers
By Geography
- Northeast
- Midwest
- South
- West
Competitive Landscape
The U.S. golf simulator market is moderately consolidated, with leading players including Foresight Sports, Full Swing Golf, TruGolf, SkyTrak, OptiShot Golf, Ernest Sports, HD Golf, AboutGolf, GolfIn, X-Golf America, and Rapsodo dominating market share. Foresight Sports leads with advanced camera-based technology and a strong presence in commercial venues and residential segments. Full Swing Golf partners with professional golfers and entertainment chains to boost brand visibility. TruGolf and SkyTrak focus on affordable, portable solutions catering to home users and golf enthusiasts. OptiShot Golf and Ernest Sports provide entry-level simulators for recreational players, while HD Golf and AboutGolf target high-end installations with premium enclosures. Players invest in R&D to enhance simulation accuracy, expand virtual course libraries, and integrate cloud connectivity for online play. Strategic moves include partnerships with golf academies, product line expansions, and subscription-based software models to drive recurring revenue and strengthen market positioning.
Key Player Analysis
- Foresight Sports
- Full Swing Golf
- TruGolf
- SkyTrak
- OptiShot Golf
- Ernest Sports
- HD Golf
- AboutGolf
- GolfIn
- X-Golf America
- Rapsodo
Recent Developments
- In May 2025, IdeasLab launched XView AI, a markerless app that provides real-time, offline analysis of the full golf swing by tracking body, shaft, and club movement. This app is available on the iPhone App Store.
- In May 2025, Golf VX, a provider of indoor golf simulators, announced the opening of its newest franchise location, Golf VX Boston. This marks the company’s second U.S. agreement after the launch of Golf VX Arlington Heights in 2024.
- In April 2025, TruGolf and Digital Legends announced a partnership to launch an advanced golf simulator experience. It is built on TruGolf's Apex platform, featuring AI-driven recreations of legendary players such as Ben Hogan. The simulator will enable users to compete with historic golf figures, receive AI-powered coaching, and engage in tournaments on modern courses.
- In February 2025, Canopy, a remote monitoring and management software provider, partnered with Full Swing Golf. This collaboration allows Full Swing’s support and software teams to leverage Canopy’s platform to enhance the performance, reliability, and remote management of their global simulator fleet.
- In November 2024, Smartgolf LLC launched Smartgolf AI Coach, an advanced device aimed at enhancing golf performance through precise skill improvement. The device uses AI to analyze swing metrics such as speed, distance, angle, and direction, providing instant, detailed feedback via a connected app.
- In January 2022, Golfzon Newdin Group announced an expansion with Leadbetter academies to open high-tech indoor golf facilities in the U.S. in 2022.
Report Coverage
The research report offers an in-depth analysis based on Product Type Installation Type, Technology, End User and Geography. It details leading market players, providing an overview of their business, product offerings, investments, revenue streams, and key applications. Additionally, the report includes insights into the competitive environment, SWOT analysis, current market trends, as well as the primary drivers and constraints. Furthermore, it discusses various factors that have driven market expansion in recent years. The report also explores market dynamics, regulatory scenarios, and technological advancements that are shaping the industry. It assesses the impact of external factors and global economic changes on market growth. Lastly, it provides strategic recommendations for new entrants and established companies to navigate the complexities of the market.
Future Outlook
- The market will continue to grow steadily with rising adoption in commercial and residential spaces.
- Full-size simulator systems will remain the dominant choice due to their accuracy and immersive experience.
- Portable and compact simulators will see strong growth as prices become more affordable for home users.
- Camera-based technology will lead the market, with hybrid systems gaining traction for advanced analytics.
- Indoor simulator installations will expand further, driven by demand for year-round play and training.
- Subscription-based virtual course libraries and online competitions will create recurring revenue opportunities.
- Partnerships with golf academies and entertainment venues will strengthen market presence for key players.
- Youth training programs and collegiate golf teams will increase simulator usage for skill development.
- Advances in VR and AR integration will enhance user engagement and gamification.
- Regional growth will be strongest in the South and West, supported by high population and venue expansion.
Request a Free Sample
Fill in your details and we'll send you a free sample report.
- Sample data tables & charts
- Research methodology
Need a Custom Version of This Report?
Tailor the scope, geography, or segments to your exact requirements.
- Custom geography or segment scope
- Direct access to our analyst team
Frequently Asked Questions
What is the current market size for U.S. Golf Simulator market, and what is its projected size in 2032?
At what Compound Annual Growth Rate is the U.S. Golf Simulator market projected to grow between 2025 and 2032?
Which U.S. Golf Simulator market segment held the largest share in 2024?
What are the primary factors fueling the growth of the U.S. Golf Simulator market?
Who are the leading companies in the U.S. Golf Simulator market?
Table of Content
Chapter 1. Report Introduction
- 1.1 Report Description & Purpose
- 1.1.1 Report Title & Market Definition
- 1.1.2 Unique Selling Propositions (USP) & Key Differentiators
- 1.1.3 Value Proposition for Stakeholders
- 1.2 Research Objectives
- 1.2.1 Market Sizing Objectives (Volume & Revenue)
- 1.2.2 Segmentation Objectives
- 1.2.3 Competitive Intelligence Objectives
- 1.2.4 Forecast & Scenario Objectives
- 1.3 Report Scope
- 1.3.1 U.S. Golf Simulator Scope – Types & Subtypes Covered
- 1.3.2 Geographic Scope – Regions & Countries Covered
- 1.3.3 Historical Period, Base Year & Forecast Period (2024; forecast to 2032)
- 1.3.4 Inclusions & Exclusions
- 1.4 HS Code & Classification Framework
- 1.5 Currency, Units & Pricing Basis
- 1.6 Target Stakeholders
- 1.7 Limitations & Assumptions
Chapter 2. Executive Summary
- 2.1 Global U.S. Golf Simulator Market Snapshot
- 2.1.1 Market Size – Historical (2024) & Forecast (2024-2032) (2024: USD 509.64 million → 2032: USD 983.44 million)
- 2.1.2 Volume & Revenue – Global Totals
- 2.1.3 Key Market Highlights – Top Five Facts
- 2.2 U.S. Golf Simulator Market Segmentation Snapshot
- 2.2.1 Market Split by Region – 2024 vs. 2032
- 2.3 Competitive Snapshot
- 2.3.1 Top 10 Players by Revenue Share – 2024
- 2.3.2 Top 10 Players by Volume Share – 2024
- 2.3.3 Recent Strategic Developments (18-Month Summary)
- 2.4 Key Investment Highlights & Strategic Conclusions
Chapter 3. U.S. Golf Simulator Market Dynamics & Industry Analysis
- 3.1 Market Overview & Context
- 3.1.1 U.S. Golf Simulator Market Position in the Broader Automotive Value Chain
- 3.1.2 OEM vs. Replacement Market Dynamics
- 3.1.3 Market Maturity & Development Stage by Region
- 3.2 U.S. Golf Simulator Market Drivers
- 3.3 U.S. Golf Simulator Market Restraints & Challenges
- 3.4 U.S. Golf Simulator Market Opportunities
- 3.5 Porter's Five Forces Analysis
- 3.5.1 Threat of New Entrants
- 3.5.2 Bargaining Power of Suppliers
- 3.5.3 Bargaining Power of Buyers
- 3.5.4 Threat of Substitutes
- 3.5.5 Competitive Rivalry – Intensity Assessment
- 3.6 U.S. Golf Simulator Value Chain Analysis
- 3.6.1 Upstream – Raw Material/Input Suppliers
- 3.6.1.1 Raw Material/Input 1
- 3.6.1.2 Raw Material/Input 2
- 3.6.1.3 Raw Material/Input 3
- 3.6.2 Midstream – Production/Manufacturing/Service Delivery
- 3.6.2.1 Production/Process Overview
- 3.6.2.2 Key Facility Locations & Capacity by Manufacturer
- 3.6.3 Downstream – Distribution & End Consumer
- 3.6.3.1 Primary Channel – B2B/OEM
- 3.6.3.2 Secondary Channels – Dealer, Retail, Online, Direct
- 3.6.4 Value Chain Profitability Analysis
- 3.6.1 Upstream – Raw Material/Input Suppliers
- 3.7 PESTEL Analysis
- 3.7.1 Political Factors
- 3.7.2 Economic Factors
- 3.7.3 Social Factors
- 3.7.4 Technological Factors
- 3.7.5 Environmental Factors
- 3.7.6 Legal Factors
- 3.8 U.S. Golf Simulator Supply Chain Analysis
- 3.8.1 Raw Material/Input Supply Risk Assessment
- 3.8.2 Manufacturing Concentration Risk (Geographic Exposure)
- 3.8.3 Trade Disruption Impact Analysis
- 3.9 Regulatory & Policy Landscape
Note: The regulatory and policy landscape section covers regulations based on their applicability to the market, U.S. Golf Simulator category, geography, and scope of the study. Only regulatory frameworks with a material impact on operations, compliance, trade, sustainability, or market access are analyzed in detail.
Chapter 4. Key Investment Pockets & Opportunity Analysis
- 4.1 U.S. Golf Simulator Market Attractiveness Analysis
- 4.1.1 By Region – Investment Attractiveness Matrix (Volume × CAGR)
- 4.2 Absolute Revenue Growth Opportunity
- 4.2.1 By Region – Absolute USD Growth Through 2032
- 4.3 Incremental Volume Opportunity
- 4.3.1 By Region – Incremental Volume Through 2032
- 4.3.2 Segment – Incremental Volume
- 4.4 Emerging Submarket Opportunity Deep Dive (Subject to Applicability)
- 4.5 Emerging Market Opportunity Scorecards
- 4.5.1 United States
- 4.5.2 Europe
- 4.5.3 Asia
- 4.5.4 Middle East & Africa
Note: Emerging Market Opportunity Scorecards will be included based on relevance and strategic importance. Regions listed are indicative and may vary depending on data availability and market dynamics.
Chapter 5. U.S. Golf Simulator Import-Export Analysis & Trade Flows
- 5.1 Global Trade Overview
- 5.1.1 Global Export Value by Country (2024)
- 5.1.2 Global Export Volume by Country (2024)
- 5.1.3 Global Import Value by Country (2024)
- 5.1.4 Global Import Volume by Country (2024)
- 5.1.5 Net Trade Balance by Country (2024)
- 5.2 Export Analysis – Segment
- 5.2.1 Type 1 (HS Code)
- 5.2.2 Type 2 (HS Code)
- 5.2.3 Type 3 (HS Code)
- 5.2.4 Type 4 (HS Code)
- 5.2.5 Type 5 (HS Code)
- 5.3 Import Analysis – Segment
- 5.3.1 Type 1 (HS Code)
- 5.3.2 Type 2 (HS Code)
- 5.3.3 Type 3 (HS Code)
- 5.3.4 Type 4 (HS Code)
- 5.3.5 Type 5 (HS Code)
- 5.4 Average Unit Trade Prices
- 5.4.1 Average Export Price – Segment & Country
- 5.4.2 Average Import Price – Segment & Source Country
- 5.4.3 Price Trends (2024)
- 5.5 Key Trade Route Analysis
- 5.5.1 Trade Route 1
- 5.5.2 Trade Route 2
- 5.5.3 Trade Route 3
- 5.5.4 Trade Route 4
- 5.5.5 Trade Route 5
- 5.6 Trade Policy Impact Assessment
- 5.6.1 US Anti-Dumping & Section 301 Tariffs
- 5.6.2 EU Customs Union Impact
- 5.6.3 Major Free Trade Agreements
- 5.6.4 USMCA Rules of Origin
Note: Trade policy analysis will be included only where relevant to the U.S. Golf Simulator market.
Chapter 6. Competitive Landscape & Company Benchmarking
- 6.1 U.S. Golf Simulator Market Concentration & Structure
- 6.1.1 Herfindahl-Hirschman Index (HHI) – vs. 2024
- 6.1.2 Tier 1, Tier 2 & Tier 3 Market Structure
- 6.1.3 Global, Regional & Local Player Dynamics
- 6.2 U.S. Golf Simulator Market Share Analysis – 2024
- 6.2.1 Global Revenue Share by Company
- 6.2.2 Global Volume Share by Company
- 6.2.3 Regional Revenue Share
- 6.2.4 Market Share Evolution ( vs. 2024)
- 6.2.5 OEM Segment Share by Company
- 6.2.6 Replacement Segment Share by Company
- 6.3 Production/Delivery Capacity & Facility Analysis
- 6.3.1 Global Installed Capacity
- 6.3.2 Capacity Utilization Rates
- 6.3.3 Production/Output Volume
- 6.3.4 Facility Locations & Capacity Map
- 6.3.5 Planned Capacity Additions
- 6.4 U.S. Golf Simulator Competitive Benchmarking Matrix
- 6.4.1 Revenue, Volume, CAGR & Profitability Comparison
- 6.4.2 Channel Revenue Mix
- 6.4.3 Geographic Revenue Exposure
- 6.4.4 R&D Intensity
- 6.4.5 Sustainability Maturity
- 6.5 Strategic Developments in U.S. Golf Simulator (Last 24 Months)
- 6.5.1 Mergers, Acquisitions & Divestments
- 6.5.2 New U.S. Golf Simulator Launches
- 6.5.3 Facility Expansions
- 6.5.4 Strategic Alliances, Joint Ventures & Partnerships
- 6.5.5 Distribution Expansion & Market Entry
- 6.5.6 Sustainability & ESG Initiatives
- 6.6 Competitive Strategy Mapping
- 6.6.1 Leader, Challenger, Follower & Niche Classification
- 6.6.2 Pricing Strategy Comparison
- 6.6.3 Channel Strategy Matrix
Note: Strategic developments are included based on their materiality and the availability of reliable information.
Chapter 7. Global U.S. Golf Simulator Market – By Distribution Channel
- 7.1 Segment Overview
- 7.1.1 Volume & Revenue Split by Channel (2024 & 2032)
- 7.1.2 Channel Mix Evolution (2024-2032)
Chapter 8. Regional Market Analysis – Global Overview
- 8.1 Global Regional Overview
- 8.1.1 Regional Volume Share
- 8.1.2 Regional Revenue Share
- 8.1.3 Regional Volume by Region
- 8.1.4 Regional Revenue by Region
- 8.1.5 Regional Forecast Through 2032
- 8.2 Cross-Regional Segment Analysis
- 8.2.1 By Distribution Channel
- 8.2.2 By Brand/Price Tier
Chapter 9. North America U.S. Golf Simulator Market
- 9.1 United States
- 9.2 Canada
- 9.3 Mexico
Chapter 10. Europe U.S. Golf Simulator Market
- 10.1 Germany
- 10.2 France
- 10.3 Italy
- 10.4 United Kingdom
- 10.5 Spain
- 10.6 Poland
- 10.7 Russia
- 10.8 Netherlands
- 10.9 Belgium
- 10.10 Sweden
- 10.11 Denmark
- 10.12 Norway
- 10.13 Rest of Europe
Chapter 11. Asia Pacific U.S. Golf Simulator Market
- 11.1 China
- 11.2 India
- 11.3 Japan
- 11.4 South Korea
- 11.5 Thailand
- 11.6 Indonesia
- 11.7 Vietnam
- 11.8 Malaysia
- 11.9 Australia
- 11.10 Rest of Asia Pacific
Chapter 12. Latin America U.S. Golf Simulator Market
- 12.1 Brazil
- 12.2 Argentina
- 12.3 Colombia
- 12.4 Chile
- 12.5 Rest of Latin America
Chapter 13. Middle East U.S. Golf Simulator Market
- 13.1 Saudi Arabia
- 13.2 United Arab Emirates
- 13.3 Turkey
- 13.4 Israel
- 13.5 Iran
- 13.6 Rest of the Middle East
Chapter 14. Africa U.S. Golf Simulator Market
- 14.1 South Africa
- 14.2 Egypt
- 14.3 Nigeria
- 14.4 Morocco
- 14.5 Rest of Africa
Chapter 15. U.S. Golf Simulator Company Profiles
- 15.1 [Company 01]
- 15.1.1 Company Overview
- 15.1.2 Key Management Personnel
- 15.1.3 Products & Services Portfolio
- 15.1.4 Financial Performance
- 15.1.5 Key Market Focus & Geographic Presence
- 15.1.6 Recent Developments & Strategic Initiatives
Note: The company profile list is preliminary and may change based on research findings, market developments, data availability, and client requirements.
Chapter 16. Appendices
- Appendix A – List of Abbreviations & Acronyms
- Appendix B – Industry Classification Code Reference – Full Series
- Appendix C – Production & Capacity Data Tables
- Appendix D – End-Use & Demand Base Tables
- Appendix E – Consumption & Replacement Rate Assumptions
- Appendix F – ASP Reference Tables
- Appendix G – Manufacturing & Facility Database
- Appendix H – Import-Export Data Tables
- Appendix I – Regulatory Summary Tables
- Appendix J – Primary Research Participant List (Anonymized)
- Appendix K – Primary Research Questionnaire Framework
- Appendix L – Data Sources & Bibliography
- Appendix M – Market Size Divergence & Source Comparison
Chapter 17. Research Methodology
- 17.1 Research Framework & Philosophy
- 17.2 Secondary Research – Sources, Hierarchy & Data Extraction
- 17.3 Data Modeling – Bottom-Up & Top-Down Market Sizing
- 17.4 Primary Research – Stakeholder Framework, LOI & Sample Sizes
- 17.5 Forecast Methodology – Regression, Scenario & Sensitivity Analysis
- 17.6 Quality Control – Four-Layer Validation Framework
- 17.7 Limitations & Standard Assumptions
- 17.8 Disclaimer
