
Market Overview
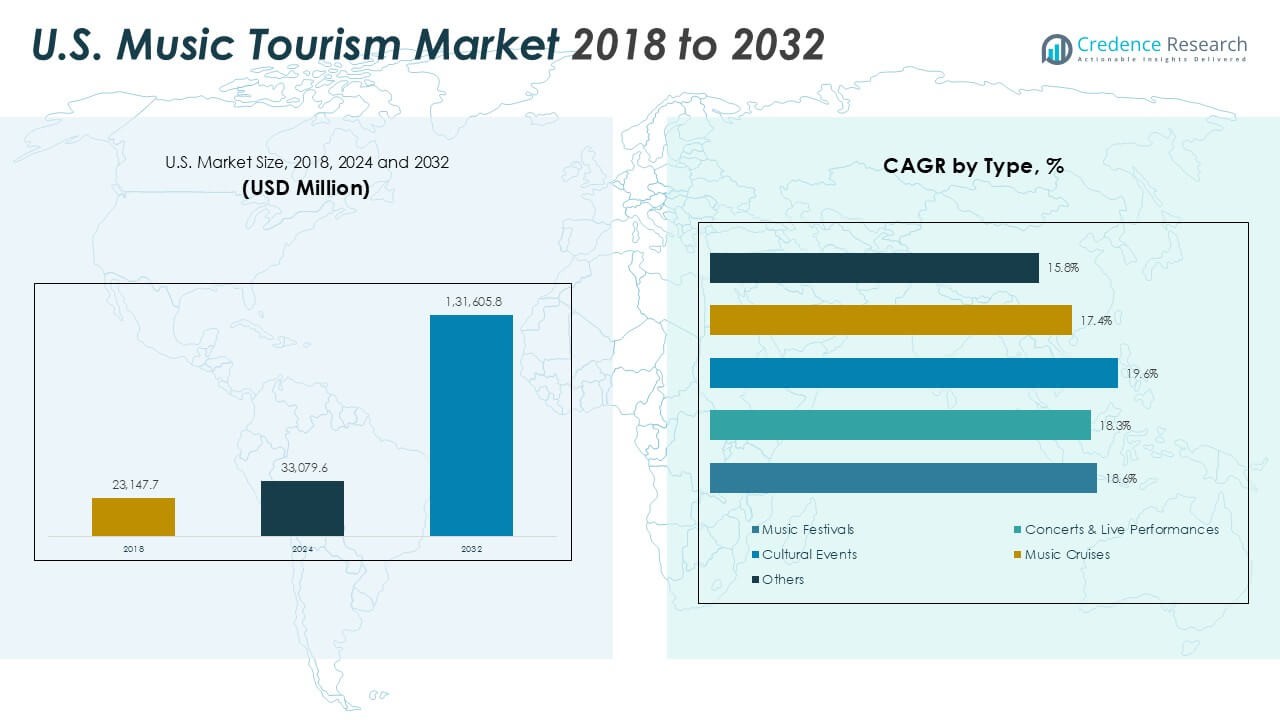
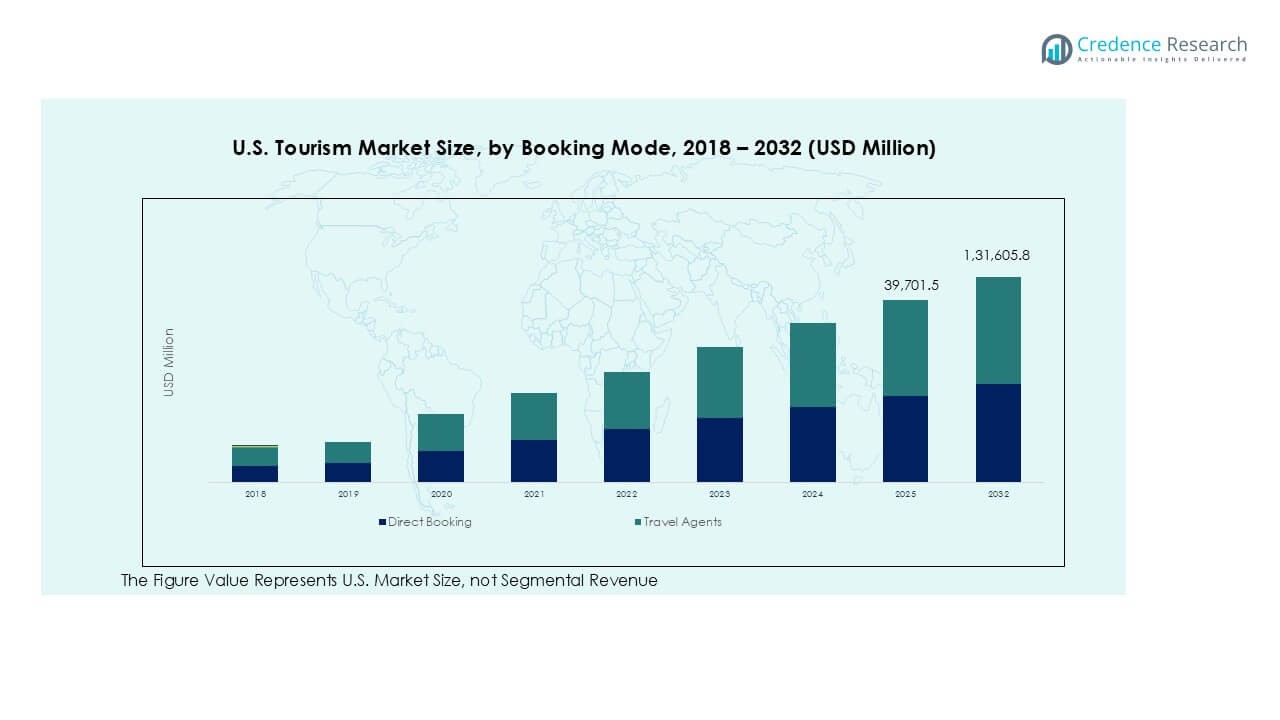
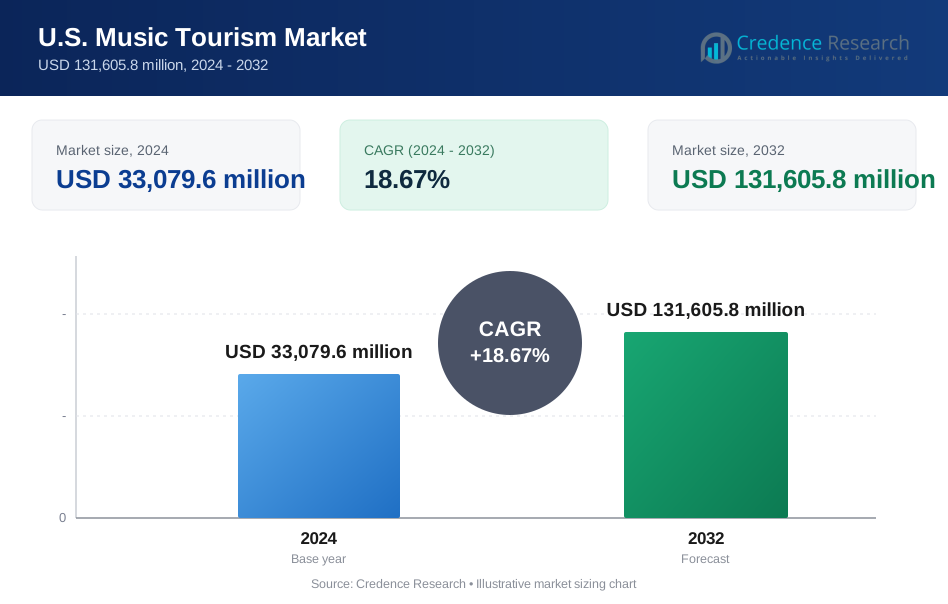
U.S. Music Tourism market size was valued at USD 23,147.7 million in 2018, increasing to USD 33,079.6 million in 2024, and is anticipated to reach USD 131,605.8 million by 2032, growing at a CAGR of 18.67% during the forecast period.
| REPORT ATTRIBUTE | DETAILS |
|---|---|
| Historical Period | 2020-2023 |
| Base Year | 2024 |
| Forecast Period | 2025-2032 |
| U.S. Music Tourism market Size 2024 | USD 33,079.6 Million |
| U.S. Music Tourism market, CAGR | 18.67% |
| U.S. Music Tourism market Size 2032 | USD 131,605.8 Million |
The U.S. music tourism market is led by prominent players such as Live Nation Entertainment, AEG Presents, C3 Presents, and Insomniac Events, which collectively hold a significant share through large-scale festivals, tours, and live performances. Supporting firms like Ticketmaster, Eventbrite, and Vivid Seats strengthen the ecosystem with advanced ticketing and audience analytics. Regionally, the South dominates the market with a 32% share in 2024, driven by iconic destinations such as Nashville, Austin, and New Orleans. These cities attract both domestic and international visitors through their deep musical heritage, dynamic event culture, and strong tourism infrastructure.
Market Insights
- The U.S. music tourism market was valued at USD 33,079.6 million in 2024 and is projected to reach USD 131,605.8 million by 2032, growing at a CAGR of 18.67%.
- Growth is driven by rising attendance at large-scale music festivals, concerts, and live performances, which held a 41% segment share in 2024.
- Key trends include digital ticketing adoption, hybrid festival formats, and eco-conscious event operations enhancing visitor engagement and sustainability.
- Major players such as Live Nation Entertainment, AEG Presents, and Insomniac Events dominate through strategic partnerships, artist management, and large-scale event organization.
- Regionally, the South led with a 32% share in 2024, followed by the Northeast at 28%, supported by vibrant cultural hubs and strong tourism infrastructure across leading music destinations.
Market Segmentation Analysis:
By Type
The concerts and live performances segment dominated the U.S. music tourism market in 2024 with a 41% share. Growth is driven by rising attendance at large-scale tours, residencies, and arena shows featuring global artists. Expanding digital ticketing platforms and enhanced stage technologies improve accessibility and audience engagement. The segment benefits from strong demand across major cities such as Los Angeles, New York, and Nashville. Increasing sponsorships and partnerships between entertainment firms and hospitality providers further support market expansion across diverse performance categories.
- For instance, Live Nation Entertainment reported that 151 million fans attended its concerts globally in 2024. This represents a 9% rise in attendance compared to the previous year. Arena and amphitheater activity were the primary drivers of this fan count, despite a 30% reduction in stadium shows. North America and Latin America experienced almost all of the growth in fan attendance at Live Nation's operated venues.
By Age Group
The 18–34 years segment held the largest share of 46% in 2024. These demographic drives market growth through high spending on live experiences, travel, and social events. Younger travelers seek immersive entertainment, social media engagement, and festival tourism packages. Music streaming and digital promotion have amplified event reach among this group, increasing cross-state attendance. The rising trend of combining travel with cultural and leisure experiences also supports segment growth. Organizers are tailoring offerings with tech-driven engagement and affordable packages to attract millennials and Gen Z audiences.
- For instance, Spotify reported that over 68% of its U.S. premium subscribers fall within the 18–34 age group, directly influencing tour discovery and ticket sales.
By End-User
Leisure travelers led the market with a 52% share in 2024, dominating the end-user segment. Their participation is fueled by the growing popularity of destination festivals and music-themed vacations. Increased disposable income and preference for entertainment-based tourism boost spending on concerts and cultural events. Travel agencies and tour operators are offering curated music travel itineraries that include local attractions, enhancing traveler engagement. The expansion of regional air connectivity and event-linked hospitality deals also contributes to the segment’s leadership in the overall market.
Key Growth Drivers
Growing Popularity of Large-Scale Music Festivals
The rising popularity of large-scale music festivals is a major driver of the U.S. music tourism market. Events such as Coachella, Lollapalooza, and Bonnaroo attract millions of attendees annually, boosting domestic and international travel. These festivals generate high visitor spending on accommodation, food, and local transport, benefiting regional economies. Expanding artist lineups and themed experiences enhance audience engagement and retention. Additionally, strong partnerships between event organizers, tourism boards, and hospitality providers increase marketing reach and destination visibility, positioning music festivals as key tourism catalysts nationwide.
- For instance, Goldenvoice, the organizer of Coachella, organized festivals in 2024 that reported a combined total attendance of over 250,000 people across the Coachella and Stagecoach events.
Rising Integration of Travel and Entertainment Experiences
The growing fusion of travel and entertainment is another significant market driver. Tourists increasingly seek immersive experiences that combine live performances with cultural exploration. Travel agencies and event organizers are curating music-themed itineraries, including local heritage tours, culinary experiences, and wellness retreats. The rise of social media and experiential marketing further amplifies the appeal of these multi-sensory journeys. Enhanced air connectivity, flexible travel packages, and digital booking platforms make participation in cross-state and destination-based concerts more convenient, encouraging greater visitor mobility and repeat attendance.
- For instance, Expedia Group recognized music tourism as a significant trend in 2024 and engaged in strategic initiatives to capture this market. This included leveraging its Expedia Group Live platform to promote hotel stays and travel packages around major music events. For example, the company partnered with the New Orleans Jazz & Heritage Festival to create a Travel Hub that showcased deals for festival-goers.
Expanding Investment in Infrastructure and Digital Platforms
Growing investment in event infrastructure and digital ticketing systems also drives market growth. Upgraded venues, improved accessibility, and smart crowd management systems enhance visitor safety and comfort. The adoption of AI-driven ticketing, facial recognition, and mobile apps ensures seamless entry and real-time updates. Streaming integrations enable hybrid attendance models, expanding audience reach beyond physical limits. State governments and private investors are also funding entertainment districts and music hubs, further strengthening the tourism ecosystem. This combination of physical and digital infrastructure investment continues to elevate the overall market experience.
Key Trends & Opportunities
Expansion of Hybrid and Niche Music Experiences
Hybrid and niche music experiences are emerging as key market trends. Organizers are merging live and virtual formats, allowing global fans to join remotely through streaming or virtual reality platforms. Niche events such as jazz retreats, folk heritage festivals, and eco-music gatherings cater to specific audience interests. This diversification attracts high-value travelers seeking cultural depth and sustainability. Moreover, partnerships with local communities and artists promote regional identity, supporting inclusive tourism development and creating new revenue streams within the U.S. music tourism ecosystem.
- For instance, Live Nation partnered with the livestreaming platform Veeps to expand access to hybrid concerts. The collaboration allows fans to attend shows both in person and virtually. This partnership is a real part of Live Nation's strategy for offering livestreamed and on-demand content.
Growth of Sustainable and Eco-Conscious Tourism Initiatives
The adoption of sustainable tourism practices is reshaping market opportunities. Event organizers are implementing green operations through waste reduction, renewable energy use, and eco-certified venues. Travelers increasingly prefer festivals that align with environmental values. Programs like reusable cup systems, solar-powered stages, and carbon offset partnerships enhance brand credibility. Tourism boards and music promoters jointly promote eco-tourism packages integrating low-impact travel and local sourcing. These sustainability initiatives attract environmentally conscious audiences while reinforcing the long-term resilience of the U.S. music tourism market.
Key Challenges
Rising Competition and Event Saturation
The rapid expansion of music tourism has intensified competition among event organizers and destinations. Many regions now host overlapping festivals and concerts, leading to audience fragmentation and declining ticket margins. High operating costs, including artist fees and logistics, further challenge profitability. Smaller events often struggle to secure sponsorships and brand collaborations. To stay competitive, organizers must innovate with unique themes, exclusive artist partnerships, and immersive experiences. Failure to differentiate offerings risks reduced visitor retention and limits long-term market sustainability.
Logistical and Regulatory Constraints
Logistical and regulatory issues remain significant barriers to market expansion. Large gatherings require complex coordination involving permits, crowd control, safety compliance, and environmental impact assessments. Unpredictable weather conditions and post-pandemic health regulations increase event planning costs and uncertainties. Transportation bottlenecks and limited accommodation in rural festival zones can restrict visitor inflow. Inconsistent state-level policies on event licensing and taxation also affect profitability. Addressing these challenges requires coordinated efforts between public agencies, event organizers, and local tourism authorities to ensure smoother operational frameworks and sustainable growth.
Regional Analysis
Northeast
The Northeast region accounted for 28% of the U.S. music tourism market in 2024, driven by vibrant cultural hubs such as New York, Boston, and Philadelphia. Major events like the Governors Ball and Boston Calling attract diverse audiences and international visitors. The region benefits from a strong concentration of live music venues, historic theaters, and music academies. Growth is supported by expanding tourism infrastructure, efficient transport connectivity, and strong local government backing for cultural festivals. Rising demand for urban music experiences continues to strengthen the region’s leadership in premium live event tourism.
Midwest
The Midwest held a 21% share of the U.S. music tourism market in 2024. The region’s strength lies in large-scale festivals such as Lollapalooza in Chicago and Summerfest in Milwaukee, which attract millions of attendees annually. A thriving local music scene and affordable travel options enhance accessibility for domestic tourists. Urban revitalization projects in Detroit and Minneapolis are transforming them into emerging cultural hotspots. Regional partnerships between event organizers and hospitality firms further boost visitor engagement. The Midwest’s focus on diverse genres and community-centered events continues to broaden its tourism appeal.
South
The South captured 32% of the U.S. music tourism market in 2024, the largest regional share. Renowned for its deep musical heritage in jazz, blues, country, and rock, cities such as Nashville, Austin, and New Orleans anchor growth. Iconic events like SXSW and CMA Fest attract global audiences, supported by robust entertainment infrastructure and year-round performances. Expanding air connectivity and music-driven travel packages amplify tourist inflow. The region’s blend of traditional and modern genres, along with strong state tourism promotion, solidifies its dominance in the national music tourism landscape.
West
The West region accounted for 19% of the U.S. music tourism market in 2024. California remains the primary hub, hosting world-famous events such as Coachella and Outside Lands that draw both domestic and international tourists. Expanding investments in festival infrastructure and digital ticketing platforms enhance visitor experience. The region’s scenic destinations and integration of music with art and wellness festivals attract high-spending travelers. Strong participation from hospitality and travel partners supports continued growth. The West’s fusion of innovation, entertainment diversity, and global recognition positions it as a key growth contributor to the overall market.
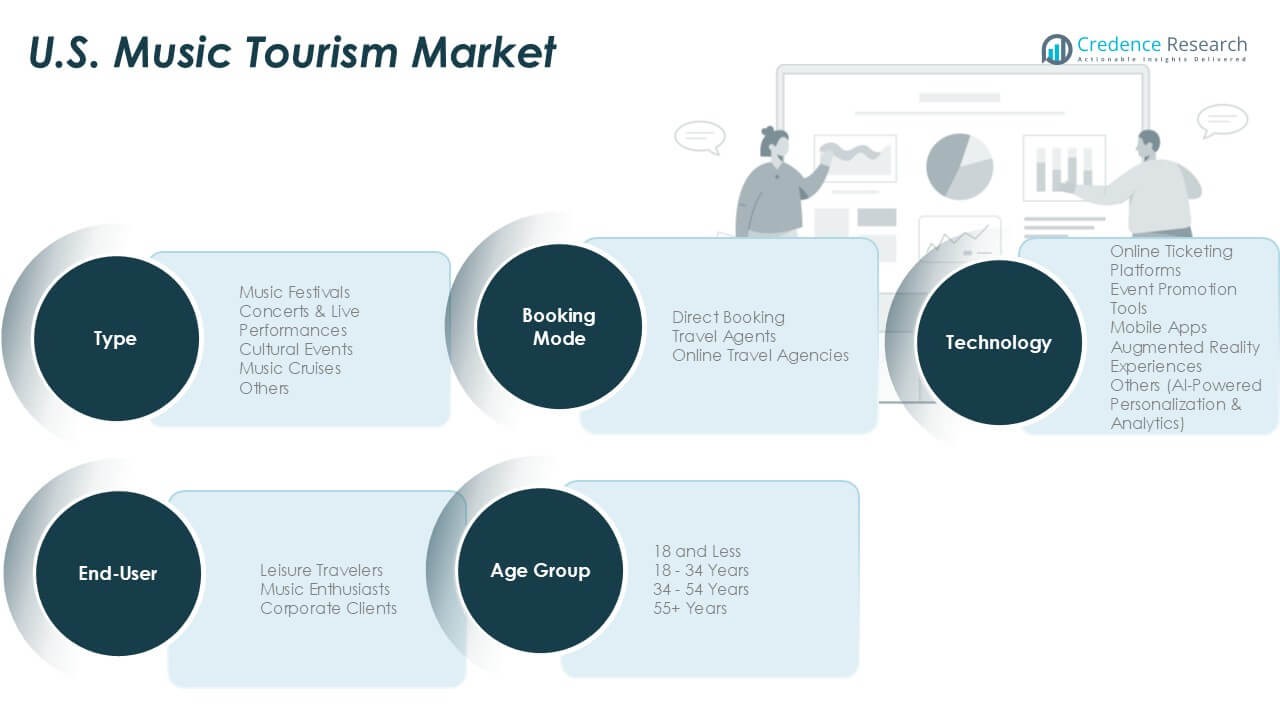
Market Segmentations:
By Type
- Music Festivals
- Concerts & Live Performances
- Cultural Events
- Music Cruises
- Others
By Age Group
- 18 and Less
- 18–34 Years
- 34–54 Years
- 55+ Years
By End-User
- Leisure Travelers
- Music Enthusiasts
- Corporate Clients
By Technology
- Online Ticketing Platforms
- Event Promotion Tools
- Mobile Apps
- Augmented Reality Experiences
- Others (AI-Powered Personalization & Analytics)
By Booking Mode
- Direct Booking
- Travel Agents
- Online Travel Agencies
By Geography
- Northeast
- Midwest
- South
- West
Competitive Landscape
The U.S. music tourism market features a highly competitive landscape driven by leading event organizers, ticketing platforms, and entertainment service providers. Key players such as Live Nation Entertainment, AEG Presents, and C3 Presents dominate through large-scale festival management, artist partnerships, and nationwide venue operations. Companies like Insomniac Events and Another Planet Entertainment specialize in genre-specific festivals that attract younger audiences and niche markets. Ticketing platforms including Ticketmaster, Eventbrite, and StubHub enhance accessibility through digital integration and personalized booking systems. Firms are increasingly investing in technology, sustainability, and hybrid event formats to strengthen customer engagement. Strategic collaborations with hospitality groups and tourism boards further expand market reach and event visibility. Continuous innovation, brand differentiation, and data-driven marketing remain central to maintaining competitiveness in a rapidly evolving live entertainment ecosystem that caters to both domestic and international travelers.
Key Player Analysis
- Livestyle, Inc.
- Live Nation Entertainment
- AEG Presents
- C3 Presents
- Insomniac Events
- Another Planet Entertainment
- The Bowery Presents
- Frank Productions
- Ticketmaster
- Eventbrite
- StubHub
- Vivid Seats
- Festicket
- Music Travel Consultants
Recent Developments
- In February 2025, Busan Concert Hall launched its official website to provide classical music enthusiasts with a seamless platform for ticket reservations, venue rentals, and academy schedules. Designed with responsive technology, the site ensures accessibility across devices and features a mobile ticketing service for quick entry via barcode scanning. The initiative enhances convenience and enriches the cultural experience for visitors in Busan.
- In August 2024, Brightline launched "The Big Concert Sweepstakes," offering tickets to Taylor Swift's sold-out Miami concert on October 20. The prize included two concert tickets, four round-trip Brightline tickets on a special "Tay-keover Sing-Along" train, and exclusive lounge perks. Participants entered by following Brightline on Instagram and signing a rail safety pledge, with the winner announced during Rail Safety Week in late September.
- In May 2024, Live Nation brought back its annual Concert Week promotion, offering USD 25 all-in tickets for over 5,000 shows across North America. Featuring artists like Janet Jackson and 21 Savage, the week-long event made live music more accessible to fans. Tickets, available from May 8 to May 14, could be purchased online without a promo code, allowing fans to enjoy significant savings on select concerts and festivals. The initiative aimed to enhance the summer touring season with budget-friendly options.
Report Coverage
The research report offers an in-depth analysis based on Type, Age Group, End-User, Technology, Booking Mode and Geography. It details leading market players, providing an overview of their business, product offerings, investments, revenue streams, and key applications. Additionally, the report includes insights into the competitive environment, SWOT analysis, current market trends, as well as the primary drivers and constraints. Furthermore, it discusses various factors that have driven market expansion in recent years. The report also explores market dynamics, regulatory scenarios, and technological advancements that are shaping the industry. It assesses the impact of external factors and global economic changes on market growth. Lastly, it provides strategic recommendations for new entrants and established companies to navigate the complexities of the market.
Future Outlook
- Expanding hybrid and virtual music experiences will broaden audience reach across states.
- Sustainable event operations will become a central focus for major festival organizers.
- Growth in destination-based festivals will boost partnerships with hospitality and travel firms.
- Integration of AI and data analytics will enhance ticketing, marketing, and crowd management.
- Younger demographics will continue to drive demand for immersive and tech-enabled music experiences.
- Increased investment in venue infrastructure will improve capacity and visitor comfort.
- Rising government support for cultural tourism will strengthen regional event ecosystems.
- Collaborations between artists and tourism boards will create new experiential travel offerings.
- Themed music tours and niche festivals will attract international travelers seeking cultural diversity.
- Digital engagement and streaming tie-ins will sustain post-event monetization and brand loyalty.
Request a Free Sample
Fill in your details and we'll send you a free sample report.
- Sample data tables & charts
- Research methodology
Need a Custom Version of This Report?
Tailor the scope, geography, or segments to your exact requirements.
- Custom geography or segment scope
- Direct access to our analyst team
Frequently Asked Questions
What is the current market size for the U.S. Music Tourism market, and what is its projected size in 2032?
At what Compound Annual Growth Rate is the U.S. Music Tourism market projected to grow between 2025 and 2032?
Which U.S. Music Tourism market segment held the largest share in 2024?
What are the primary factors fueling the growth of the U.S. Music Tourism market?
Who are the leading companies in the U.S. Music Tourism market?
Which region commanded the largest share of the U.S. Music Tourism market in 2024?
Table of Content
Chapter 1. Report Introduction
- 1.1 Report Description & Purpose
- 1.1.1 Report Title & Market Definition
- 1.1.2 Unique Selling Propositions (USP) & Key Differentiators
- 1.1.3 Value Proposition for Stakeholders
- 1.2 Research Objectives
- 1.2.1 Market Sizing Objectives (Volume & Revenue)
- 1.2.2 Segmentation Objectives
- 1.2.3 Competitive Intelligence Objectives
- 1.2.4 Forecast & Scenario Objectives
- 1.3 Report Scope
- 1.3.1 U.S. Music Tourism Scope – Types & Subtypes Covered
- 1.3.2 Geographic Scope – Regions & Countries Covered
- 1.3.3 Historical Period, Base Year & Forecast Period (2024; forecast to 2032)
- 1.3.4 Inclusions & Exclusions
- 1.4 HS Code & Classification Framework
- 1.5 Currency, Units & Pricing Basis
- 1.6 Target Stakeholders
- 1.7 Limitations & Assumptions
Chapter 2. Executive Summary
- 2.1 Global U.S. Music Tourism Market Snapshot
- 2.1.1 Market Size – Historical (2024) & Forecast (2024-2032) (2024: USD 33,079.6 million → 2032: USD 131,605.8 million)
- 2.1.2 Volume & Revenue – Global Totals
- 2.1.3 Key Market Highlights – Top Five Facts
- 2.2 U.S. Music Tourism Market Segmentation Snapshot
- 2.2.1 Market Split by Region – 2024 vs. 2032
- 2.3 Competitive Snapshot
- 2.3.1 Top 10 Players by Revenue Share – 2024
- 2.3.2 Top 10 Players by Volume Share – 2024
- 2.3.3 Recent Strategic Developments (18-Month Summary)
- 2.4 Key Investment Highlights & Strategic Conclusions
Chapter 3. U.S. Music Tourism Market Dynamics & Industry Analysis
- 3.1 Market Overview & Context
- 3.1.1 U.S. Music Tourism Market Position in the Broader Automotive Value Chain
- 3.1.2 OEM vs. Replacement Market Dynamics
- 3.1.3 Market Maturity & Development Stage by Region
- 3.2 U.S. Music Tourism Market Drivers
- 3.3 U.S. Music Tourism Market Restraints & Challenges
- 3.4 U.S. Music Tourism Market Opportunities
- 3.5 Porter's Five Forces Analysis
- 3.5.1 Threat of New Entrants
- 3.5.2 Bargaining Power of Suppliers
- 3.5.3 Bargaining Power of Buyers
- 3.5.4 Threat of Substitutes
- 3.5.5 Competitive Rivalry – Intensity Assessment
- 3.6 U.S. Music Tourism Value Chain Analysis
- 3.6.1 Upstream – Raw Material/Input Suppliers
- 3.6.1.1 Raw Material/Input 1
- 3.6.1.2 Raw Material/Input 2
- 3.6.1.3 Raw Material/Input 3
- 3.6.2 Midstream – Production/Manufacturing/Service Delivery
- 3.6.2.1 Production/Process Overview
- 3.6.2.2 Key Facility Locations & Capacity by Manufacturer
- 3.6.3 Downstream – Distribution & End Consumer
- 3.6.3.1 Primary Channel – B2B/OEM
- 3.6.3.2 Secondary Channels – Dealer, Retail, Online, Direct
- 3.6.4 Value Chain Profitability Analysis
- 3.6.1 Upstream – Raw Material/Input Suppliers
- 3.7 PESTEL Analysis
- 3.7.1 Political Factors
- 3.7.2 Economic Factors
- 3.7.3 Social Factors
- 3.7.4 Technological Factors
- 3.7.5 Environmental Factors
- 3.7.6 Legal Factors
- 3.8 U.S. Music Tourism Supply Chain Analysis
- 3.8.1 Raw Material/Input Supply Risk Assessment
- 3.8.2 Manufacturing Concentration Risk (Geographic Exposure)
- 3.8.3 Trade Disruption Impact Analysis
- 3.9 Regulatory & Policy Landscape
Note: The regulatory and policy landscape section covers regulations based on their applicability to the market, U.S. Music Tourism category, geography, and scope of the study. Only regulatory frameworks with a material impact on operations, compliance, trade, sustainability, or market access are analyzed in detail.
Chapter 4. Key Investment Pockets & Opportunity Analysis
- 4.1 U.S. Music Tourism Market Attractiveness Analysis
- 4.1.1 By Region – Investment Attractiveness Matrix (Volume × CAGR)
- 4.2 Absolute Revenue Growth Opportunity
- 4.2.1 By Region – Absolute USD Growth Through 2032
- 4.3 Incremental Volume Opportunity
- 4.3.1 By Region – Incremental Volume Through 2032
- 4.3.2 Segment – Incremental Volume
- 4.4 Emerging Submarket Opportunity Deep Dive (Subject to Applicability)
- 4.5 Emerging Market Opportunity Scorecards
- 4.5.1 United States
- 4.5.2 Europe
- 4.5.3 Asia
- 4.5.4 Middle East & Africa
Note: Emerging Market Opportunity Scorecards will be included based on relevance and strategic importance. Regions listed are indicative and may vary depending on data availability and market dynamics.
Chapter 5. U.S. Music Tourism Import-Export Analysis & Trade Flows
- 5.1 Global Trade Overview
- 5.1.1 Global Export Value by Country (2024)
- 5.1.2 Global Export Volume by Country (2024)
- 5.1.3 Global Import Value by Country (2024)
- 5.1.4 Global Import Volume by Country (2024)
- 5.1.5 Net Trade Balance by Country (2024)
- 5.2 Export Analysis – Segment
- 5.2.1 Type 1 (HS Code)
- 5.2.2 Type 2 (HS Code)
- 5.2.3 Type 3 (HS Code)
- 5.2.4 Type 4 (HS Code)
- 5.2.5 Type 5 (HS Code)
- 5.3 Import Analysis – Segment
- 5.3.1 Type 1 (HS Code)
- 5.3.2 Type 2 (HS Code)
- 5.3.3 Type 3 (HS Code)
- 5.3.4 Type 4 (HS Code)
- 5.3.5 Type 5 (HS Code)
- 5.4 Average Unit Trade Prices
- 5.4.1 Average Export Price – Segment & Country
- 5.4.2 Average Import Price – Segment & Source Country
- 5.4.3 Price Trends (2024)
- 5.5 Key Trade Route Analysis
- 5.5.1 Trade Route 1
- 5.5.2 Trade Route 2
- 5.5.3 Trade Route 3
- 5.5.4 Trade Route 4
- 5.5.5 Trade Route 5
- 5.6 Trade Policy Impact Assessment
- 5.6.1 US Anti-Dumping & Section 301 Tariffs
- 5.6.2 EU Customs Union Impact
- 5.6.3 Major Free Trade Agreements
- 5.6.4 USMCA Rules of Origin
Note: Trade policy analysis will be included only where relevant to the U.S. Music Tourism market.
Chapter 6. Competitive Landscape & Company Benchmarking
- 6.1 U.S. Music Tourism Market Concentration & Structure
- 6.1.1 Herfindahl-Hirschman Index (HHI) – vs. 2024
- 6.1.2 Tier 1, Tier 2 & Tier 3 Market Structure
- 6.1.3 Global, Regional & Local Player Dynamics
- 6.2 U.S. Music Tourism Market Share Analysis – 2024
- 6.2.1 Global Revenue Share by Company
- 6.2.2 Global Volume Share by Company
- 6.2.3 Regional Revenue Share
- 6.2.4 Market Share Evolution ( vs. 2024)
- 6.2.5 OEM Segment Share by Company
- 6.2.6 Replacement Segment Share by Company
- 6.3 Production/Delivery Capacity & Facility Analysis
- 6.3.1 Global Installed Capacity
- 6.3.2 Capacity Utilization Rates
- 6.3.3 Production/Output Volume
- 6.3.4 Facility Locations & Capacity Map
- 6.3.5 Planned Capacity Additions
- 6.4 U.S. Music Tourism Competitive Benchmarking Matrix
- 6.4.1 Revenue, Volume, CAGR & Profitability Comparison
- 6.4.2 Channel Revenue Mix
- 6.4.3 Geographic Revenue Exposure
- 6.4.4 R&D Intensity
- 6.4.5 Sustainability Maturity
- 6.5 Strategic Developments in U.S. Music Tourism (Last 24 Months)
- 6.5.1 Mergers, Acquisitions & Divestments
- 6.5.2 New U.S. Music Tourism Launches
- 6.5.3 Facility Expansions
- 6.5.4 Strategic Alliances, Joint Ventures & Partnerships
- 6.5.5 Distribution Expansion & Market Entry
- 6.5.6 Sustainability & ESG Initiatives
- 6.6 Competitive Strategy Mapping
- 6.6.1 Leader, Challenger, Follower & Niche Classification
- 6.6.2 Pricing Strategy Comparison
- 6.6.3 Channel Strategy Matrix
Note: Strategic developments are included based on their materiality and the availability of reliable information.
Chapter 7. Global U.S. Music Tourism Market – By Distribution Channel
- 7.1 Segment Overview
- 7.1.1 Volume & Revenue Split by Channel (2024 & 2032)
- 7.1.2 Channel Mix Evolution (2024-2032)
Chapter 8. Regional Market Analysis – Global Overview
- 8.1 Global Regional Overview
- 8.1.1 Regional Volume Share
- 8.1.2 Regional Revenue Share
- 8.1.3 Regional Volume by Region
- 8.1.4 Regional Revenue by Region
- 8.1.5 Regional Forecast Through 2032
- 8.2 Cross-Regional Segment Analysis
- 8.2.1 By Distribution Channel
- 8.2.2 By Brand/Price Tier
Chapter 9. North America U.S. Music Tourism Market
- 9.1 United States
- 9.2 Canada
- 9.3 Mexico
Chapter 10. Europe U.S. Music Tourism Market
- 10.1 Germany
- 10.2 France
- 10.3 Italy
- 10.4 United Kingdom
- 10.5 Spain
- 10.6 Poland
- 10.7 Russia
- 10.8 Netherlands
- 10.9 Belgium
- 10.10 Sweden
- 10.11 Denmark
- 10.12 Norway
- 10.13 Rest of Europe
Chapter 11. Asia Pacific U.S. Music Tourism Market
- 11.1 China
- 11.2 India
- 11.3 Japan
- 11.4 South Korea
- 11.5 Thailand
- 11.6 Indonesia
- 11.7 Vietnam
- 11.8 Malaysia
- 11.9 Australia
- 11.10 Rest of Asia Pacific
Chapter 12. Latin America U.S. Music Tourism Market
- 12.1 Brazil
- 12.2 Argentina
- 12.3 Colombia
- 12.4 Chile
- 12.5 Rest of Latin America
Chapter 13. Middle East U.S. Music Tourism Market
- 13.1 Saudi Arabia
- 13.2 United Arab Emirates
- 13.3 Turkey
- 13.4 Israel
- 13.5 Iran
- 13.6 Rest of the Middle East
Chapter 14. Africa U.S. Music Tourism Market
- 14.1 South Africa
- 14.2 Egypt
- 14.3 Nigeria
- 14.4 Morocco
- 14.5 Rest of Africa
Chapter 15. U.S. Music Tourism Company Profiles
- 15.1 [Company 01]
- 15.1.1 Company Overview
- 15.1.2 Key Management Personnel
- 15.1.3 Products & Services Portfolio
- 15.1.4 Financial Performance
- 15.1.5 Key Market Focus & Geographic Presence
- 15.1.6 Recent Developments & Strategic Initiatives
Note: The company profile list is preliminary and may change based on research findings, market developments, data availability, and client requirements.
Chapter 16. Appendices
- Appendix A – List of Abbreviations & Acronyms
- Appendix B – Industry Classification Code Reference – Full Series
- Appendix C – Production & Capacity Data Tables
- Appendix D – End-Use & Demand Base Tables
- Appendix E – Consumption & Replacement Rate Assumptions
- Appendix F – ASP Reference Tables
- Appendix G – Manufacturing & Facility Database
- Appendix H – Import-Export Data Tables
- Appendix I – Regulatory Summary Tables
- Appendix J – Primary Research Participant List (Anonymized)
- Appendix K – Primary Research Questionnaire Framework
- Appendix L – Data Sources & Bibliography
- Appendix M – Market Size Divergence & Source Comparison
Chapter 17. Research Methodology
- 17.1 Research Framework & Philosophy
- 17.2 Secondary Research – Sources, Hierarchy & Data Extraction
- 17.3 Data Modeling – Bottom-Up & Top-Down Market Sizing
- 17.4 Primary Research – Stakeholder Framework, LOI & Sample Sizes
- 17.5 Forecast Methodology – Regression, Scenario & Sensitivity Analysis
- 17.6 Quality Control – Four-Layer Validation Framework
- 17.7 Limitations & Standard Assumptions
- 17.8 Disclaimer