
Market Overview:
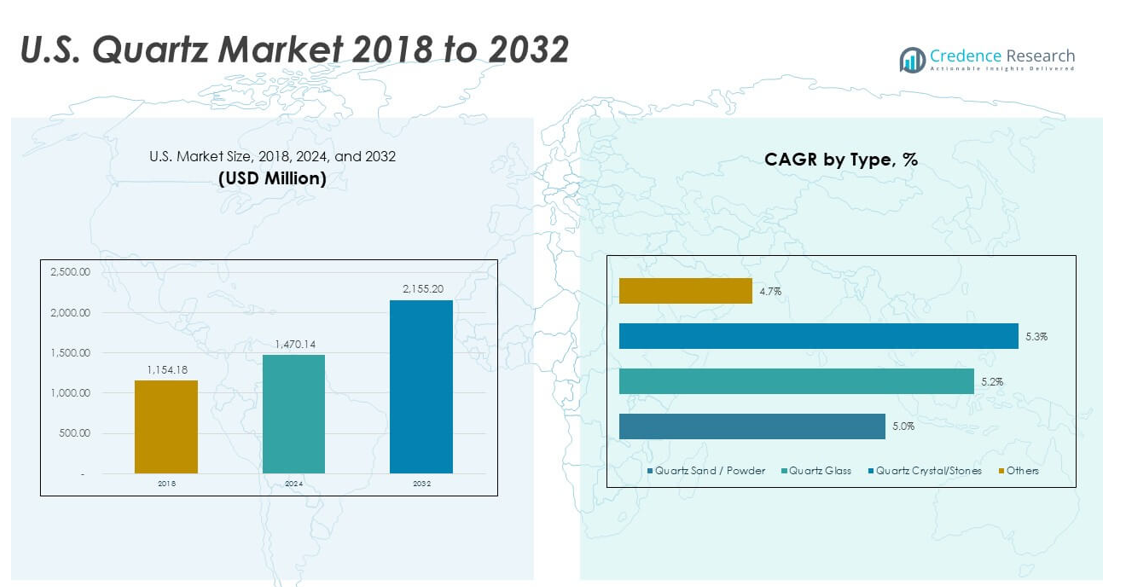
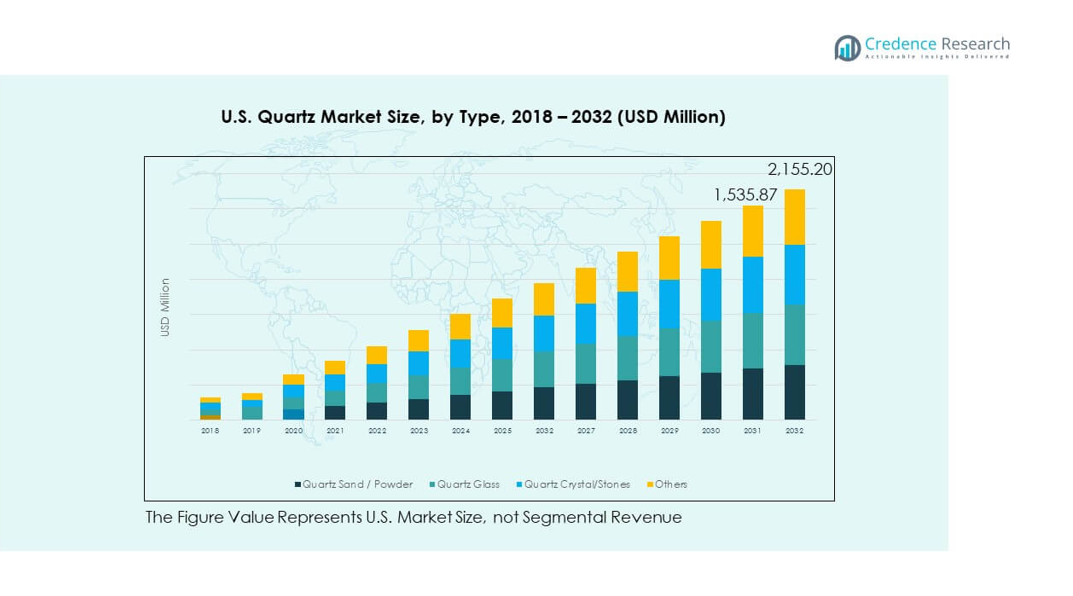
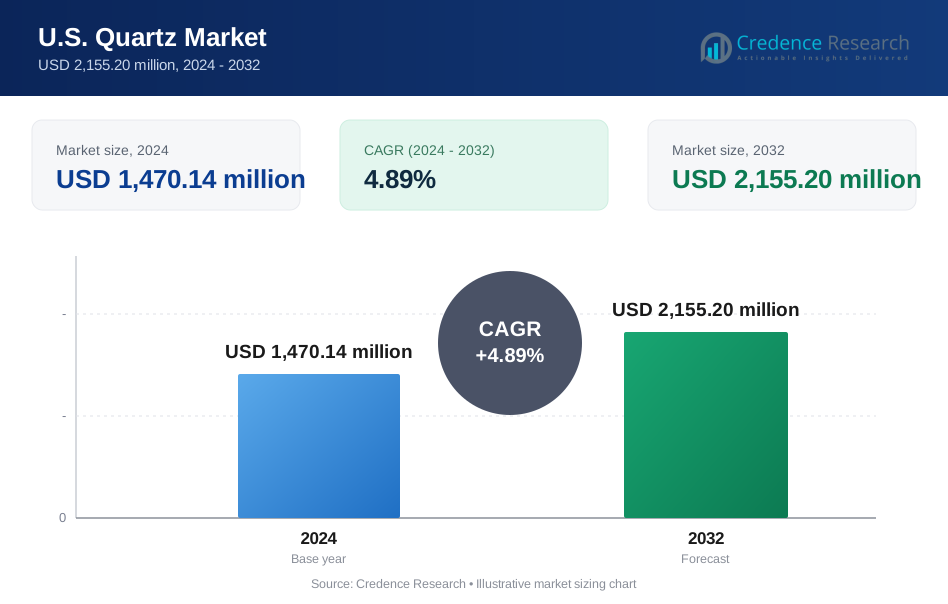
The U.S. Quartz Market size was valued at USD 1,154.18 million in 2018 to USD 1,470.14 million in 2024 and is anticipated to reach USD 2,155.20 million by 2032, at a CAGR of 4.89% during the forecast period.
| REPORT ATTRIBUTE | DETAILS |
|---|---|
| Historical Period | 2020-2023 |
| Base Year | 2024 |
| Forecast Period | 2025-2032 |
| U.S. Quartz Market Size 2024 | USD 1,470.14 million |
| U.S. Quartz Market , CAGR | 4.89% |
| U.S. Quartz Market Size 2032 | USD 2,155.20 million |
The market growth is driven by strong demand from electronics, construction, and solar energy sectors. Rising adoption of quartz in semiconductors supports advanced technological applications, while its durability fuels demand in countertops and architectural uses. Increasing deployment of quartz glass in solar panels further strengthens the industry outlook. Companies continue to invest in innovation, focusing on high-purity materials and customized solutions for specialized industries.
Within the U.S., quartz consumption is concentrated in regions with advanced semiconductor manufacturing hubs and strong construction activity. States with higher solar adoption also lead in quartz demand due to its role in photovoltaic applications. Emerging demand is seen in developing industrial clusters and regions prioritizing infrastructure modernization. Market penetration is expanding into both commercial and residential projects, supported by changing lifestyle preferences and renewable energy goals.
Market Insights:
- The U.S. Quartz Market was valued at USD 1,154.18 million in 2018, reached USD 1,470.14 million in 2024, and is projected to hit USD 2,155.20 million by 2032, at a CAGR of 4.89%.
- The West led the U.S. Quartz Market with a 38.5% share in 2024, driven by semiconductor hubs, solar projects, and high adoption in residential and commercial construction.
- The Northeast accounted for 16.3% share, supported by premium home renovations and quartz demand in research and healthcare facilities. The Midwest and South together represented 32.7%, fueled by housing growth, manufacturing, and solar investments.
- The West is the fastest-growing region, supported by technology clusters, renewable energy adoption, and lifestyle-driven design demand.
- Quartz glass accounted for 36% of the market in 2024, while quartz sand/powder held 28%, reflecting strong demand across semiconductors, construction, and renewable energy sectors.
Market Drivers:
Rising Demand from Electronics and Semiconductor Manufacturing
The U.S. Quartz Market benefits from rapid advances in electronics and semiconductor production. Quartz plays a critical role in wafer processing, optical components, and precision instruments. Its thermal stability and purity make it essential for chip fabrication processes. The U.S. semiconductor industry’s expansion continues to elevate quartz demand. Investment in next-generation devices and 5G networks creates further growth opportunities. The market also gains from collaborations between material suppliers and tech companies. Innovation in quartz-based components ensures product performance. It positions quartz as a strategic material for future electronics.
- For instance, In March 2025, TSMC announced a massive expansion of its U.S. investment to $165 billion, which includes new fabrication plants in Phoenix, Arizona.
Growth in Construction and Interior Applications
The construction sector strongly supports demand for quartz products in the U.S. Quartz countertops, flooring, and decorative uses remain popular due to durability and aesthetics. Rising consumer spending on home renovation boosts adoption of engineered quartz surfaces. Architectural projects also highlight quartz as a premium, low-maintenance material. Developers prefer it for long-term value and sustainability features. Commercial buildings integrate quartz surfaces for resilience in high-use spaces. Growing urbanization strengthens its role across residential and commercial applications. The U.S. Quartz Market continues to capitalize on this enduring demand.
Expanding Solar Energy Installations Across the U.S.
Solar energy adoption directly fuels the demand for quartz components. Quartz glass and crucibles are vital for solar cell and photovoltaic panel production. Federal and state initiatives to expand renewable energy increase the need for these applications. Rising investments in clean energy infrastructure expand quartz supply requirements. It also benefits from advancements in solar technologies requiring high-purity quartz materials. Producers are scaling operations to meet renewable energy targets. With solar installations spreading rapidly across states, quartz consumption shows steady growth. It strengthens the link between energy transition and material demand.
Innovation in High-Purity and Specialty Quartz Products
Innovation plays a pivotal role in shaping the U.S. Quartz Market. Companies focus on producing high-purity quartz with superior chemical resistance and optical clarity. Specialty quartz products support industries like medical devices, aerospace, and advanced optics. Continuous R&D investments enhance material performance in demanding environments. Manufacturers explore nano-structured quartz solutions to meet emerging industrial needs. This focus aligns with rising customer preference for customized and durable products. Partnerships between manufacturers and research institutions accelerate innovation cycles. It ensures the market remains competitive and future-ready. The U.S. Quartz Market grows steadily through such advancements.
Market Trends:
Shift Toward Engineered Quartz in Residential and Commercial Spaces
The U.S. Quartz Market experiences strong adoption of engineered quartz products. Consumers prefer quartz for its durability, non-porous structure, and range of designs. Kitchen countertops and bathroom applications dominate usage due to resilience and ease of maintenance. Builders and contractors favor quartz over natural stone for its consistent quality. The rising trend of open-concept interiors boosts its appeal. Design flexibility with various colors and patterns adds to consumer preference. Increased marketing by leading brands reinforces this trend. The market grows by aligning with evolving lifestyle and design preferences.
- For instance, Cosentino reported in March 2025 that the company's total revenue was down 6.7% in 2024 compared to 2023, following a market normalization after the exceptional growth of 2022.
Integration of Quartz in Advanced Medical and Optical Applications
Medical and optical industries are increasingly relying on quartz for specialized applications. Its high purity and clarity make it suitable for precision optical instruments. Medical equipment benefits from quartz components for stability and safety. The market expands as healthcare innovation drives demand for advanced diagnostic tools. Research laboratories also integrate quartz glass in instruments requiring high accuracy. Growth in biotechnology and life sciences adds to the trend. U.S. producers cater to this segment with high-performance quartz solutions. The U.S. Quartz Market aligns with the rise of health-tech and advanced optics.
- For instance, in August 2024, Beckman Coulter Life Sciences launched the TruSight Oncology 500 DNA/RNA assay on the Biomek NGeniuS System, providing an innovative automated solution for oncology research.
Sustainability and Recycling Practices in Quartz Production
The industry is moving toward sustainable practices in quartz production. Companies adopt energy-efficient manufacturing processes to reduce carbon emissions. Recycling initiatives for quartz waste also gain attention, enhancing resource efficiency. Demand for eco-friendly building materials supports this trend. Consumers value quartz products manufactured with minimal environmental impact. Regulations promote compliance with green building standards, creating market opportunities. Producers highlight sustainability as part of their brand identity. It ensures stronger consumer trust while aligning with national environmental goals. The U.S. Quartz Market strengthens its position through responsible production practices.
Customization and Digitalization of Quartz Design Solutions
Digitalization shapes the way quartz products are designed and marketed. Virtual visualization tools help customers preview quartz applications in real environments. Customization becomes a significant trend as consumers seek personalized solutions. The market adapts with modular product offerings and bespoke designs. Online distribution platforms expand access and enhance engagement. Brands use digital tools to streamline sales and service. Builders and architects also benefit from design simulation platforms. The U.S. Quartz Market grows by integrating digital innovation into consumer experiences. It sets new benchmarks for customer interaction and value delivery.
Market Challenges Analysis:
High Production Costs and Supply Chain Constraints
The U.S. Quartz Market faces challenges from rising production costs. Mining, processing, and refining quartz to high purity levels require advanced technologies. These processes are capital intensive, increasing pressure on producers. Supply chain disruptions also affect the consistent availability of raw quartz. Import dependence on certain grades poses risks to stability. Transportation costs add to the overall burden on margins. Companies struggle to balance quality with cost efficiency in this environment. It restricts smaller firms from scaling operations and limits competitive diversity.
Regulatory Compliance and Environmental Restrictions
Strict regulatory standards challenge the quartz industry in the U.S. Environmental regulations require sustainable mining and manufacturing practices. Compliance involves additional costs for pollution control and waste management. Firms must also meet health and safety requirements for workers handling quartz dust. These obligations affect operational flexibility and profitability. Non-compliance risks legal actions, fines, and reputational damage. Companies invest heavily in monitoring systems and certifications to stay competitive. It creates barriers for new entrants in the market. The U.S. Quartz Market navigates these challenges while pursuing long-term growth.
Market Opportunities:
Growth in Advanced Technology Applications
The U.S. Quartz Market has strong opportunities in advanced technology sectors. Quartz plays a vital role in optics, photonics, and high-frequency electronics. Expanding defense and aerospace programs drive the adoption of specialized quartz components. It benefits from R&D investments in next-generation electronics. Companies can expand by catering to these niche, high-value applications. This opportunity aligns with the U.S. focus on innovation-driven industries. New entrants can target technology partnerships to gain traction. It ensures quartz demand remains resilient across diverse industries.
Expansion in Renewable Energy and Green Building Materials
The U.S. Quartz Market finds growth potential in renewable energy and sustainable construction. Quartz products are integral to solar energy systems and energy-efficient building materials. Federal incentives and green building codes accelerate adoption. Construction projects across residential and commercial sectors adopt quartz for eco-friendly applications. Firms that highlight sustainable sourcing and low-impact production gain market share. Opportunities also emerge in developing quartz for next-generation photovoltaic technologies. It ensures the market remains aligned with national sustainability goals. This creates long-term growth pathways for the industry.
Market Segmentation Analysis:
Type-Based
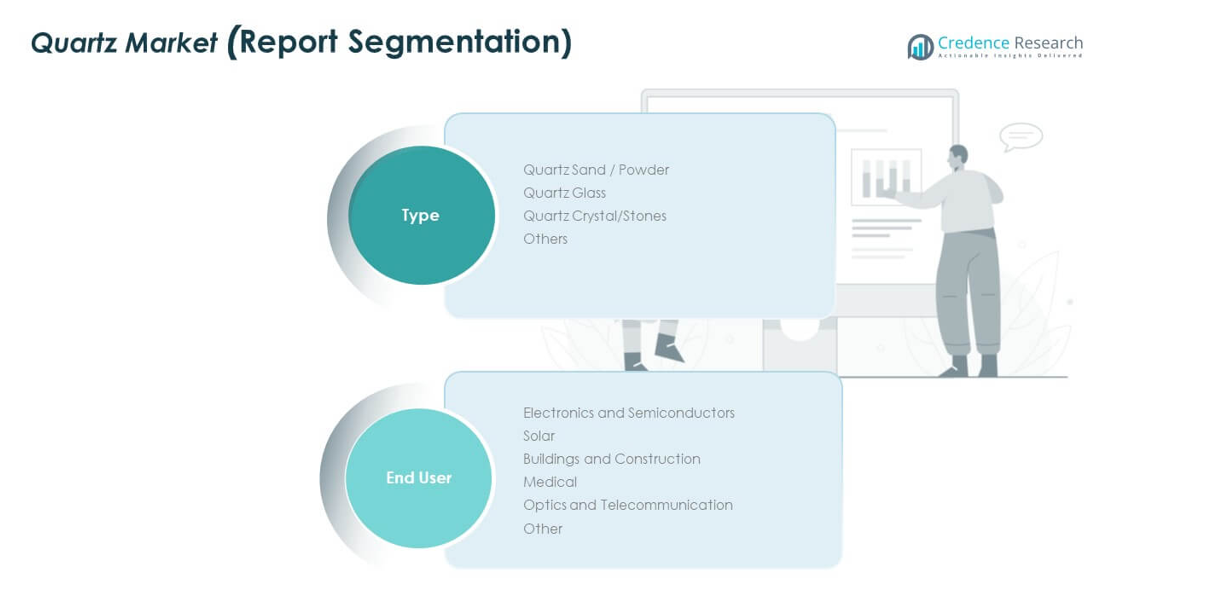
The U.S. Quartz Market is segmented into quartz sand/powder, quartz glass, quartz crystal/stone, and others. Quartz glass holds strong significance due to its role in electronics, semiconductors, and solar technologies. Quartz sand and powder find wide use in construction and manufacturing. Crystal and stone applications dominate decorative and architectural uses. Each type serves unique industries, ensuring balanced demand across sectors.
- For instance, Solar Power World reported in April 2024 on the growth of domestic solar manufacturing in Texas, including GAF Energy opening a solar shingle factory in Georgetown. This reflected a larger industry trend of increasing U.S.-based production to support the manufacture of new photovoltaic panels.
End User
End users include electronics and semiconductors, solar, buildings and construction, medical, optics and telecommunication, and others. Electronics and semiconductor applications lead the market due to increasing chip and device production. Solar applications expand with growing renewable energy projects across the U.S. Construction and medical sectors contribute steadily through demand for durable surfaces and precision instruments. The U.S. Quartz Market benefits from this diverse end-use spectrum, strengthening its resilience and long-term outlook.
- For instance, AGC Inc. reported in its June 2024 IR Day presentation that its advanced glass and electronics products were being developed to serve the next generation of computing and communications, which will involve co-packaged optics (CPO). The company has announced the development of polymer and glass optical waveguides suitable for CPO applications.
Segmentation:
By Type
- Quartz Sand / Powder
- Quartz Glass
- Quartz Crystal / Stone
- Others
By End User
- Electronics and Semiconductor
- Solar
- Buildings and Construction
- Medical
- Optics and Telecommunication
- Others
Regional Analysis:
Northeast Region
The Northeast held a significant share of the U.S. Quartz Market in 2024, supported by demand from urban centers such as New York, Massachusetts, and Pennsylvania. Residential remodelling projects and premium home construction drive strong adoption of quartz countertops and surfaces. The region also benefits from investments in healthcare and research facilities, boosting quartz use in medical and optical applications. Commercial infrastructure upgrades continue to expand opportunities for engineered quartz products. Consumer preference for durable, low-maintenance materials enhances regional growth. It shows steady expansion as design-focused renovations remain a key trend. The Northeast remains a high-value contributor with consistent demand across sectors.
Midwest and South Region
The Midwest and South together represented a large portion of the U.S. Quartz Market, supported by both industrial and residential activity. The Midwest benefits from a strong manufacturing base, including electronics and semiconductor applications. The South shows rising adoption in housing projects across Texas, Florida, and Georgia, with quartz surfaces gaining popularity in large-scale residential construction. Renewable energy projects, particularly solar, contribute to higher quartz demand in select states. The retail and commercial sectors also play a role in increasing usage of engineered quartz products. It reflects growth across diverse industries while maintaining steady regional momentum. Both regions are expected to expand further as construction and industrial activity scale up.
West Region
The West held the leading regional share of the U.S. Quartz Market in 2024, accounting for 38.5%. California drives this dominance with its strong base in electronics, semiconductors, and solar energy. The region also sees high adoption of quartz in residential and commercial construction, supported by lifestyle-driven design choices and sustainability goals. Oregon and Washington contribute with renewable energy projects and growing housing demand. Expanding technology hubs continue to increase quartz requirements for advanced applications. The West reflects a strong balance between industrial and consumer-driven demand. It remains the most dynamic region, sustaining leadership through diverse and innovation-driven industries.
Key Player Analysis:
- Cambria
- MSI Q Quartz
- DuPont
- Elkem ASA
- LG Viatera
- Heraeus Holding
- HanStone Quartz
- Santa Margherita Quartz
- Saint Gobain S.A.
- Creswick Quartz
Competitive Analysis:
The U.S. Quartz Market remains competitive with a blend of global leaders and domestic manufacturers. Companies such as Cambria, DuPont, and LG Viatera hold significant influence through their premium product portfolios. International players like Elkem ASA, Heraeus Holding, and Saint Gobain S.A. expand reach through technological expertise and strong distribution networks. Emerging firms focus on niche applications and sustainable quartz solutions. Competition is shaped by design innovation, quality consistency, and customer engagement. Companies also strengthen their presence through acquisitions, partnerships, and regional expansions. It highlights a balanced mix of established dominance and rising challengers. The U.S. Quartz Market thrives under this competitive dynamic.
Recent Developments:
- In February 2025, Cambria introduced four new luxury quartz surface designs—Remington Brass, Remington Steel, Brighton, and Berkshire Steel Satin Ridge—at the Kitchen & Bath Industry Show (KBIS) in Las Vegas. These new products embody Cambria’s commitment to pushing design innovation and advancing quartz surface technology.
- On January 15, 2025, DuPont announced that it will complete the spin-off of its Electronics business by November 1, 2025, enabling a renewed focus on strategic growth segments. This separation aims to enhance shareholder value and optimize their quartz and related portfolios for U.S. customers.
- On September 18, 2025, Elkem ASA entered into an exclusive sales process for its Silicones division, a move in line with its strategic review to accelerate growth in silicon-based materials. The deal is projected to close in the first half of 2026 and marks a substantial corporate development in the quartz sector.
- On February 25, 2025, LX Hausys, the manufacturer of Viatera, launched six new American-made Viatera quartz colors at KBIS 2025, further boosting their presence in the U.S. market and showcasing innovations like NeoQ™ low-silica technology for improved sustainability and visual quality.
Report Coverage:
The research report offers an in-depth analysis based on type and end user. It details leading market players, providing an overview of their business, product offerings, investments, revenue streams, and key applications. Additionally, the report includes insights into the competitive environment, SWOT analysis, current market trends, as well as the primary drivers and constraints. Furthermore, it discusses various factors that have driven market expansion in recent years. The report also explores market dynamics, regulatory scenarios, and technological advancements that are shaping the industry. It assesses the impact of external factors and global economic changes on market growth. Lastly, it provides strategic recommendations for new entrants and established companies to navigate the complexities of the market.
Future Outlook:
- Rising demand from electronics and semiconductor applications.
- Expanding adoption in residential and commercial construction.
- Increased use of quartz in renewable energy projects.
- Innovation in high-purity quartz for advanced technologies.
- Strong focus on eco-friendly and sustainable quartz products.
- Growing digitalization in design and customization.
- Expansion of quartz applications in healthcare and optics.
- Emerging opportunities in aerospace and defense industries.
- Regional expansion through North American and Asian collaborations.
- Long-term growth supported by lifestyle and technology shifts.
Request a Free Sample
Fill in your details and we'll send you a free sample report.
- Sample data tables & charts
- Research methodology
Need a Custom Version of This Report?
Tailor the scope, geography, or segments to your exact requirements.
- Custom geography or segment scope
- Direct access to our analyst team
Frequently Asked Questions
What is the current market size for U.S. Quartz Market, and what is its projected size in 2032?
At what Compound Annual Growth Rate is the U.S. Quartz Market projected to grow between 2024 and 2032?
Which U.S. Quartz Market segment held the largest share in 2024?
What are the primary factors fueling the growth of the U.S. Quartz Market?
Who are the leading companies in the U.S. Quartz Market?
Table of Content
Chapter 1. Report Introduction
- 1.1 Report Description & Purpose
- 1.1.1 Report Title & Market Definition
- 1.1.2 Unique Selling Propositions (USP) & Key Differentiators
- 1.1.3 Value Proposition for Stakeholders
- 1.2 Research Objectives
- 1.2.1 Market Sizing Objectives (Volume & Revenue)
- 1.2.2 Segmentation Objectives
- 1.2.3 Competitive Intelligence Objectives
- 1.2.4 Forecast & Scenario Objectives
- 1.3 Report Scope
- 1.3.1 U.S. Quartz Scope – Types & Subtypes Covered
- 1.3.2 Geographic Scope – Regions & Countries Covered
- 1.3.3 Historical Period, Base Year & Forecast Period (2024; forecast to 2032)
- 1.3.4 Inclusions & Exclusions
- 1.4 HS Code & Classification Framework
- 1.5 Currency, Units & Pricing Basis
- 1.6 Target Stakeholders
- 1.7 Limitations & Assumptions
Chapter 2. Executive Summary
- 2.1 Global U.S. Quartz Market Snapshot
- 2.1.1 Market Size – Historical (2024) & Forecast (2024-2032) (2024: USD 1,470.14 million → 2032: USD 2,155.20 million)
- 2.1.2 Volume & Revenue – Global Totals
- 2.1.3 Key Market Highlights – Top Five Facts
- 2.2 U.S. Quartz Market Segmentation Snapshot
- 2.2.1 Market Split by Region – 2024 vs. 2032
- 2.3 Competitive Snapshot
- 2.3.1 Top 10 Players by Revenue Share – 2024
- 2.3.2 Top 10 Players by Volume Share – 2024
- 2.3.3 Recent Strategic Developments (18-Month Summary)
- 2.4 Key Investment Highlights & Strategic Conclusions
Chapter 3. U.S. Quartz Market Dynamics & Industry Analysis
- 3.1 Market Overview & Context
- 3.1.1 U.S. Quartz Market Position in the Broader Automotive Value Chain
- 3.1.2 OEM vs. Replacement Market Dynamics
- 3.1.3 Market Maturity & Development Stage by Region
- 3.2 U.S. Quartz Market Drivers
- 3.3 U.S. Quartz Market Restraints & Challenges
- 3.4 U.S. Quartz Market Opportunities
- 3.5 Porter's Five Forces Analysis
- 3.5.1 Threat of New Entrants
- 3.5.2 Bargaining Power of Suppliers
- 3.5.3 Bargaining Power of Buyers
- 3.5.4 Threat of Substitutes
- 3.5.5 Competitive Rivalry – Intensity Assessment
- 3.6 U.S. Quartz Value Chain Analysis
- 3.6.1 Upstream – Raw Material/Input Suppliers
- 3.6.1.1 Raw Material/Input 1
- 3.6.1.2 Raw Material/Input 2
- 3.6.1.3 Raw Material/Input 3
- 3.6.2 Midstream – Production/Manufacturing/Service Delivery
- 3.6.2.1 Production/Process Overview
- 3.6.2.2 Key Facility Locations & Capacity by Manufacturer
- 3.6.3 Downstream – Distribution & End Consumer
- 3.6.3.1 Primary Channel – B2B/OEM
- 3.6.3.2 Secondary Channels – Dealer, Retail, Online, Direct
- 3.6.4 Value Chain Profitability Analysis
- 3.6.1 Upstream – Raw Material/Input Suppliers
- 3.7 PESTEL Analysis
- 3.7.1 Political Factors
- 3.7.2 Economic Factors
- 3.7.3 Social Factors
- 3.7.4 Technological Factors
- 3.7.5 Environmental Factors
- 3.7.6 Legal Factors
- 3.8 U.S. Quartz Supply Chain Analysis
- 3.8.1 Raw Material/Input Supply Risk Assessment
- 3.8.2 Manufacturing Concentration Risk (Geographic Exposure)
- 3.8.3 Trade Disruption Impact Analysis
- 3.9 Regulatory & Policy Landscape
Note: The regulatory and policy landscape section covers regulations based on their applicability to the market, U.S. Quartz category, geography, and scope of the study. Only regulatory frameworks with a material impact on operations, compliance, trade, sustainability, or market access are analyzed in detail.
Chapter 4. Key Investment Pockets & Opportunity Analysis
- 4.1 U.S. Quartz Market Attractiveness Analysis
- 4.1.1 By Region – Investment Attractiveness Matrix (Volume × CAGR)
- 4.2 Absolute Revenue Growth Opportunity
- 4.2.1 By Region – Absolute USD Growth Through 2032
- 4.3 Incremental Volume Opportunity
- 4.3.1 By Region – Incremental Volume Through 2032
- 4.3.2 Segment – Incremental Volume
- 4.4 Emerging Submarket Opportunity Deep Dive (Subject to Applicability)
- 4.5 Emerging Market Opportunity Scorecards
- 4.5.1 United States
- 4.5.2 Europe
- 4.5.3 Asia
- 4.5.4 Middle East & Africa
Note: Emerging Market Opportunity Scorecards will be included based on relevance and strategic importance. Regions listed are indicative and may vary depending on data availability and market dynamics.
Chapter 5. U.S. Quartz Import-Export Analysis & Trade Flows
- 5.1 Global Trade Overview
- 5.1.1 Global Export Value by Country (2024)
- 5.1.2 Global Export Volume by Country (2024)
- 5.1.3 Global Import Value by Country (2024)
- 5.1.4 Global Import Volume by Country (2024)
- 5.1.5 Net Trade Balance by Country (2024)
- 5.2 Export Analysis – Segment
- 5.2.1 Type 1 (HS Code)
- 5.2.2 Type 2 (HS Code)
- 5.2.3 Type 3 (HS Code)
- 5.2.4 Type 4 (HS Code)
- 5.2.5 Type 5 (HS Code)
- 5.3 Import Analysis – Segment
- 5.3.1 Type 1 (HS Code)
- 5.3.2 Type 2 (HS Code)
- 5.3.3 Type 3 (HS Code)
- 5.3.4 Type 4 (HS Code)
- 5.3.5 Type 5 (HS Code)
- 5.4 Average Unit Trade Prices
- 5.4.1 Average Export Price – Segment & Country
- 5.4.2 Average Import Price – Segment & Source Country
- 5.4.3 Price Trends (2024)
- 5.5 Key Trade Route Analysis
- 5.5.1 Trade Route 1
- 5.5.2 Trade Route 2
- 5.5.3 Trade Route 3
- 5.5.4 Trade Route 4
- 5.5.5 Trade Route 5
- 5.6 Trade Policy Impact Assessment
- 5.6.1 US Anti-Dumping & Section 301 Tariffs
- 5.6.2 EU Customs Union Impact
- 5.6.3 Major Free Trade Agreements
- 5.6.4 USMCA Rules of Origin
Note: Trade policy analysis will be included only where relevant to the U.S. Quartz market.
Chapter 6. Competitive Landscape & Company Benchmarking
- 6.1 U.S. Quartz Market Concentration & Structure
- 6.1.1 Herfindahl-Hirschman Index (HHI) – vs. 2024
- 6.1.2 Tier 1, Tier 2 & Tier 3 Market Structure
- 6.1.3 Global, Regional & Local Player Dynamics
- 6.2 U.S. Quartz Market Share Analysis – 2024
- 6.2.1 Global Revenue Share by Company
- 6.2.2 Global Volume Share by Company
- 6.2.3 Regional Revenue Share
- 6.2.4 Market Share Evolution ( vs. 2024)
- 6.2.5 OEM Segment Share by Company
- 6.2.6 Replacement Segment Share by Company
- 6.3 Production/Delivery Capacity & Facility Analysis
- 6.3.1 Global Installed Capacity
- 6.3.2 Capacity Utilization Rates
- 6.3.3 Production/Output Volume
- 6.3.4 Facility Locations & Capacity Map
- 6.3.5 Planned Capacity Additions
- 6.4 U.S. Quartz Competitive Benchmarking Matrix
- 6.4.1 Revenue, Volume, CAGR & Profitability Comparison
- 6.4.2 Channel Revenue Mix
- 6.4.3 Geographic Revenue Exposure
- 6.4.4 R&D Intensity
- 6.4.5 Sustainability Maturity
- 6.5 Strategic Developments in U.S. Quartz (Last 24 Months)
- 6.5.1 Mergers, Acquisitions & Divestments
- 6.5.2 New U.S. Quartz Launches
- 6.5.3 Facility Expansions
- 6.5.4 Strategic Alliances, Joint Ventures & Partnerships
- 6.5.5 Distribution Expansion & Market Entry
- 6.5.6 Sustainability & ESG Initiatives
- 6.6 Competitive Strategy Mapping
- 6.6.1 Leader, Challenger, Follower & Niche Classification
- 6.6.2 Pricing Strategy Comparison
- 6.6.3 Channel Strategy Matrix
Note: Strategic developments are included based on their materiality and the availability of reliable information.
Chapter 7. Global U.S. Quartz Market – By Distribution Channel
- 7.1 Segment Overview
- 7.1.1 Volume & Revenue Split by Channel (2024 & 2032)
- 7.1.2 Channel Mix Evolution (2024-2032)
Chapter 8. Regional Market Analysis – Global Overview
- 8.1 Global Regional Overview
- 8.1.1 Regional Volume Share
- 8.1.2 Regional Revenue Share
- 8.1.3 Regional Volume by Region
- 8.1.4 Regional Revenue by Region
- 8.1.5 Regional Forecast Through 2032
- 8.2 Cross-Regional Segment Analysis
- 8.2.1 By Distribution Channel
- 8.2.2 By Brand/Price Tier
Chapter 9. North America U.S. Quartz Market
- 9.1 United States
- 9.2 Canada
- 9.3 Mexico
Chapter 10. Europe U.S. Quartz Market
- 10.1 Germany
- 10.2 France
- 10.3 Italy
- 10.4 United Kingdom
- 10.5 Spain
- 10.6 Poland
- 10.7 Russia
- 10.8 Netherlands
- 10.9 Belgium
- 10.10 Sweden
- 10.11 Denmark
- 10.12 Norway
- 10.13 Rest of Europe
Chapter 11. Asia Pacific U.S. Quartz Market
- 11.1 China
- 11.2 India
- 11.3 Japan
- 11.4 South Korea
- 11.5 Thailand
- 11.6 Indonesia
- 11.7 Vietnam
- 11.8 Malaysia
- 11.9 Australia
- 11.10 Rest of Asia Pacific
Chapter 12. Latin America U.S. Quartz Market
- 12.1 Brazil
- 12.2 Argentina
- 12.3 Colombia
- 12.4 Chile
- 12.5 Rest of Latin America
Chapter 13. Middle East U.S. Quartz Market
- 13.1 Saudi Arabia
- 13.2 United Arab Emirates
- 13.3 Turkey
- 13.4 Israel
- 13.5 Iran
- 13.6 Rest of the Middle East
Chapter 14. Africa U.S. Quartz Market
- 14.1 South Africa
- 14.2 Egypt
- 14.3 Nigeria
- 14.4 Morocco
- 14.5 Rest of Africa
Chapter 15. U.S. Quartz Company Profiles
- 15.1 [Company 01]
- 15.1.1 Company Overview
- 15.1.2 Key Management Personnel
- 15.1.3 Products & Services Portfolio
- 15.1.4 Financial Performance
- 15.1.5 Key Market Focus & Geographic Presence
- 15.1.6 Recent Developments & Strategic Initiatives
Note: The company profile list is preliminary and may change based on research findings, market developments, data availability, and client requirements.
Chapter 16. Appendices
- Appendix A – List of Abbreviations & Acronyms
- Appendix B – Industry Classification Code Reference – Full Series
- Appendix C – Production & Capacity Data Tables
- Appendix D – End-Use & Demand Base Tables
- Appendix E – Consumption & Replacement Rate Assumptions
- Appendix F – ASP Reference Tables
- Appendix G – Manufacturing & Facility Database
- Appendix H – Import-Export Data Tables
- Appendix I – Regulatory Summary Tables
- Appendix J – Primary Research Participant List (Anonymized)
- Appendix K – Primary Research Questionnaire Framework
- Appendix L – Data Sources & Bibliography
- Appendix M – Market Size Divergence & Source Comparison
Chapter 17. Research Methodology
- 17.1 Research Framework & Philosophy
- 17.2 Secondary Research – Sources, Hierarchy & Data Extraction
- 17.3 Data Modeling – Bottom-Up & Top-Down Market Sizing
- 17.4 Primary Research – Stakeholder Framework, LOI & Sample Sizes
- 17.5 Forecast Methodology – Regression, Scenario & Sensitivity Analysis
- 17.6 Quality Control – Four-Layer Validation Framework
- 17.7 Limitations & Standard Assumptions
- 17.8 Disclaimer
